City Explorer

OVERVIEW
The benefits of urban green and blue space are widely discussed, but rarely take into account local conditions or context. Although spatial assessment methods increasingly consider the demand for services, they tend to only map the spatial pattern of pressure and lack a wider understanding of where the beneficiaries are located and who will benefit most. In addition, many assessments of ecosystem services assume all greenspace provides the same level of benefit, regardless of where it is located.
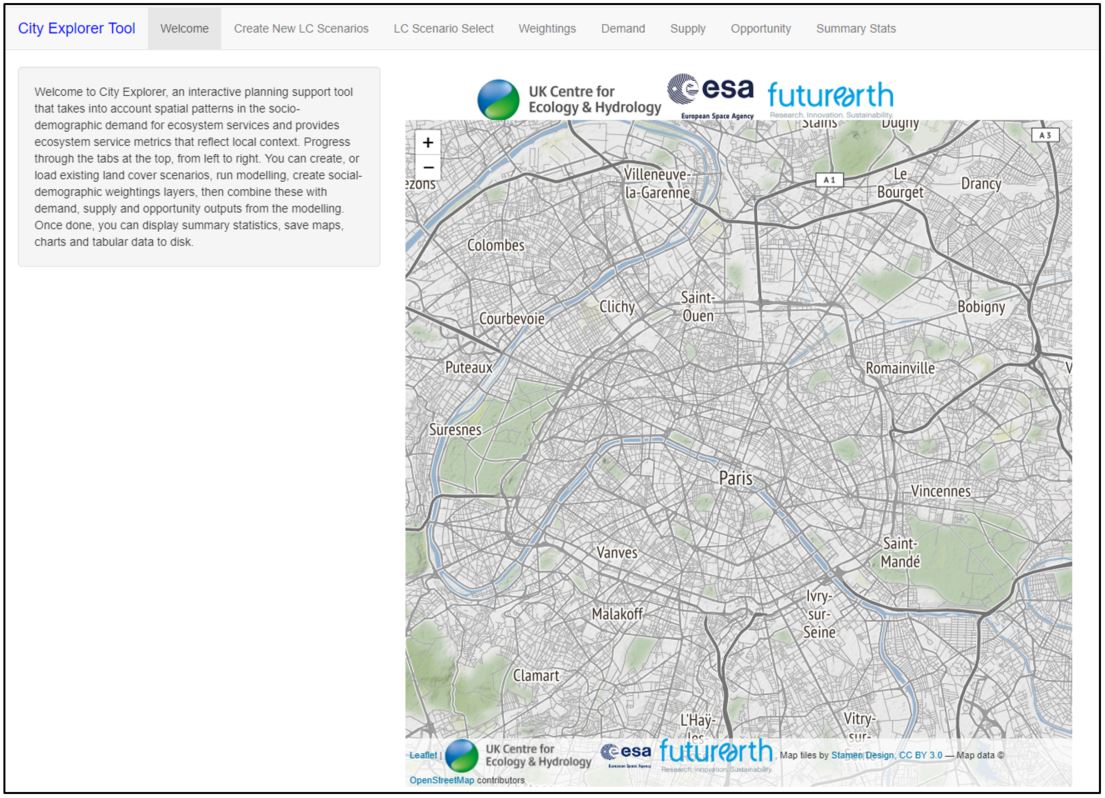
Here, we demonstrate a new interactive modelling tool that will be able to take into account spatial patterns in the socio-demographic demand for ecosystem services and to calculate ecosystem service metrics that vary with local context. The City Explorer planning support tool currently shows the expected benefits of three ecosystem services associated with urban green or blue space: fine PM2.5 particles removal by woodland, traffic noise mitigation by woodland, and cooling provided by urban green and blue space (i.e. grass, trees, ponds, rivers). The tool allows users to add in new greenspace into a city environment to compare the relative benefits of different locations. Focal demographic group vulnerability, or importance, can be used to weight the final output, allowing users to identify optimal spatial configurations, tailored to the specific requirements of the city or region being assessed.
City Explorer is funded by the ESA-FutureEarth partnership, as a data demonstrator for the COP26 conference.
Application site(s)
Paris, France
DATA
Satellite
- Sentinel-1 (radar)
- Sentinel-2 (optical)
- ESA_CCI_Soil_Moisture
- LandSat-8 (Land Surface Temperature LST)
Other
- E-Obs historic weather observations,
- BruitParif noise map data (LDen indicator)
- AirParif PM2.5 concentration data
- Densibati Paris residential buildings data
- Filosofi 2015 Paris population demographics data
RESULTS - FINAL PRODUCTS
City Explorer Data Demonstrator R-shiny App: users progress through a familiar web-tab interface, creating or loading land cover scenarios, running models, creating social-demographic weightings (to reflect local priorities) and then mapping demand, supply and opportunity metrics of the three ecosystem services. Users will also be able to save hard copies of maps, download charts and tabular data and even GIS files.