

e-SAFARI
 to red (very strong heat stress). While this example covers one city quarter of Niamey, the project will scale this up to cover the (present and future) extent of the entire agglomeration.")
Ecosystem-based adaptation to future heat extremes in African cities
Overview
Exposure to extreme heat in African cities is projected to increase 20-fold and more during this century, owing to the combined effects of climate change and an explosive urban population growth (Rohat et al., 2019; also see Figure 1). Yet, the impacts of heat extremes are largely ignored in Africa, the lack of suitable local climate information constituting an important cause (Harrington and Otto, 2020). At the same time, most urban climate models lack sufficient spatial detail to be of use for developing adaptation measures (Graça et al., 2022). This lack of spatial detail is itself largely related to the lack of appropriate high-resolution (metre-scale) 3D digital urban terrain data.
Considering that – for Africa’s fast-growing cities – now is the time to grab (or lose…) the opportunity to steer urban growth in a sustainable way, the project’s objective is to generate a decision support tool to underpin climate-resilient urban planning, with a focus on excessive heat. This tool will:
- contain city-wide sectoral climate risk maps at metre-scale resolution;
- consider both present and future climate;
- incorporate future urban growth scenarios.
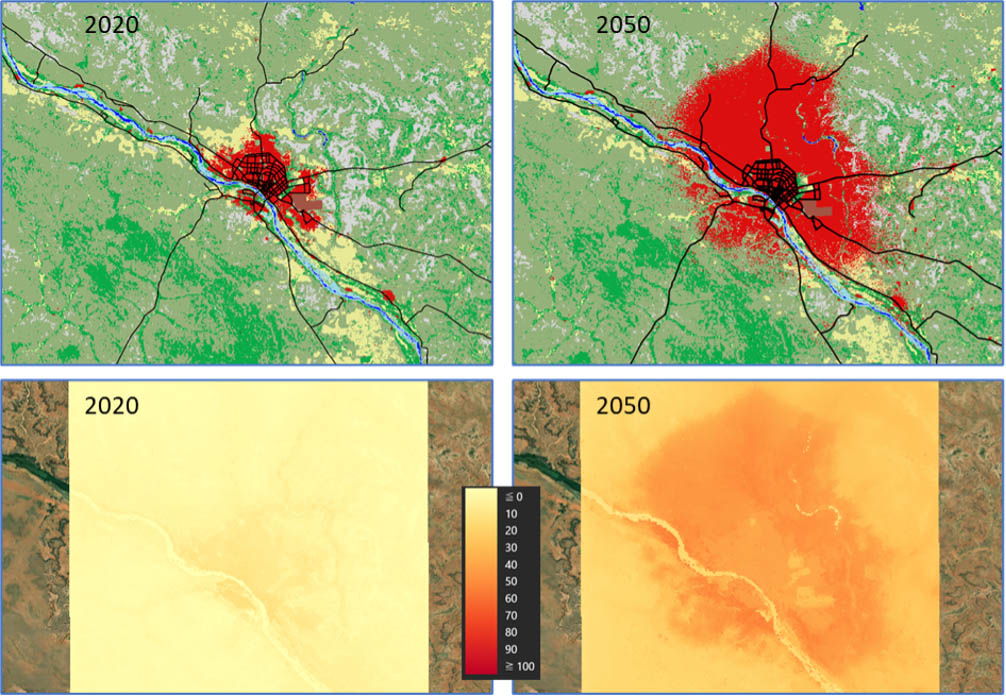 |
Figure 1. The upper panels show the present (left) and future (right) layout of Niamey, the corresponding population numbers being 2 million and 9.5 million, respectively. The lower panels show the modelled annual number of heatwave days in 2020 (left) and 2050 (right). © VITO and ACMAD (u-CLIP project) |
| The tool will be dynamic, allowing users to browse through the 3D urban landscape and assess, among other things, the effects of urban green infrastructure on local heat exposure. It will be designed to support the development of adaptation strategies, targeting policy makers, civil society organisations and businesses, with a focus on Ecosystem-based Adaptation (EbA), including urban tree planting (Figure 2). | 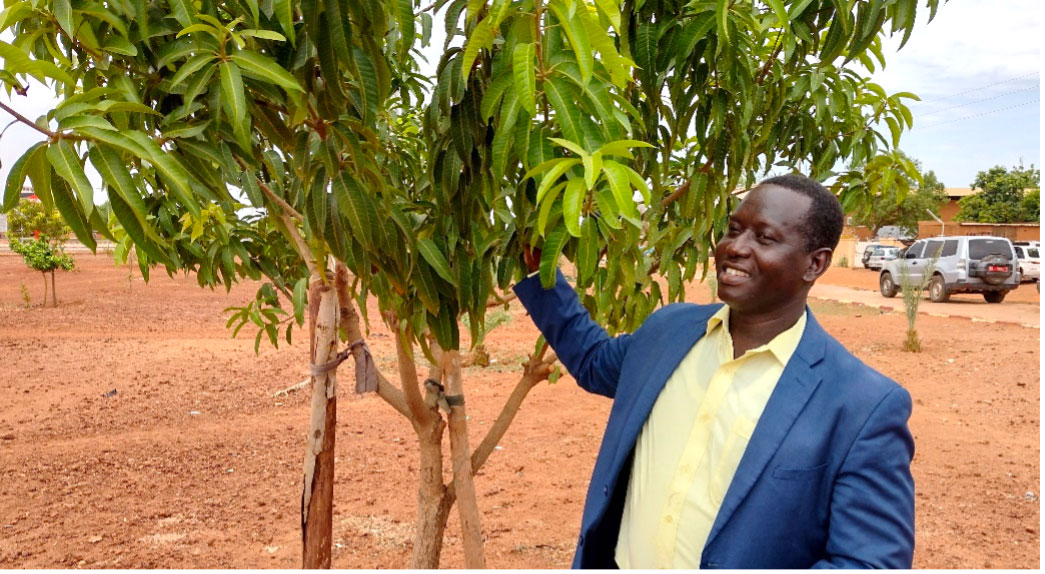 Figure 2. M Toudjani Hassoumi, Director of Niamey’s Environment Department, posing with a climate tree planted by his services in the city. © VITO |
👉 e-SAFARi is funded by the Global EbA Fund, a funding mechanism, implemented by IUCN and UNEP, "for catalytic, innovative, and inclusive projects that aim to create an enabling environment for the implementation of Ecosystem-based Adaptation (EbA) to enhance the resilience of vulnerable communities and ecosystems to the impacts of climate change".
Methodology
As a first step, we will generate urban climate maps for Niamey at the scale of individual buildings and trees, while covering the full extent of the city. This will be achieved by processing fine-scale open-source satellite-based imagery to yield metre-scale 3D maps containing buildings and vegetation contours and heights. Subsequently, the resulting 3D maps will be used as input for VITO’s UrbClim and HiREx urban climate models (De Ridder et al., 2015; Souverijns et al., 2022; Souverijns et al., 2023) to simulate climatic variables for present and future (climate change) conditions.
The present-day urban climate simulations will be validated by means of heat stress measurements (represented by the wet bulb globe temperature, or WBGT, see Figure 3), gathered with the help of community participants. The instruments to conduct the measurements with will be built in Niamey, based on a recently developed prototype and involving a local technical school. With respect to the future (climate change) projections, we will investigate and implement methods to generate future urban growth scenarios down to the level of individual buildings (in a statistical sense), starting from the 3D satellite-based maps.
The raw simulated urban climate information will be combined with socio-economic information to yield sectoral climate indicators, such as excess mortality, labour productivity loss, and cooling energy consumption. This information will be incorporated in an online dashboard, the latter allowing users to interactively visualise the climate information, to select indicators, time horizons, climate scenarios etc… and with options to generate graphs for selected positions and download maps and time series data.
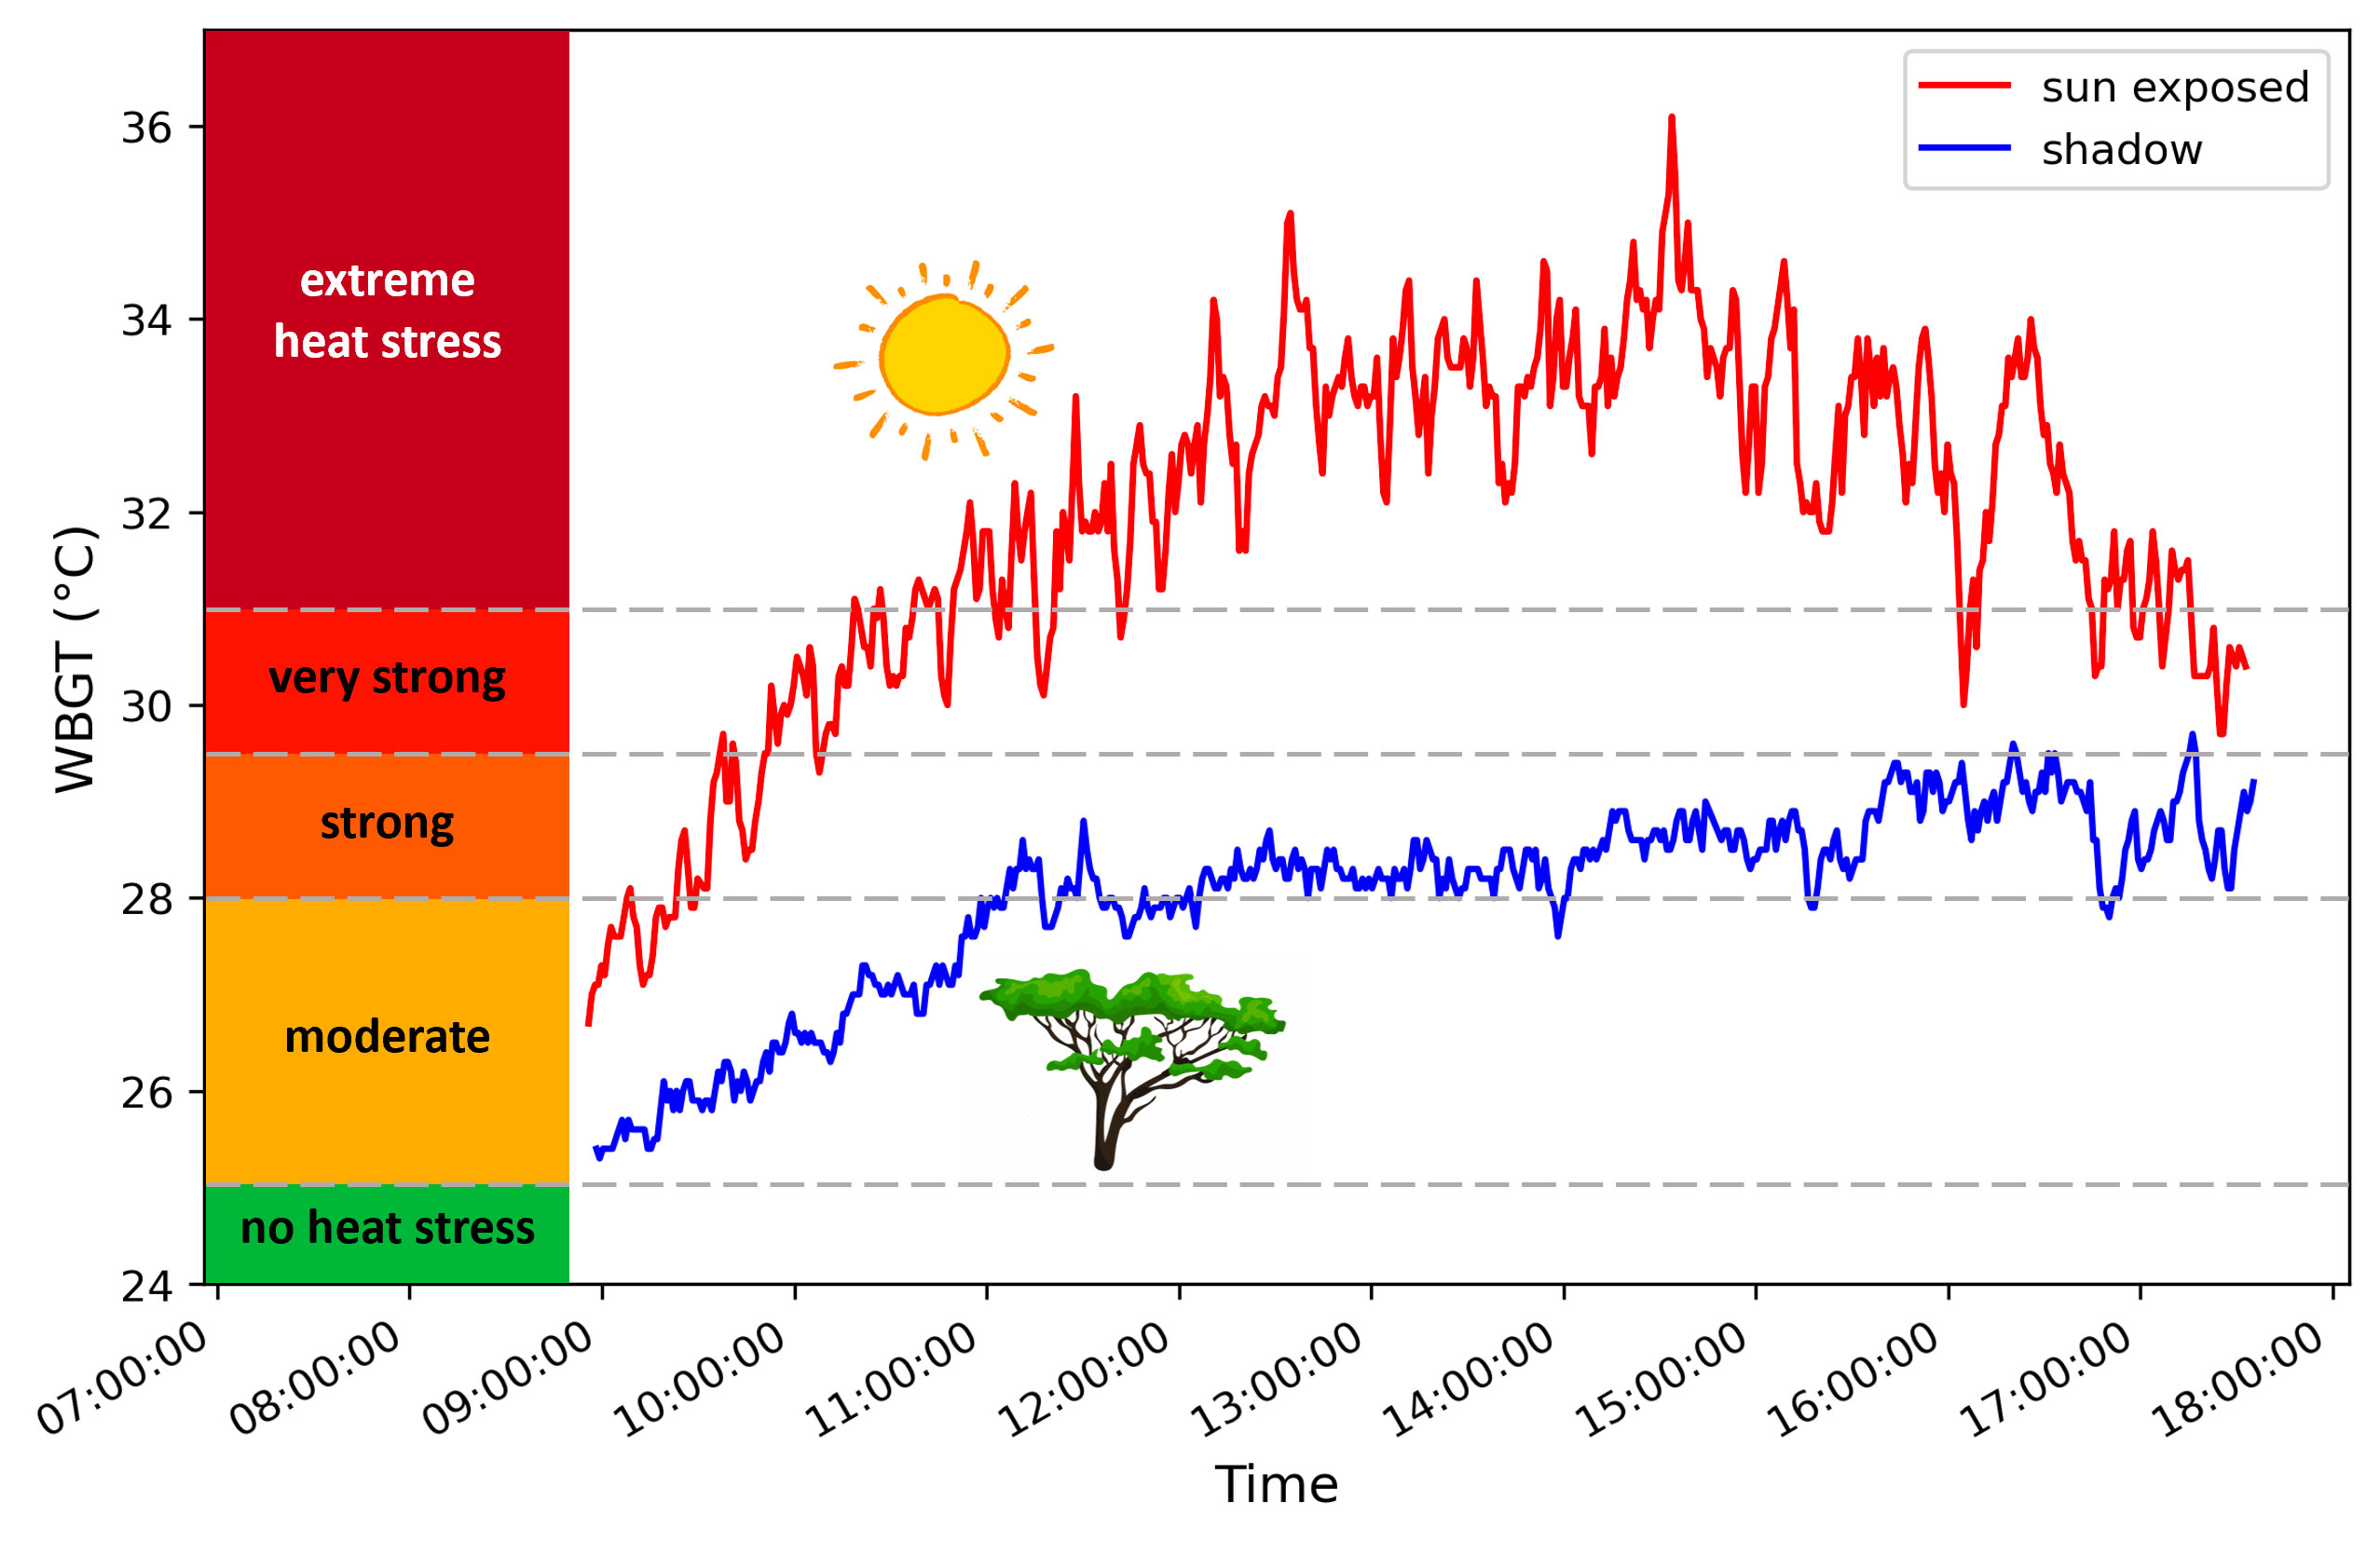 |
Figure 3. Heat stress, as represented by the wet-bulb globe temperature (WBGT), measured in the shade of a tree (blue curve) and at a nearby sun-exposed location (red curve) in Niamey, showing the beneficial impact of urban trees in attenuating heat extremes. In e-SAFARI, measurements like this will be much extended. © VITO, ACMAD, Ville de Niamey (Niamey Climate Forest project) |
In order to ensure the relevance of the proposed work, local stakeholders will be involved throughout the project, including in the selection of the sectoral climate indicators and the design of the dashboard. At a later stage, training seminars will be organized, and the use of the dashboard as a tool to underpin adaptation policy will be explored. For this, we plan a demonstration on dedicated use cases, including the planning and management of urban green and the use of 3D urban microclimate maps in the climate-resilient design of new city quarters. Moreover, e-SAFARI will reach out to 8,000 young people through schools-based ‘climate clubs’.
Application site(s)
- Niamey, Niger
The choice for Niamey, capital of Niger, is inspired by the anticipated considerable rise of extreme heat, together with an expected huge urban population growth (from 2 million inhabitants today to an estimated 9.5 million by 2050). In the longer run, the goal is to transfer the dashboard and metre-scale urban climate simulations to other African cities.
Data
Satellite
- ESA CCI 300-m Land Cover time series (for urban growth model calibration) from a.o. MERIS
- ESA WorldCover 10-m land cover & NDVI from Sentinel-1 and Sentinel-2
- Tree crown footprints and heights from Maxar (Tolan et al., 2024)
- Building footprints and heights from Maxar and Sentinel-2 (Sirko et al., 2021; 2023).
Other
- ERA5 re-analysis atmospheric fields (Copernicus Climate Data Store)
- CMIP6 climate projections (Copernicus Climate Data Store)
- Local socio-economic data, e.g., excess mortality, energy consumption, housing quality
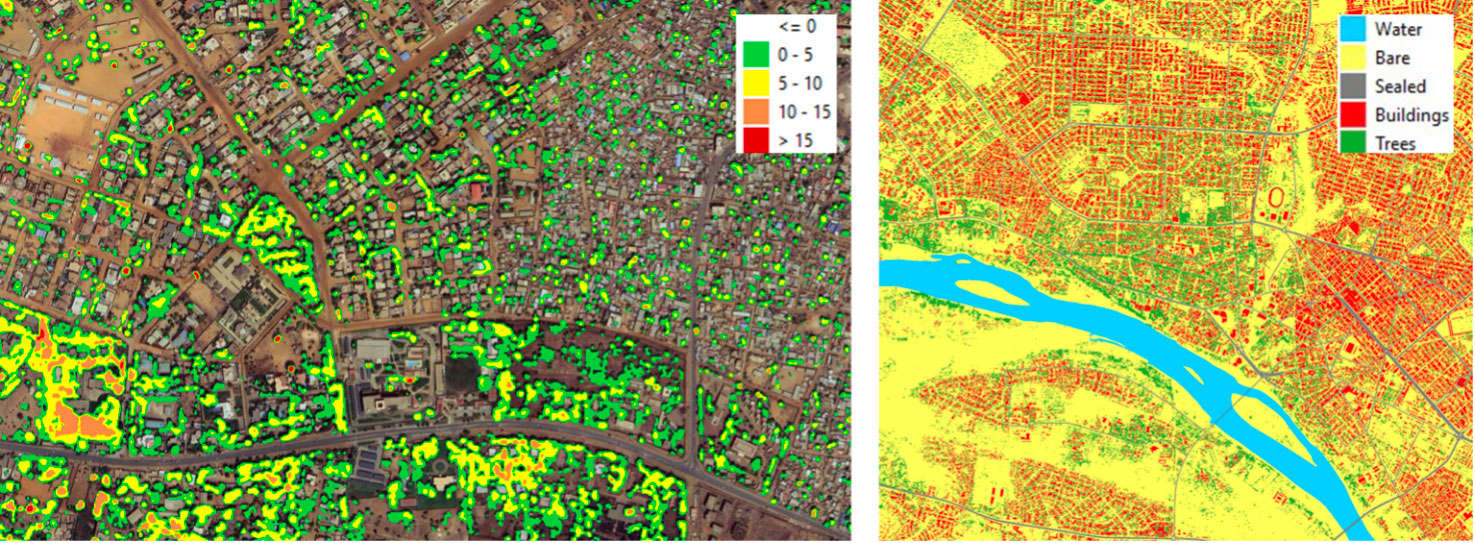
Figure 4. Tree crown footprints and heights (left) and land cover with high-resolution buildings and vegetation (right). © VITO, based on data from Tolan et al. (2024) and Sirko et al. (2021, 2023).
Results - Final products
The main outcome will consist of a decision support tool in the form of a web-based dashboard containing very fine-scale present and future urban climate information, with a focus on excessive heat and the attenuating role of urban trees.
The dashboard will be freely accessible to anyone and hosted at the African Climate Centre ACMAD in Niamey. It will contain a range of sectoral climate indicators (related to health, energy, economy) at metre-scale resolution, while covering the entire urban agglomeration of Niamey. It will be equipped with advanced functionalities to explore the information contained in it, such as zooming, selection of points within a map and displaying detailed graphs, selection of climate scenarios and time horizons, etc… The dashboard will also contain data from the monitoring campaigns, again with a focus on capturing the local cooling effect of trees.
References
- De Ridder, K., D. Lauwaet, B. Maiheu, 2015. UrbClim – a fast urban boundary layer climate model. Urban Climate, 12, 21-48. https://doi.org/10.1016/j.uclim.2015.01.001
- Graça, M., S. Cruz, A. Monteiro, T.-S. Neset, 2022. Designing urban green spaces for climate adaptation: A critical review of research outputs. Urban Climate, 42, 101126. https://doi.org/10.1016/j.uclim.2022.101126
- Harrington, L.J., and F.E.L. Otto, 2020. Reconciling theory with the reality of African heatwaves. Nature Climate Change, 10, 796–798. https://doi.org/10.1038/s41558-020-0851-8
- Rohat, G., Flacke, J., Dosio, A., Dao, H., van Maarseveen, M., 2019. Projections of human exposure to dangerous heat in African cities under multiple socioeconomic and climate scenarios. Earth's Future, 7, 528– 546. https://doi.org/10.1029/2018EF001020
- Sirko, W., Brempong, E.A., Marcos, J.T., Annkah, A., Korme, A., Hassen, M.A., Sapkota, K., Shekel, T., Diack, A., Nevo, S., Hickey, J., & Quinn, J., 2023. High-Resolution Building and Road Detection from Sentinel-2. https://doi.org/10.48550/arXiv.2310.11622
- Sirko, W., Kashubin, S., Ritter, M., Annkah, A., Bouchareb, Y.S., Dauphin, Y., Keysers, D., Neumann, M., Cissé, M., & Quinn, J., 2021. Continental-Scale Building Detection from High Resolution Satellite Imagery. https://doi.org/10.48550/arXiv.2107.12283
- Souverijns, N., De Ridder, K., Takacs, S., Veldeman, N., Michielsen, M., Crols, T., Foamouhoue, A. K., Nshimirimana, G., Dan Dijé, I., & Tidjani, H., 2023. High resolution heat stress over a Sahelian city: Present and future impact assessment and urban green effectiveness. International Journal of Climatology, 43, 7346–7364. https://doi.org/10.1002/joc.8268
- Souverijns, N., K. De Ridder, N. Veldeman, F. Lefebre, F. Kusambiza-Kiingi, W. Memela, N. K.W. Jones, 2022. Urban heat in Johannesburg and Ekurhuleni, South Africa: A meter-scale assessment and vulnerability analysis. Urban Climate, 46, 101331, https://doi.org/10.1016/j.uclim.2022.101331
- Tolan, J., H.-I. Yang, B. Nosarzewski, G. Couairon, H.V. Vo, J. Brandt, J. Spore, S. Majumdar, D. Haziza, J. Vamaraju, T. Moutakanni, P. Bojanowski, T. Johns, B. White, T. Tiecke, C. Couprie, 2024. Very high resolution canopy height maps from RGB imagery using self-supervised vision transformer and convolutional decoder trained on aerial lidar. Remote Sensing of Environment, 300, 113888, https://doi.org/10.1016/j.rse.2023.113888
Related projects
- u-CLIP – Urban Climate Information Platform - Enabel, the Belgian Development Agency, 2021-2023)
- Facilitating community-driven urban heat monitoring campaign and policy support in Johannesburg and Ekurhuleni, South-Africa - World Bank, 2021-2022 🎥 Presentation video
- Niamey Climate Forest - Climate Action Programme of the Flemish Government, 2022-2024) 🎥 Presentation video
- Climate Analysis in African Cities (CAIAC) - European Space Agency, 2025-2026
Project news
- 🎥 21/05/2026: Presentation of the e-SAFARI project and its progress at the 4th ClimateSCOpe “Climate adaptation in Africa”