

EHOP
Environmental Hotspots
Overview
The Environmental Hotspots (EHOP) project is a dynamic and innovative initiative developed within the framework of the United Nations Environment Programme Global Resource Information Database (UNEP-GRID). It is designed to highlight key environmental changes around the world. It focuses on critical issues such as climate change, deforestation, lake and sea desiccation, urban expansion, land degradation, pollution, and the environmental consequences of conflicts and natural disasters. By combining scientific data with user-friendly technology, the platform aims to support awareness, monitoring, and decision-making processes.
At the heart of the project lies an interactive web platform that allows users to visualize environmental changes over time. Building on UNEP's past experience — including the production of global environmental atlases featuring 279 sites — the process has now been fully automated. Any site can be processed within minutes using open-source tools. This automation enables faster and more scalable coverage of environmental hotspots, which can benefit a wide range of users: governments, civil society, educators, journalists, and the general public.
Beyond its technical capabilities, the project incorporates expert knowledge to ensure that the most relevant and impactful environmental sites are featured. Automated processes are also in place to quickly convert raw satellite imagery (e.g. from Landsat and Sentinel-2) into processed, cloud-free visualizations. A dedicated tool has been developed for fast image selection, optimizing the user experience and ensuring high-quality visual outputs.
Application site(s)
The whole world
Data
Satellite
- Landsat
- Sentinel-2
Results - Final product(s)
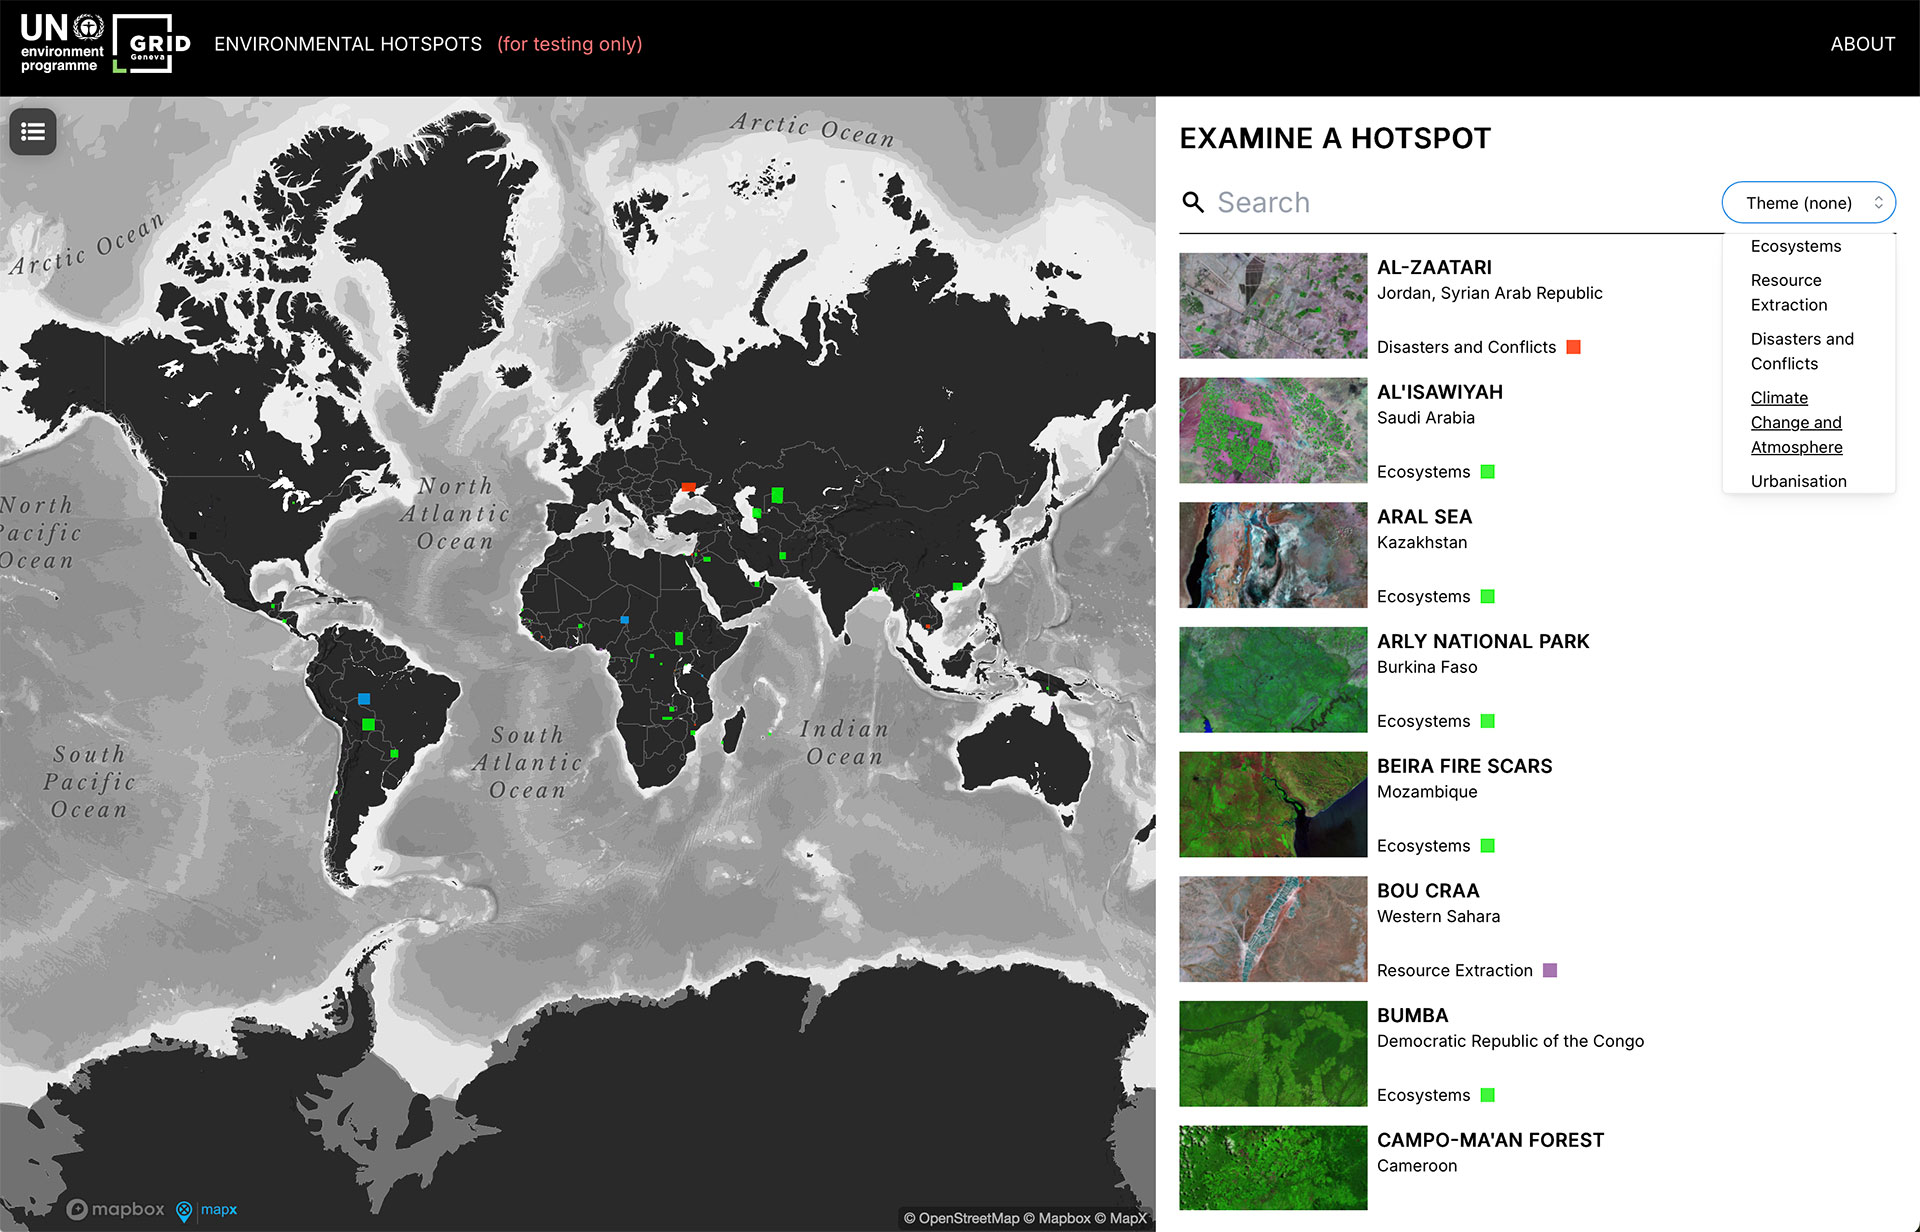
👉 After 12 months of development, the platform prototype includes more than 150 sites where users can explore landscape transformations from the 1980s to the present day : https://hotspots.unepgrid.ch.
Through a simple interface, users can select specific dates, satellite image bands, and display modes — including side-by-side comparison or swipe views and comparing up to four images simultaneously. The platform also supports zooming, panning.
For more targeted analyses, custom data cubes can be generated on demand, offering powerful tools for time-series visualization and environmental trend detection.
|
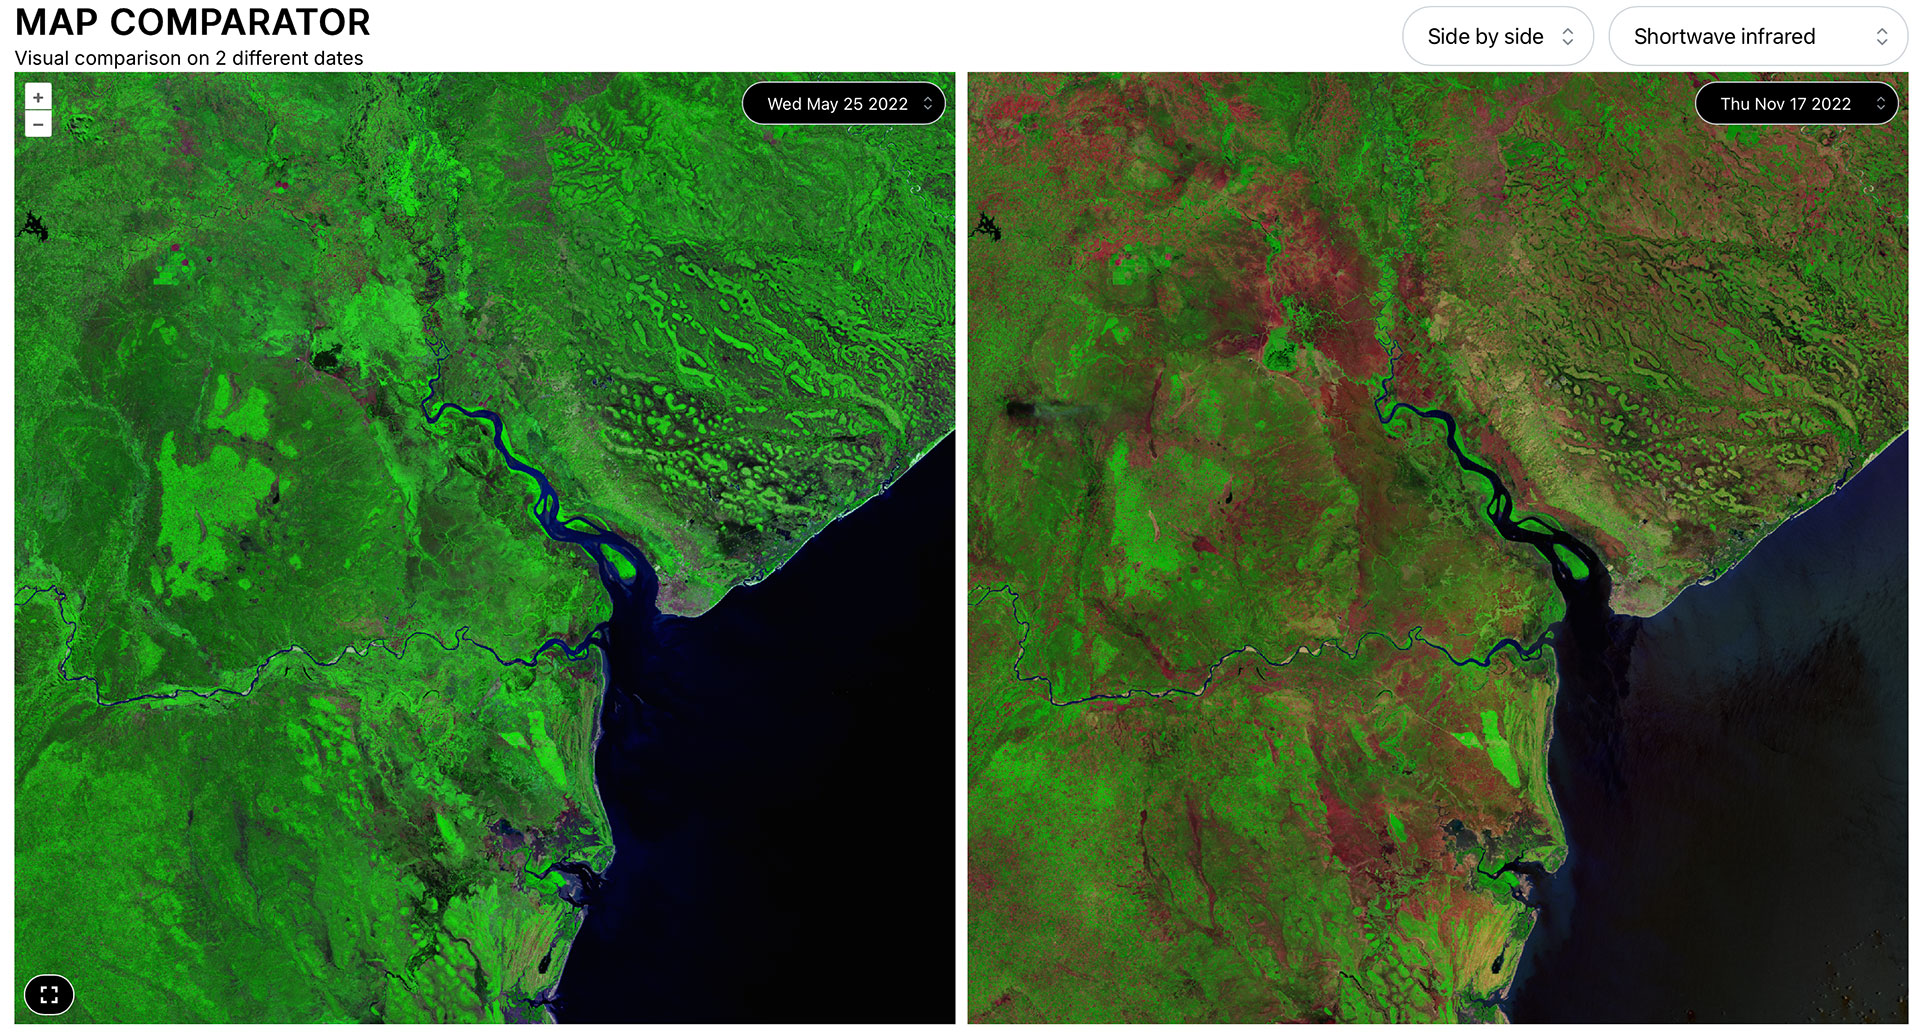
► Map comparator showing burn scars before and after the Beira fire in Mozambique, May vs. November 2022. © UNEP GRID |
|
👉 By month 24, the platform will expand to cover at least 300 sites, powered entirely by open-source code. Thanks to advanced functionality, users will be able to calculate indices such as NDVI (vegetation) or NPP (net primary production, i.e., the amount of carbon captured by plants in an ecosystem). They will also be able to instantly generate trend graphs for dynamic environmental analysis. All data and tools will be fully and freely accessible to everyone.