EO4Intertopo
Observation of changes in the topography of coastal intertidal zones from space in the context of climate change
Project CompletedThe EO4Intertopo project produced annual digital elevation models of the intertidal zone for the period 2016–2025, substrate classification maps, erosion-accretion maps, and associated sediment budgets for the entire Normandy coastline. These products are accessible via two online applications developed on Google Earth Engine: the EO4Intertopo application and the Wateroccmapapplication.
Overview
Context
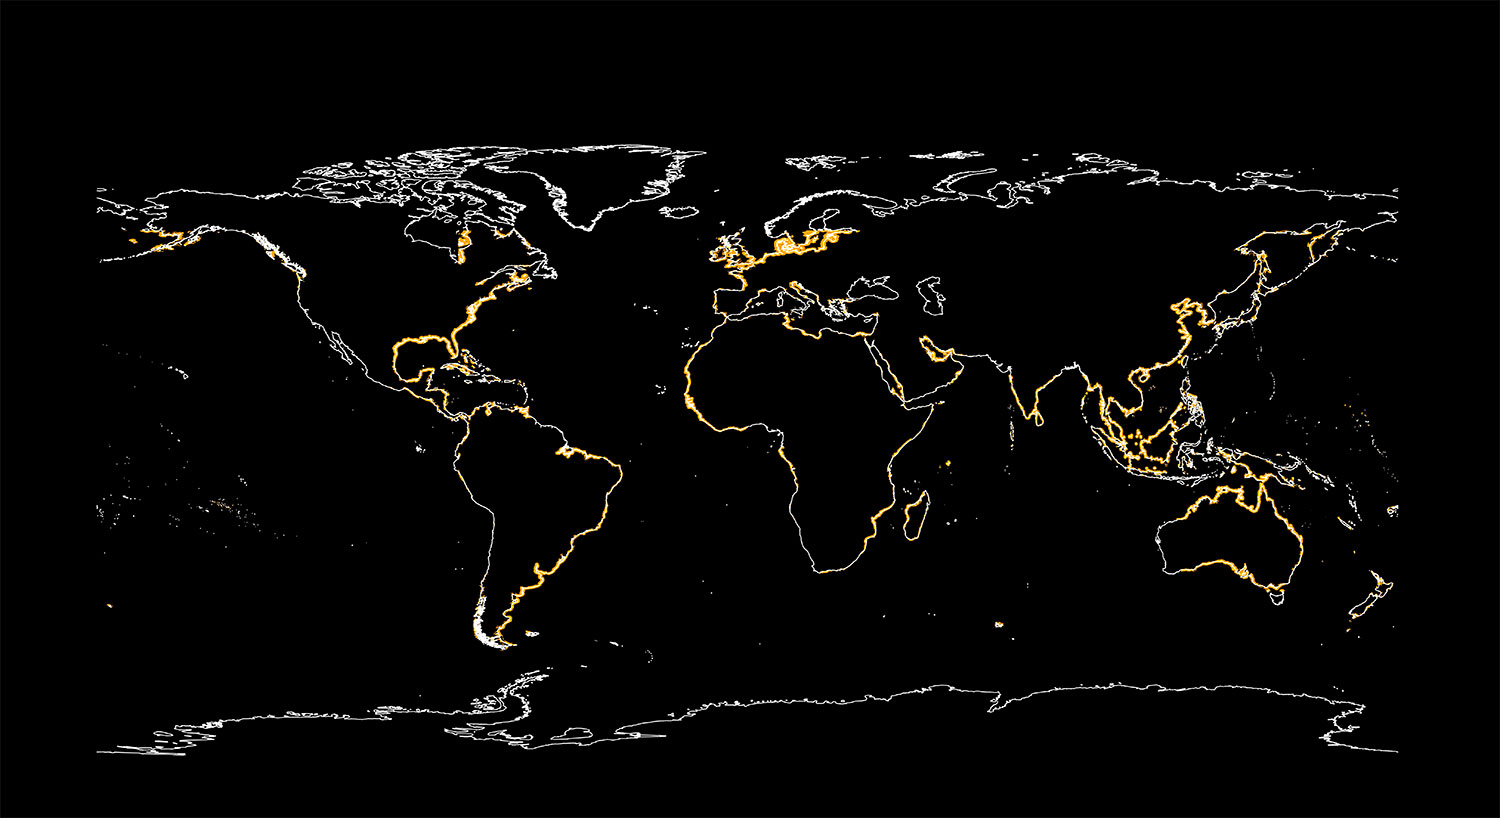
Coastal regions are increasingly vulnerable due to the effects of climate change. It has become imperative to put in place effective coastal management strategies to mitigate these risks and protect coastal communities and ecosystems. Intertidal zones, located at the interface between land and sea, are one of the most important natural buffer zones for the protection of coastal regions. These zones cover around 127,000 km2 worldwide (Murray et al. 2019) (Figure 1). They are highly productive areas characterized by high biodiversity and provide natural protection against storms and coastal flooding (Murray et al. 2019). |
|
Human interventions (coastal development, dredging, upstream dams, pollution, etc.) have put these environments under severe pressure. A recent study by Murray et al. (2019) showed that the world's intertidal zones decreased in area by 16% between 1984 and 2016. Reduced sediment supply from rivers, subsidence of deltas, increased coastal erosion and sea level rise are leading to a continued negative trajectory for these ecosystems worldwide. What's more, these environments appear to be particularly vulnerable to the current rise in sea level and its future acceleration, as well as to the intensification of storms. In response to these various oceanographic and hydrological processes, intertidal ecosystems are highly dynamic. Monitoring the dynamics of intertidal zones is therefore crucial for implementing sustainable coastal defense measures and preserving ecological habitats.
Normandy is located in a macrotidal to megatidal environment that is particularly difficult to monitor, with wide variations in water levels (a tidal range that can exceed 10 meters and more, as in the Bay of Mont-Saint-Michel, for example, where it can rise to 15 m in the event of a very high tidal range). In Normandy, intertidal environments are a major coastal environment with major economic and social implications for the region. A range of economic activities (e.g. fishing and oyster farming, shellfish farming, port development, etc.) and tourism rely on these complex and threatened systems (e.g. Mont Saint Michel Bay, Seine Estuary). |
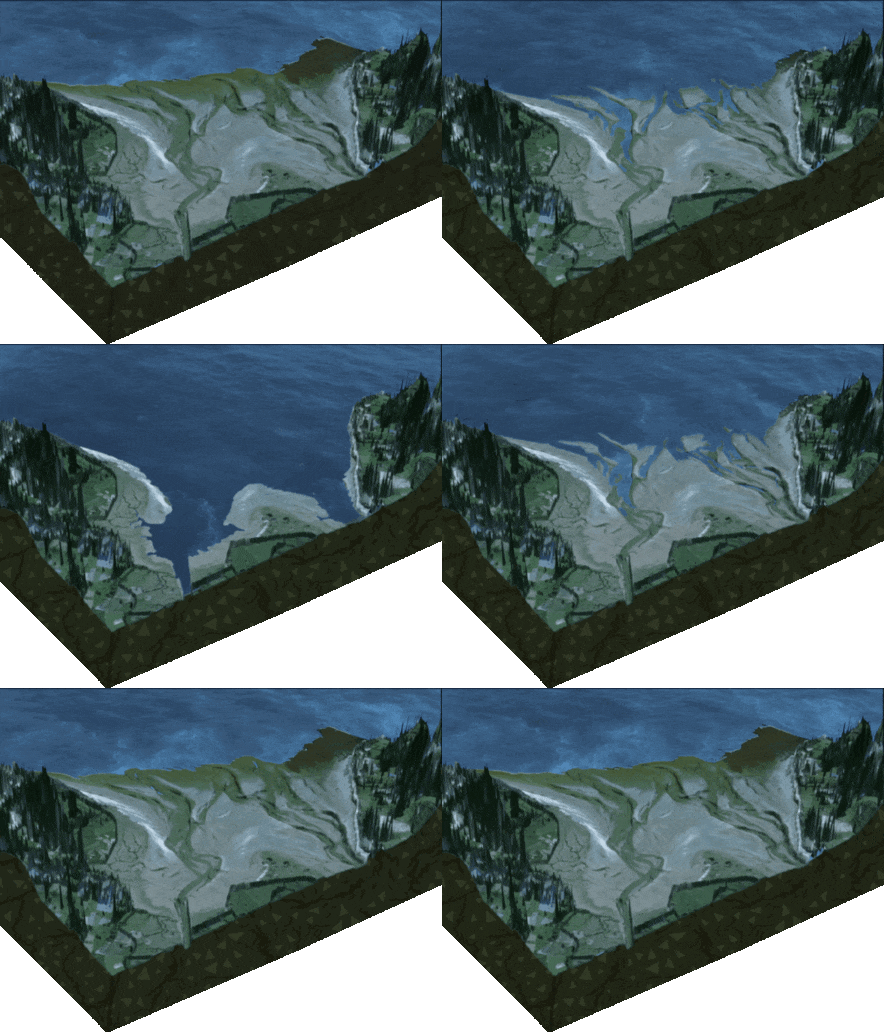
▲︎ 3D animation of the Baie des Veys in Normandy: between the flow of high tides and the retreat of low tides. © CNRS/Edward Salameh |
Objectives
EO4Intertopo is a project that exploits satellite data, in particular optical and radar imagery, to provide accurate mapping and monitoring of intertidal zones along the Normandy coast. By studying morphological changes in these areas, the project aims to support informed decision-making and facilitate proactive coastal management practices for a resilient and sustainable future.
Complete mapping of intertidal topography and substrate (e.g. mud, sand, pebbles, rocks, etc.), and changes in topography for the entire Normandy coast using satellite data (optical, microwave and laser sensors on Earth observation satellites);
Identification of the evolution of intertidal zones (erosion-accumulation) in relation to current forcings and the possible consequences of climate change (rising sea levels and storms);
Generation of products based on satellite data to be used as awareness-raising and decision-making tools for local stakeholders.
Methodology
Digital intertidal elevation models are now generated using the water occurrence method. Starting with a series of Sentinel-2 images, each image is segmented into a water/land mask. The frequency of water occurrence over the time series, calculated pixel by pixel, forms the water occurrence map (Figure 2). This map is directly interpreted as an empirical probability of the tide level being exceeded (F). By coupling this probability with a water depth model (FES2022, HYCOM), a relationship h = f(F) is established, allowing the frequency of occurrence to be inverted into elevation. This method succeeds the waterline method (Mason et al., 1995; Salameh et al., 2020), which was used at the start of the project. It allows for faster, large-scale application, as each pixel is processed separately, including in narrow channels where the waterline cannot be drawn continuously. | 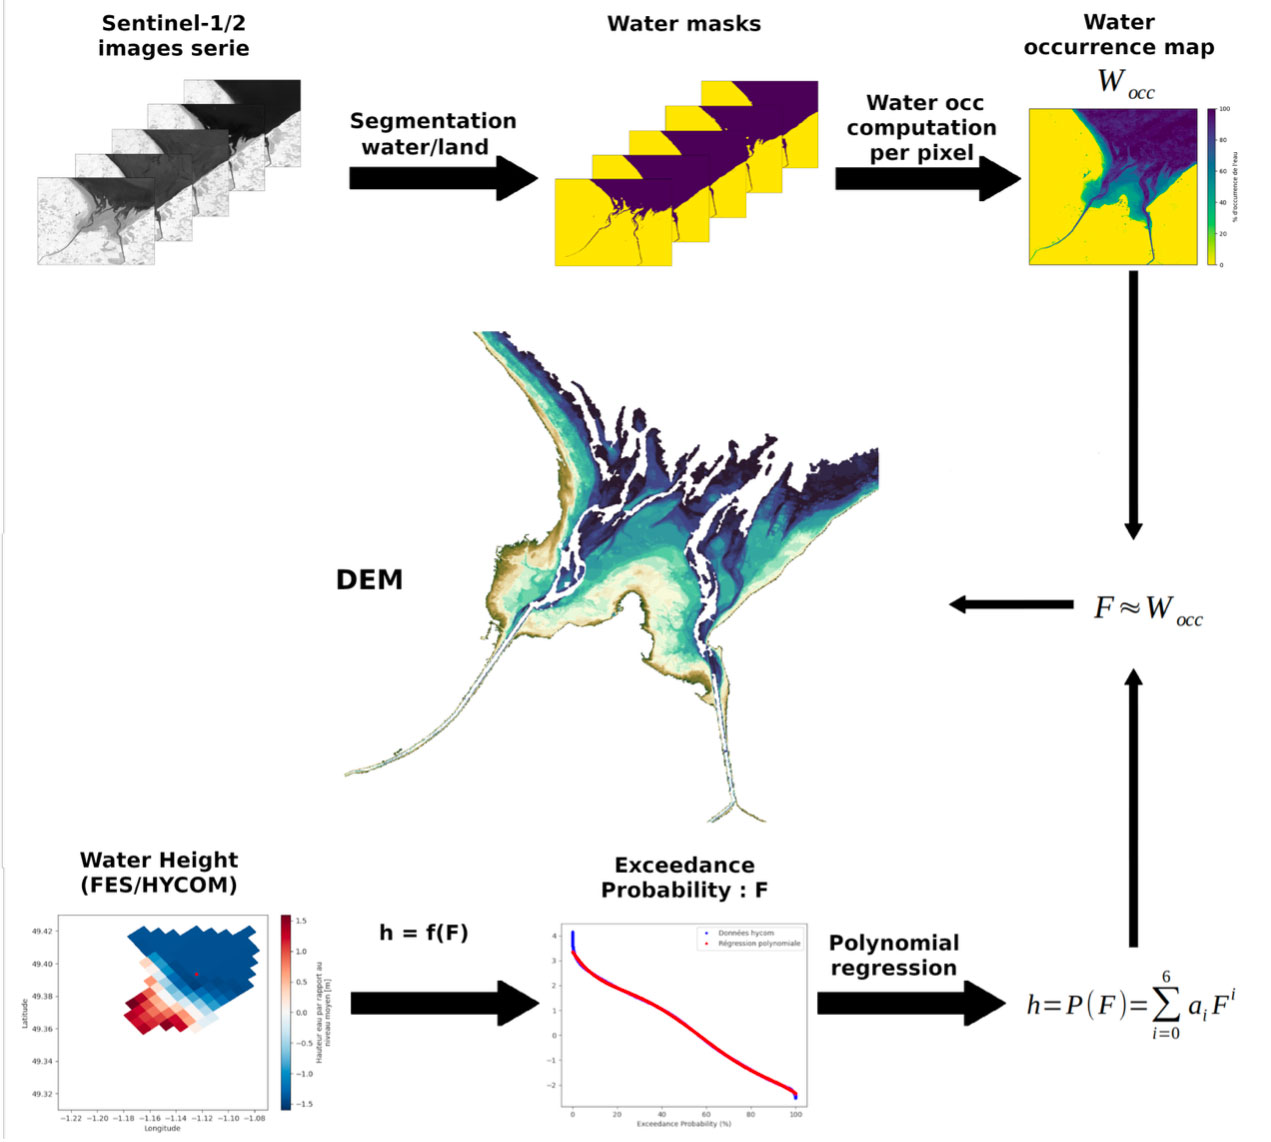 Figure 2. The Water Occurrence Method applied to the Generation of Digital Intertidal Elevation Model |
Application site(s)
The entire coastline of the Normandy region, France
Data
Satellite
Sentinel-1
Sentinel-2
Landsat series
Pleiades
Icesat-2
- SWOT
Modelled data and in-situ observations
Outputs from the Hycom hydrodynamic model supplied by SHOM (Water level + Surge)
The FES tidal model (LEGOS)
Observations made by tide gauges along the Normandy coast
Aerial lidar observations (recurring topo-bathymetric and orthophotographic data from the ROL (Coastal Observation Network, Réseau d'Observation du Littoral), covering the whole of the Normandy and Hauts de France coastline, including the foreshore at low tide during spring tide).
Results - Final product(s)
The project provided local stakeholders, as well as researchers working in coastal environments, with accurate intertidal topographic data covering the entire Normandy coastline, along with two online applications that allow users to view and generate these products from satellite data. ► Figure 3. Overview of the project's processing workflow: data, methods, and outputs. | 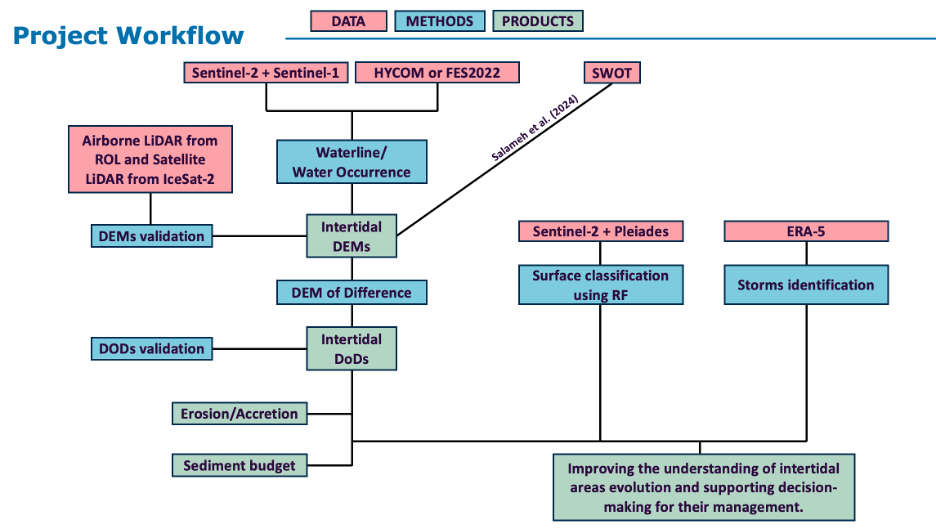 |
The project includes the following components:
Annual topographic maps (2016–2025) of Normandy’s intertidal zones;
Substrate classification maps (six classes: water, sand, silty sand/silt, rock, cobble, shade);
Interannual erosion and accretion maps (including a sediment balance), thereby identifying areas susceptible to erosion;
A catalog of storms identified using wave data (ERA5);
The algorithms developed and the data produced are accessible via the two Google Earth Engine applications listed below and will be made available through the digital atlas of the Normandy and Hauts-de-France Coastal Observation Network and the T.URN platform at the University of Rouen Normandy.
The EO4Intertopo app:
https://ee-eo4intertopo.projects.earthengine.app/view/eo4intertopo
Online application for analyzing changes in Normandy’s intertidal zones:
- View erosion and accretion trends (2017–2024) and significant hotspots along the entire Normandy coastline;
- Draw an area of interest and run a dedicated analysis for that area (trends, hotspots, sediment balance);
- View digital intertidal elevation models by source and by year;
- View substrate classification by year;
- View ERA5 wave data at a given point, with storm identification;
- Extract topographic profiles.
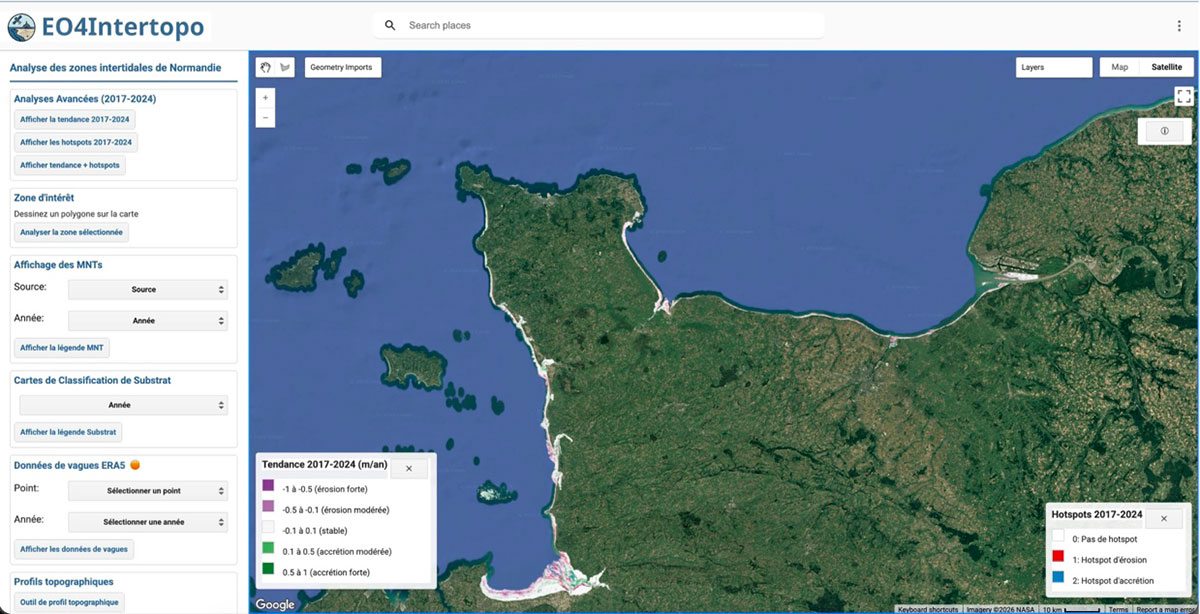 | 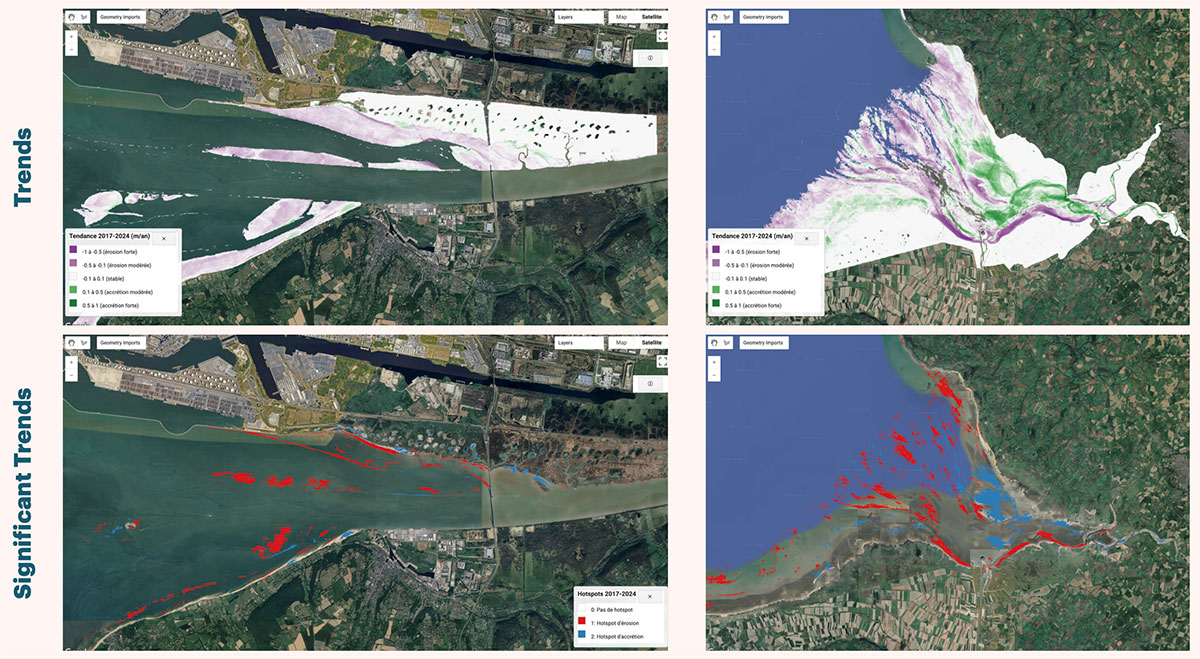 |
Figure 4. Erosion-accretion trends (2017–2024) and significant hotspots identified using the EO4Intertopo application, illustrated for two sections of the Normandy coastline.
The Wateroccmap application:
https://ee-eo4intertopo.projects.earthengine.app/view/wateroccmap
The Waterocc application allows users to apply the water occurrence method themselves to the Normandy coastline, beyond the 2016–2025 period covered by the products already generated: selecting an area of interest in Normandy, calculating the water occurrence map from a series of Sentinel-2 images, and performing elevation inversion by coupling the data with a water depth model.
Outlook
The methods developed in EO4Intertopo are being extended to the entire French coastline as part of the InterTideFrance doctoral thesis, which began in October 2025.
References
 | EO4Intertopo on GEO Knowledge Hub, a long lasting digital repository created by the Group on Earth Observations: https://doi.org/10.60566/rw2r0-t3e43 |
Salameh, E., Desroches, D., Deloffre, J., Fjørtoft, R., Mendoza, E. T., Turki, I., Froideval, L., Levaillant, R., Déchamps, S., Picot, N., Laignel, B., Frappart, F. (2024). Evaluating SWOT's interferometric capabilities for mapping intertidal topography. Remote Sensing of Environment, 314, 114401.
Salameh, E., Frappart, F., Desroches, D., Turki, I., Carbonne, D., & Laignel, B. (2021). Monitoring intertidal topography using the future SWOT (Surface Water and Ocean Topography) mission. Remote Sensing Applications: Society and Environment, 23.
Salameh, E., Frappart, F., Turki, I., & Laignel, B. (2020). Intertidal topography mapping using the waterline method from Sentinel-1 & -2 images: The examples of Arcachon and Veys Bays in France. ISPRS Journal of Photogrammetry and Remote Sensing, 163.
Murray, N. J., Phinn, S. R., DeWitt, M., Ferrari, R., Johnston, R., Lyons, M. B., Clinton, N., Thau, D., & Fuller, R. A. (2019). The global distribution and trajectory of tidal flats. Nature, 565(7738), 222–225.
Salameh, E., Frappart, F., Almar, R., Baptista, P., Heygster, G., Lubac, B., Raucoules, D., Almeida, L. P., Bergsma, E. W. J., Capo, S., de Michele, M. D., Idier, D., Li, Z., Marieu, V., Poupardin, A., Silva, P. A., Turki, I., & Laignel, B. (2019). Monitoring Beach Topography and Nearshore Bathymetry Using Spaceborne Remote Sensing: A Review. Remote Sensing, 11(19).
Mason, D. C., Davenport, I. J., Robinson, G. J., Flather, R. A., & Mccartney, B. S. (1995). Construction of an inter-tidal digital elevation model by the “water-line” method. Geophysical Research Letters, 22(23), 3187–3190.
Related project(s)
SCOast-DT, Coastal Zone Digital Twin
Project news
- 🎥 17/09/2026: Presentation of the EO4InterTOpo project and its platform at the 22nd Quarterly Meeting of SCO France, live from the GDDS: “Geodata Builds Regional Resilience”
- 24/08/2026: EO4Intertopo, 800 km² of the Normandy foreshore monitored from space
- 🎥 27/03/2025: Presentation of the EO4INterTopo project and its progress at the 16th SCO France Quarterly Meeting "Coastal ranges: issues and solutions"
- 12/11/2024: EO4InterTopo automates intertidal topographic mapping