ERA Explorer
Global climate data accessible to all
Overview
|
ERA5 is among the most used climate monitoring datasets worldwide. It is produced by the European Centre for Medium-Range Weather Forecasts (ECMWF) in the context of the implementation of the Copernicus Climate Change Service (C3S), a task delegated to it by the European Commission. ERA5 is the latest and fifth generation of ECMWF reanalyses covering the period from 1940 onwards: reanalyses are produced by re-processing a huge number of satellite and non-satellite observations using ECMWF’s highly successful global numerical weather prediction system. |
ERA5 climate monitoring information reaches today audiences of hundreds of millions through monthly climate bulletins and the European State of the Climate, which is relayed in most media worldwide. The predecessor of ERA5 has been cited over one hundred times in the 6th IPCC Assessment Report, and it is very likely that it will be at least equivalently cited in the upcoming 7th Assessment Report. The main scientific article about ERA5 is among the most cited paper in all of geosciences. ECMWF has recently procured a study about the economic value of ERA5 which quantifies and describes its major socio-economic impacts. |
The main access point to ERA5 is the C3S Climate Data Store (CDS), which serves over one hundred thousands of users. However, accessing the CDS requires some minimal technological readiness level to explore and experiment with the data. There was untaped potential for reaching an even wider range of users, who just need to make basic statistics and maps with the data. This is where the ERA Explorer app comes in.
🎯 Interacttive, the ERA Explorer app aims at exploring over 85 years of climate reanalysis data in order to provide a turn-key solution to produce climatological averages and daily, monthly and annual statistics for numerous indicators such as: temperature, precipitation, wind speed and direction, relative humidity…
The ERA Explorer is fully funded by the European Commission as part of the implementation of the operational Copernicus Climate Change Service (C3S) by the European Centre for Medium-Range Weather Forecasts (ECMWF).
Application site(s)
ERA Explorer has a global coverage.
Data
The project is based on ERA5, which is a multidimensional hourly reanalysis dataset providing for each time (from 1940), location (global coverage with a 30km resolution) and altitude (from ground to above 50km altitude) values for a wide range of climate/meteorological parameters.
ERA5 combines model data and observations (from ground-based, ships/buoys, aircraft and satellites) to create a consistent and complete dataset of the Earth’s climate and weather over the past 85 years. This dataset covers a comprehensive range of parameters describing the state of the climate.
-
The ERA5 datasets can be accessed and used from the Climate Data Store. Access via the CDS unlocks many more possibilities of data processing, at the expense of slightly higher technological requirements. A user support team is available to help with any questions relative to the CDS and ERA5.
-
The list of observations assimilated in ERA5 are described in (Hersbach et al., 2020) and also here (ECMWF site).
-
The ERA5 data documentation is here (ECMWF site).
Results - Final product(s)
The ERA Explorer App is available at https://era-explorer.climate.copernicus.eu
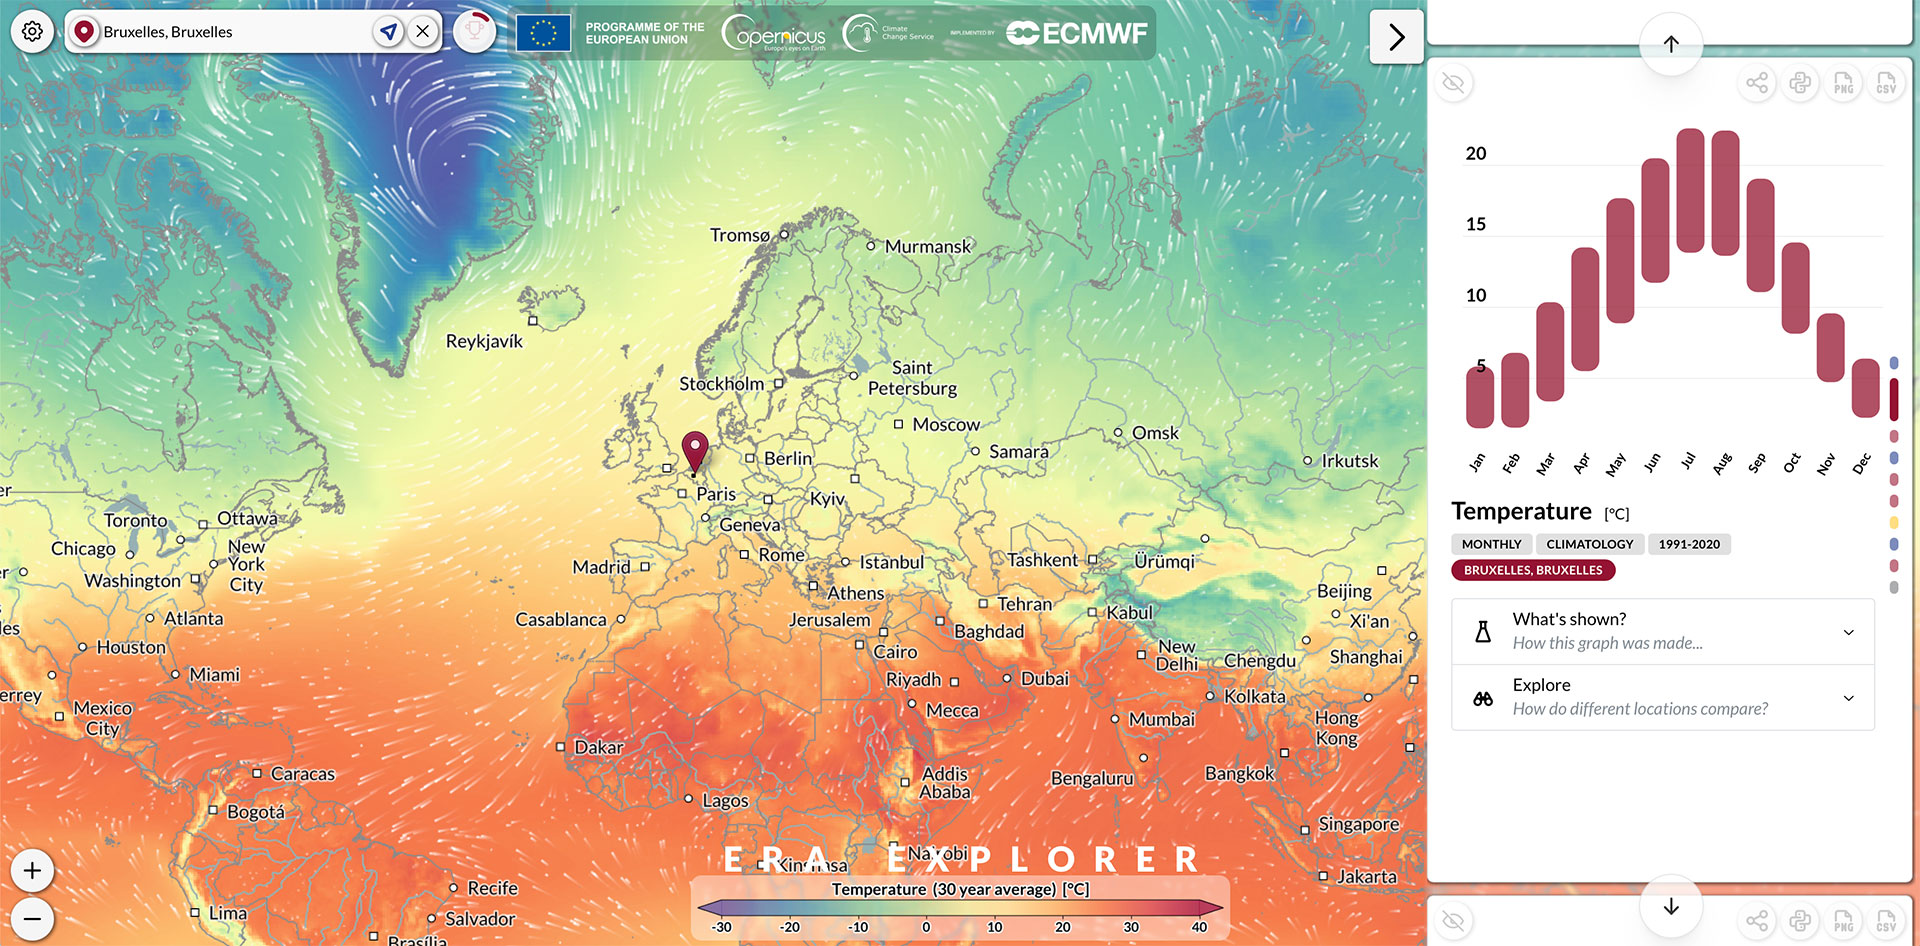
The ERA Explorer app allows you to explore over 85 years of climate reanalysis data in order to provide a turn-key solution to produce climatological averages.
-
Interactive application, it provides easy access to average values of indicators such as: temperature, precipitation, wind speed and direction, relative humidity…
-
Users can visualize and compare climate data all around the world by clicking any point on the application map or using the search bar.
-
The base layer of the map can be set on temperatures or precipitation based on 30-year averages. Thanks to that, users can easily identify the warmest or coldest places on the planet. They also can visualize the tropical rain belt very clearly.
-
ERA Explorer calculates daily, monthly and annual statistics from over 85 years of hourly ERA5 data.
👉To learn more about ERA Explorer: https://climate.copernicus.eu/era-explorer-app-global-climate-data-made-accessible-all
👉To learn more about ERA5: https://climate.copernicus.eu/what-copernicus-climate-change-services-era5-reanalysis-dataset-and-what-can-it-do-you
References
- Hersbach et al., The ERA5 global reanalysis, 2020, Quart. J. Roy. Meteorol. Soc., https://doi.org/10.1002/qj.3803.
- Bell et al., The ERA5 global reanalysis: Preliminary extension to 1950, 2021, Quart. J. Roy. Meteorol. Soc., https://doi.org/10.1002/qj.4174.
- Soci et al., The ERA5 global reanalysis from 1940 to 2022, 2024, Quart. J. Roy. Meteorol. Soc., https://doi.org/10.1002/qj.4803.
Related project(s)
ERA5 and the ERA Explorer App are provided by ECMWF in the context of C3S, the Copernicus Climate Change Service, which is implemented on behalf of the European Commission.
👉Read more about C3S: Buontempo et al., BAMS, 2022
👉Navigate C3S website


