MangMap 2
Operational monitoring of mangroves
Overview
|
◀︎ Produced as part of the Mangroves project, before MangMap 2 was launched, this short video accurately presents the global issues related to mangroves and the MangMap platform in its current version (2025). |
|
Context
Mangrove forests cover between 150,000 and 200,000 km² worldwide. They perform remarkable ecological and environmental functions:
- mitigating the impact of hurricanes, typhoons, cyclones, and tsunamis on coastlines
- protection or mitigation of coastal erosion caused by waves and currents
- providing shelter for a rich biodiversity of fish, crustaceans, birds, insects, etc.
- protection, thanks to their root systems, of the breeding and growth environment of larvae and juveniles of many species
- biological water filtration thanks to the micro-organisms that develop there
- ability to rapidly store large quantities of carbon
- supply of building materials, fuel, food, etc. for the human populations living there
Mangroves are therefore extremely rich and dynamic open ecotones. However, over the last half-century, their total area has decreased by 30 to 50%.
Towards comprehensive monitoring of mangroves
💡 Named MangMap 2, this project takes its name from the tool developed by the Mangroves project, which was awarded SCO certification in 2021 for building operational satellite monitoring of mangroves. Led by IRD UMR Espace-dev, in collaboration with the University of Montpellier, Scop La Telescop and CNES, this first phase of development was based on simple and robust exploitation of Sentinel-2 time series data from the Copernicus program.
|
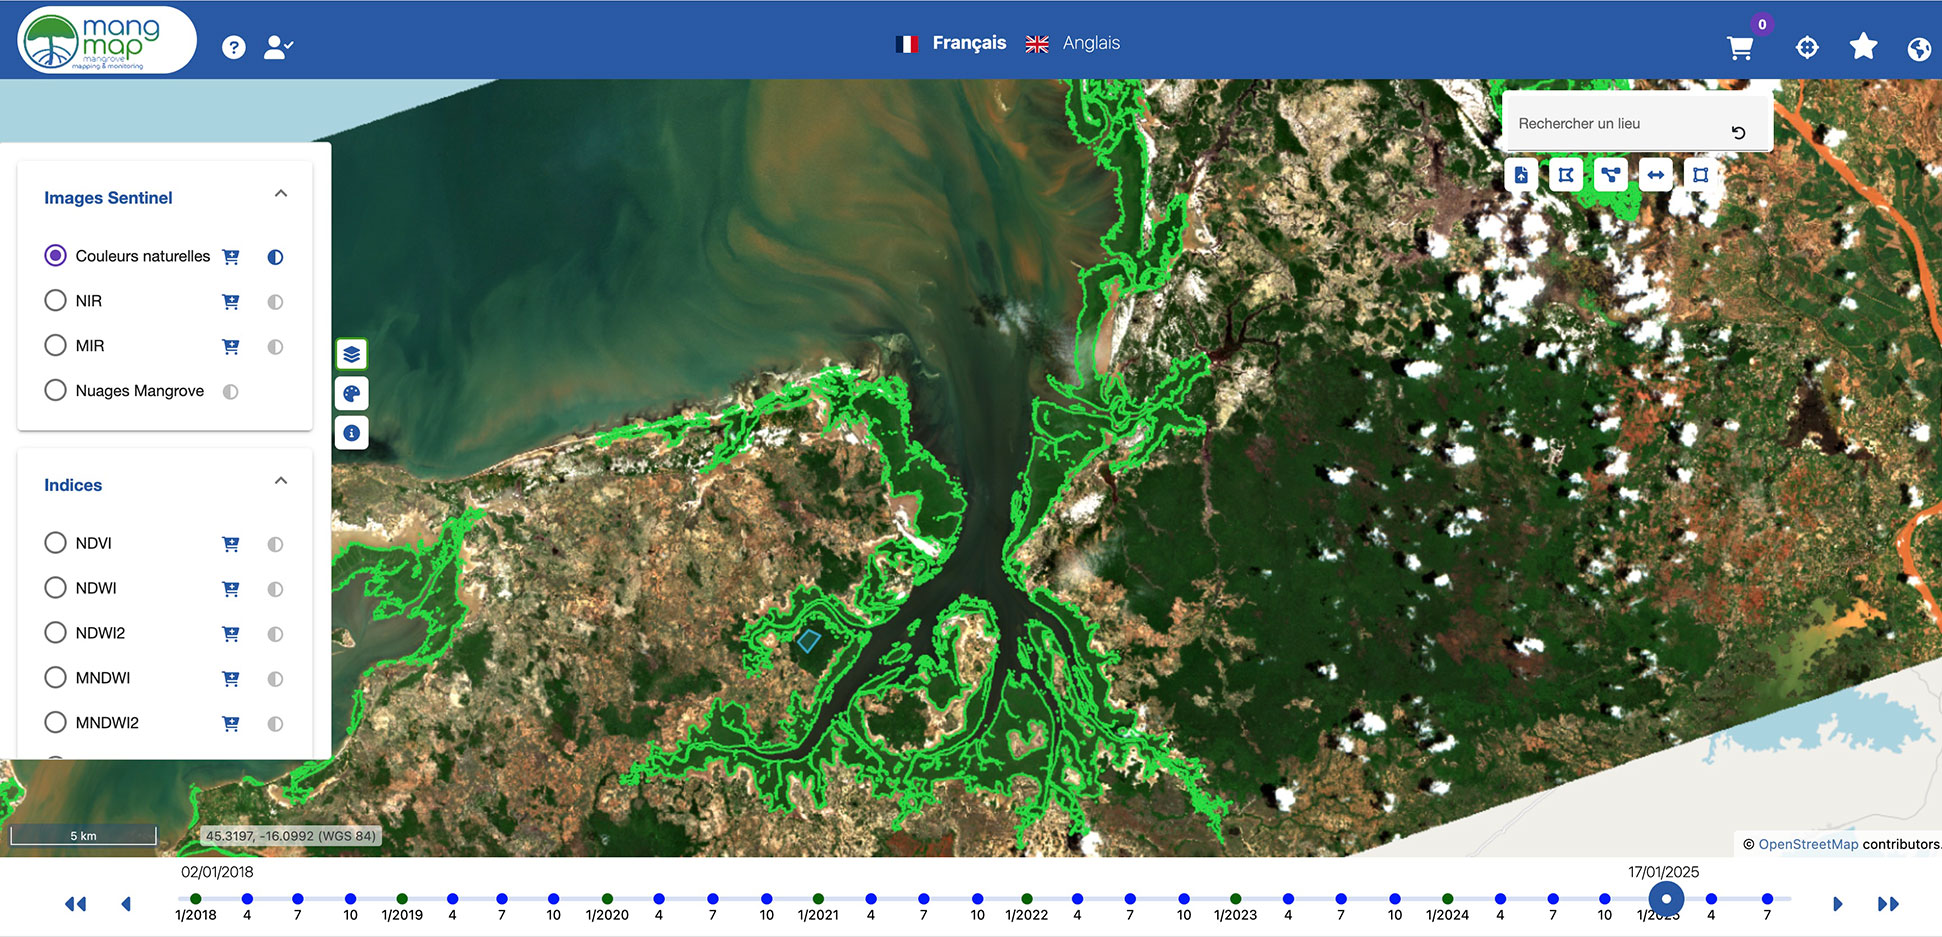
Today, MangMap is an interactive portal focused on mangrove areas, dedicated to the consultation, manipulation, and sharing of imagery and radiometric indices extracted from it. It offers online and on-demand services that allow users to generate information on the state of mangroves by applying simple calculations to indices or syntheses of radiometric indices of their choice, in areas of interest and time periods that they specify. More than just a visualization platform, MangMap is an application suite that combines recurring processing of Sentinel-2 time series imagery with online, on-demand calculations that allow users to manipulate the products of the recurring calculations. All data, products, and calculation results produced by MangMap can be downloaded by the user: raster image files, vector files, spreadsheet files, graphs, and PDF printouts. |
Reminder of MangMap's current features Recurring processing:
On-demand online services based on the manipulation of these products for:
1 Polygon and transect: drawn on screen or downloaded |
Based on the features already operational on the platform, MangMap 2 has four objectives:
- Extend the use of the services offered by the platform to new geographical regions: extension of current sites to all the mangroves they contain, and integration of new sites. The integration plan will be gradual, with news updates informing the community of each new extension of the geographical scope. If the workload allows, other sites will be added. Similarly, it is possible that the planned sites may be replaced by others, depending on the partnerships that are established at the local level.
- Bring together the community of current and future users within a "MangMap network" through the implementation of a comprehensive program to support the use of the platform.
- Continue to develop new services useful for the study and management of mangroves.
- Improve the user experience (ergonomics).
Application site(s)
-
Monitoring of the entire mangrove coastline: Antilles (Martinique, Guadeloupe), French Guiana, Madagascar, Cambodia, Gabon, Suriname
-
Monitoring of pilot sites: Brazil (in the states of Amapa and Para), Benin, Vietnam
-
Optional sites: Kenya, Indonesia, India
Data
Satellite
Sentinel-2
Results – Final product(s)
Improvement of the MangMap portal with:
- At least 16 sites covered, compared to 5 today (2025)
- Animation of the "MangMap network" to support the user community with:
- Tutorials (video and PDF) and regular informational webinars to facilitate use of the platform.
- Training activities: regular webinars, on-site sessions, distance learning module integrated into the MangMap website.
-
New services, including, as a priority, a warning and monitoring system for mangrove deforestation or degradation.
-
Improved user experience (ergonomics).


