

SATLAND
 and its surroundings (left).")
SAtellite Time series analysis for large scale LANd acquisition Detection
Overview
Large scale land acquisitions: what is the big deal?
Since the late 2000s, the global increase in demand for resources (food, energy, minerals, etc.) has led to an intensification of large-scale land acquisitions (LSLAs), often referred to as land grabs. These acquisitions are mainly for agricultural use (agroindustries, for food or biofuel production), but also concern mining, tourism or urban development. For a variety of reasons (availability of vast arable land, lack of protection of land rights, etc.), this phenomenon particularly affects Southern countries, and Africa in particular. These LSLAs are not without consequences from an environmental (deforestation, soil degradation) or socio-economic (food insecurity, land conflicts) point of view, and need to be detected and monitored, both in space and time.
To improve transparency on this topic, the Land Matrix initiative has been recording these transactions since 2009 from a variety of sources. However, census data is often incomplete, sensitive or difficult to confirm.
SATLAND, a dedicated application
The SATLAND online application illustrates an example of a research trajectory (Land Matrix funding, APR CNES, ED GAIA thesis grant) leading to a dedicated and operational tool, responding here to the need for observation of these large-scale land transactions.
This application is designed to detect, highlight and map seasonal changes in a given area and period of interest, traducing specific land use transitions such as the implementation of Large Scale Land Acquisitions (LSLAs).
It is based on the processing of satellite image time series of normalized difference vegetation index (NDVI) acquired using MODIS sensor, and available for free since 2000 at a spatial resolution of 250m and a frequency of 16 days (product name: MOD13Q1). The times series are first downloaded, smoothed using weighted Savitsky-Golay algorithm and then processed using BFASTm-L2 algorithm to identify and select breakpoints sensitive to changes in time series seasonality (ie. in the amplitude, length of season or number of seasons) (see Ngadi et al., 2023). In addition to the change date, metrics aiming at highlighting seasonal changes are extracted and mapped: the magnitude of change (sensitive to amplitude and number of seasons), the before/after NDVI ratio (giving the direction of change), and the dissimilarity (Procrustes distance sensitive to number and length of season). Combined in a unique RGB composite map, those three metrics allow for inferring main drivers of land use and land cover change in the area of interest (see Ngadi et al., 2024).
Once generated, five maps will be available:
- Date of change,
- Magnitude of change,
- NDVI ratio before/after change,
- Dissimilarity (Procrustes distance),
- RGB map combining the three previous metrics to highlight changes and their main drivers.
These maps can be visualized, and the NDVI time series (raw and smoothed) for each pixel can be displayed, along with the detected breakpoints and their corresponding magnitudes (Euclidean distance, referred to as L2). All outputs are also available for download by the user.
Application site(s)
Developed and tested in Senegal (Africa), the SATLAND tool can be used at any site of interest.
Data
Satellite
- MODIS (MOD13Q1)
- ESA WORLDCOVER
Results – Final product(s)
SATLAND will provide to the Land Matrix and more widely to the land change community an online application able to run at the national level to detect and characterize hotspots of change.
The application will allow an online visualization and the download of all the final products generated:
-
raw and smoothed NDVI time series (allowing the user to visualize the time series smoothing result for a given pixel, along with the selected breakpoint giving the date of change),
-
date of change map (allowing a monitoring of LSLA implementation, which is generally done gradually, and to compare this % of implementation to the whole transaction surface of the deal),
-
magnitude and weighted magnitude maps (highlighting changes in amplitude and number of seasons, which are typical of agricultural LSLAs),
-
dissimilarity map (focusing on changes in the length of season and number of seasons, also typical of agricultural LSLAs),
-
NDVI ratio map (giving the direction of change that differs depending on the climatic application environment),
-
RGB map (with its association table giving the drivers of change - including LSLAs).
Combined together, all these products will enable the end users to collect or update information on LSLAs and other types of change (climatic, natural, infrastructures/mines) in their territories.
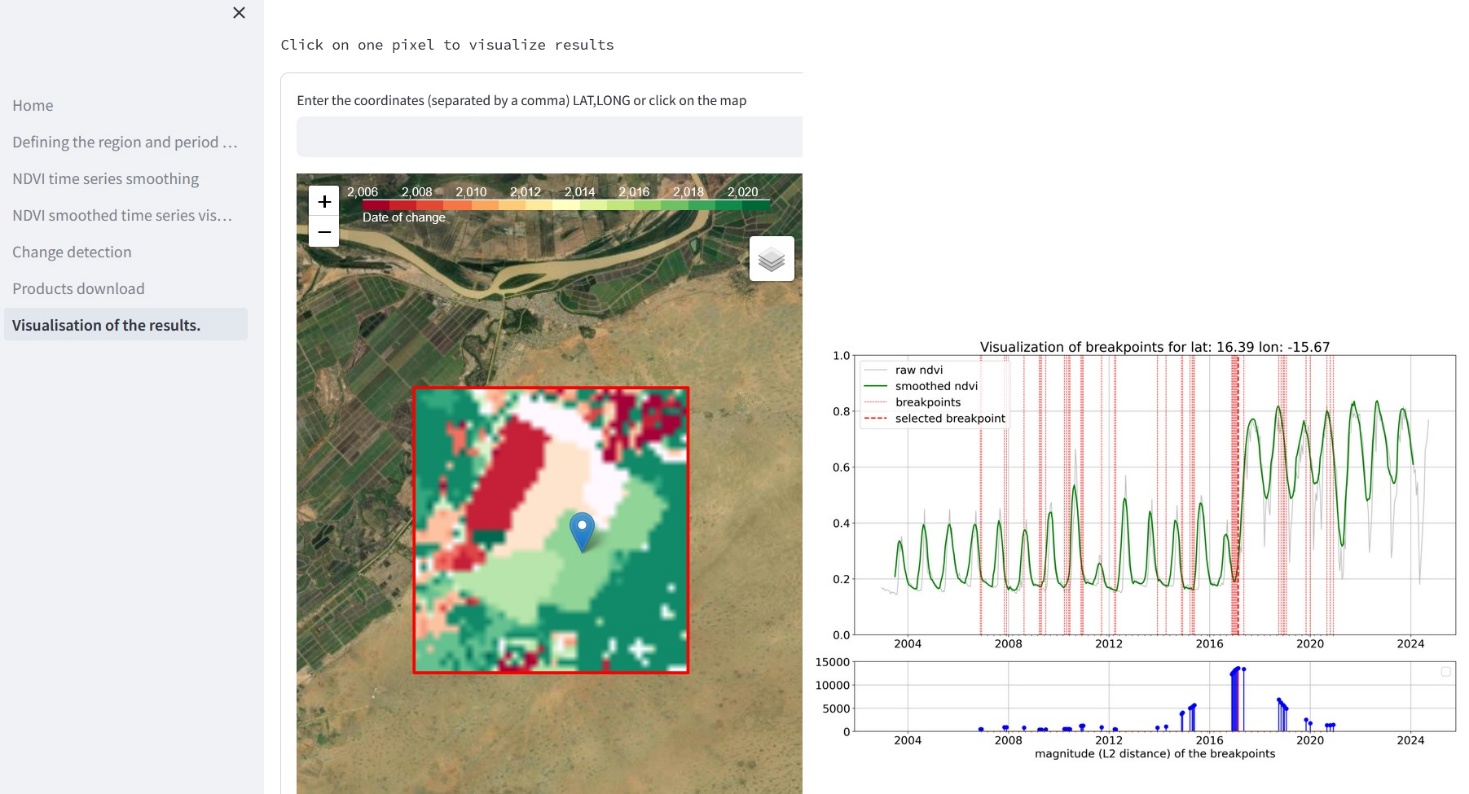
Illustration of the « visualization of the results » page allowing to display the different maps (here, the date of change map) and the NDVI time series of each pixel (raw, smoothed) along with the breakpoints detetected and their corresponding magnitudes (euclidean distance, referred to as L2). © Cirad
References
-
Ngadi Scarpetta, Y., Lebourgeois, V., Dieye, M., Laques, A.-E., Begue, A., 2024. Insight into large-scale LULC changes and their drivers through breakpoint characterization – An application to Senegal. International Journal of Applied Earth Observation and Geoinformation 132, 104066. https://doi.org/10.1016/j.jag.2024.104066
-
Ngadi Scarpetta, Y., Lebourgeois, V., Laques, A.-E., Dieye, M., Bourgoin, J., Bégué, A., 2023. BFASTm-L2, an unsupervised LULCC detection based on seasonal change detection – An application to large-scale land acquisitions in Senegal. International Journal of Applied Earth Observation and Geoinformation 121, 103379. https://doi.org/10.1016/j.jag.2023.103379
-
Ngadi Scarpetta, Y., 2024. From land cover to land use systems mapping: Detection and characterization of large scale agricultural investments (LsAIs) from satellite imagery. Application to Senegal. Montpellier : Université de Montpellier, 198 p. Thèse de doctorat : Géomatique : Université de Montpellier. View the thesis
Related project(s)
- Land Matrix Initiative
- VISAGE / VISAGE#2 (APR CNES)