

SCOFrance
PartnersGSMA/Université de Reims, CapGemini, CNES
Useful linksAEROLAB SPACE project
AEROLAB website
Key wordsGHG, carbon footprint, emissions inventory, modeling
AEROLAB SPACE shows GHG emissions for the Grand Est region
Already used in the Grand Est region to monitor greenhouse gas emissions in real time, the AEROLAB SPACE method is a first in France. Using spatial data, it complements the work of the AEROLAB research and innovation cluster supported by the University of Reims.
|
A genuine environmental and political decision-making tool, the project provides spatial monitoring of sources of GHG emissions and generates an indicator of confidence and traceability of emissions thanks to a major synergy of data:
This real-time monitoring is all the more important given that official emissions inventories are only published every two years or so. |
Inventories and uncertainties |
Working with CapGemini to design the digital platform that will report indicators and dynamic, up-to-date maps of GHG emissions in the Grand Est region, the team is currently focusing on the city of Reims. The city has a wealth of in situ data, which is needed to correlate the satellite data and 'calibrate' the models. Having carried out numerous comparisons of the different types of data, the project team has in particular carried out measurements by airplane over the Chalon industrial site to quantify the emission plume and compare it with the results of its model enhanced with meteorological data. It also analyzed the differences between daytime and night-time emissions at forestry and agricultural sites to identify anthropogenic emissions.
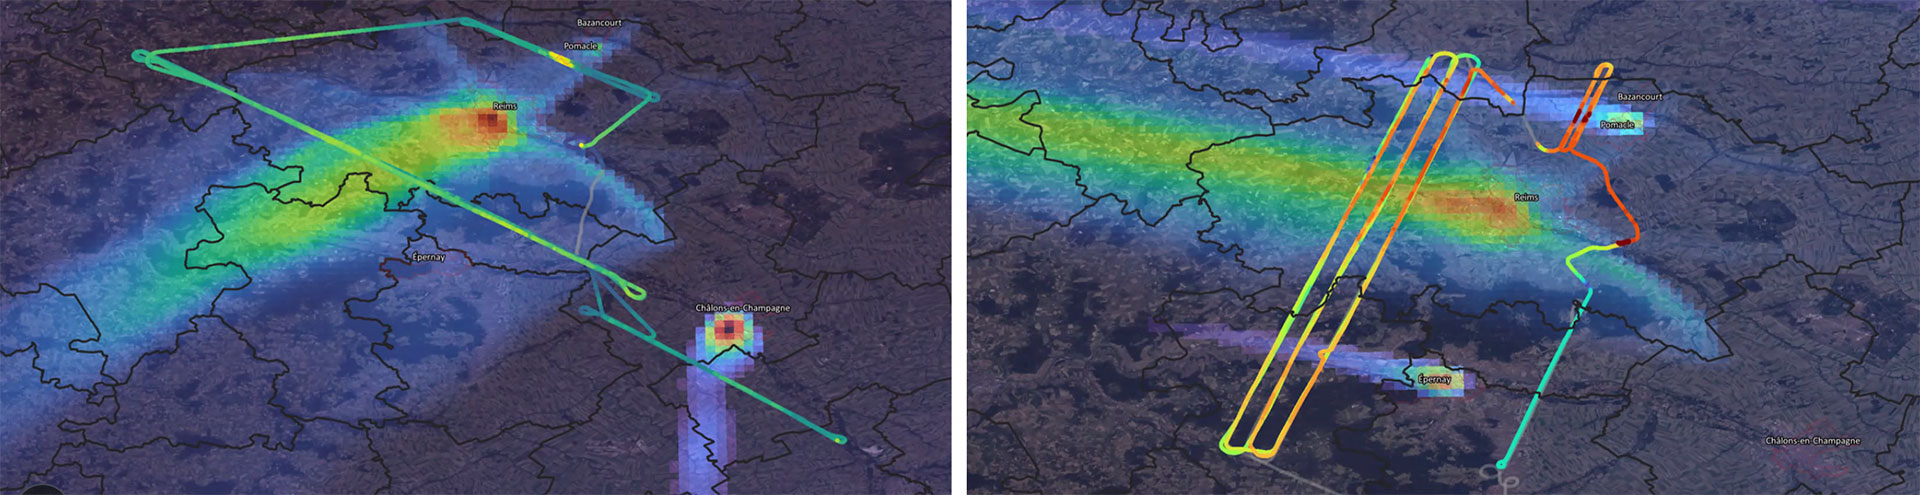
Aerial measurements showing the plume of greenhouse gas emissions over the Chalon industrial site. © AEROLAB
While the next few months will be devoted to producing improved emissions maps, the team plans to deliver an operational tool in January 2025.
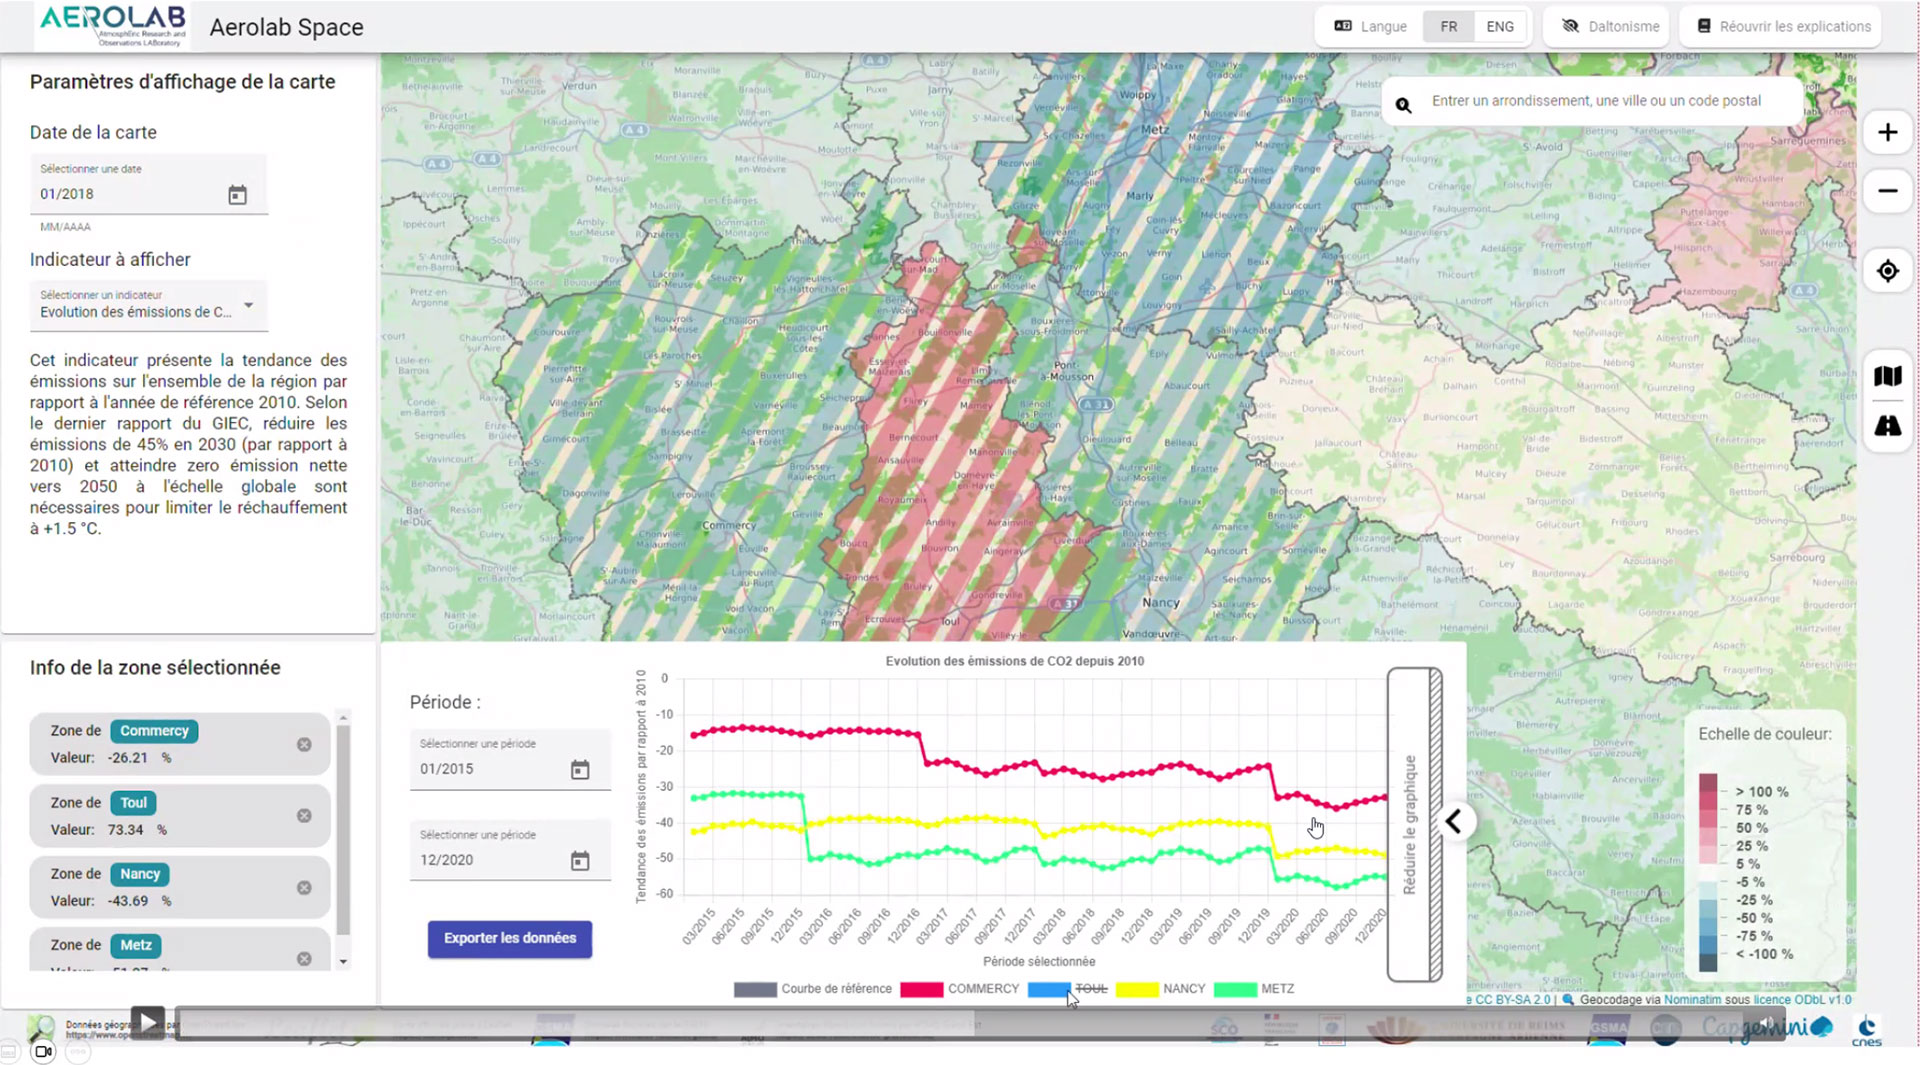
First version of the AEROLAB SPACE platform with changes in CO2 emissions since 2010. © CapGemini