

CARTOVEGE 2
 on the left, and Saint-Paul Island (Pleiades Neo – 28 November 2024) on the right.")
CARTOgraphy by remote sensing for the management and restoration of polar ecosystems: maps of plant formations and inference of the effects of global change on the occurrence of plant species
Project CompletedImplemented on Possession Island (Crozet Archipelago) and adapted and expanded to St. Paul and Amsterdam Islands in this second phase, Cartovege has developed:
- a rigorous method for defining and classifying habitats specific to the Austral Lands,
- and a workflow for processing field data and multi-source imagery, capable of automatically generating a very high-resolution habitat map—including for unvisited areas—based on satellite imagery.
Each phase resulted in the creation of a habitat guide specific to these territories, freely available through Quae Publishing.
Overview
Context
The French Southern Territories, an integral part of a national nature reserve created in 2006 and listed as a UNESCO World Heritage Site since 2019, face significant challenges in terms of biodiversity conservation (the world’s highest density of birds, numerous endemic species, etc.).
They comprise the Crozet and Kerguelen archipelagos and the islands of St Paul and Amsterdam, whose natural heritage is threatened by the introduction of exotic species, as well as by the effects of climate change, which are leading to a redistribution of species and changes to natural habitats, with repercussions for the associated communities and ecosystem services. In this context, having tools to monitor the spatial and temporal changes in vegetation on a large scale is a major challenge for the conservation and management of these isolated ecosystems.
An initial project accredited with SCO in 2021, entitled CARTOVEGE1 , and implemented on Possession Island (Crozet Archipelago) with the support of the French Polar Institute (project 136-SUBANTECO), has made it possible to:
Define the diversity of habitats in the Crozet Archipelago using a typology adapted to polar tundra vegetation;
Propose an automated processing pipeline for very high-resolution multi-source imagery to map the natural terrestrial habitats of these regions using supervised classification (machine learning).
The initial results have confirmed the decisive contributions of very high-resolution (50 cm) satellite remote sensing and artificial intelligence to the mapping of natural habitats and the monitoring of biodiversity in a sub-Antarctic context.
Nevertheless, although the three archipelagos of the French Southern Territories share common characteristics (e.g. peatland environments found on Crozet and Amsterdam), St Paul and Amsterdam Islands, situated at lower latitudes, exhibit certain vegetation patterns typical of subtropical zones (tall, dense vegetation, including a shrub and tree layer) (Figure 1) which necessitate typological (identification of new habitat types) and cartographic adjustments (e.g. integration of additional explanatory variables, such as texture, into supervised classification).
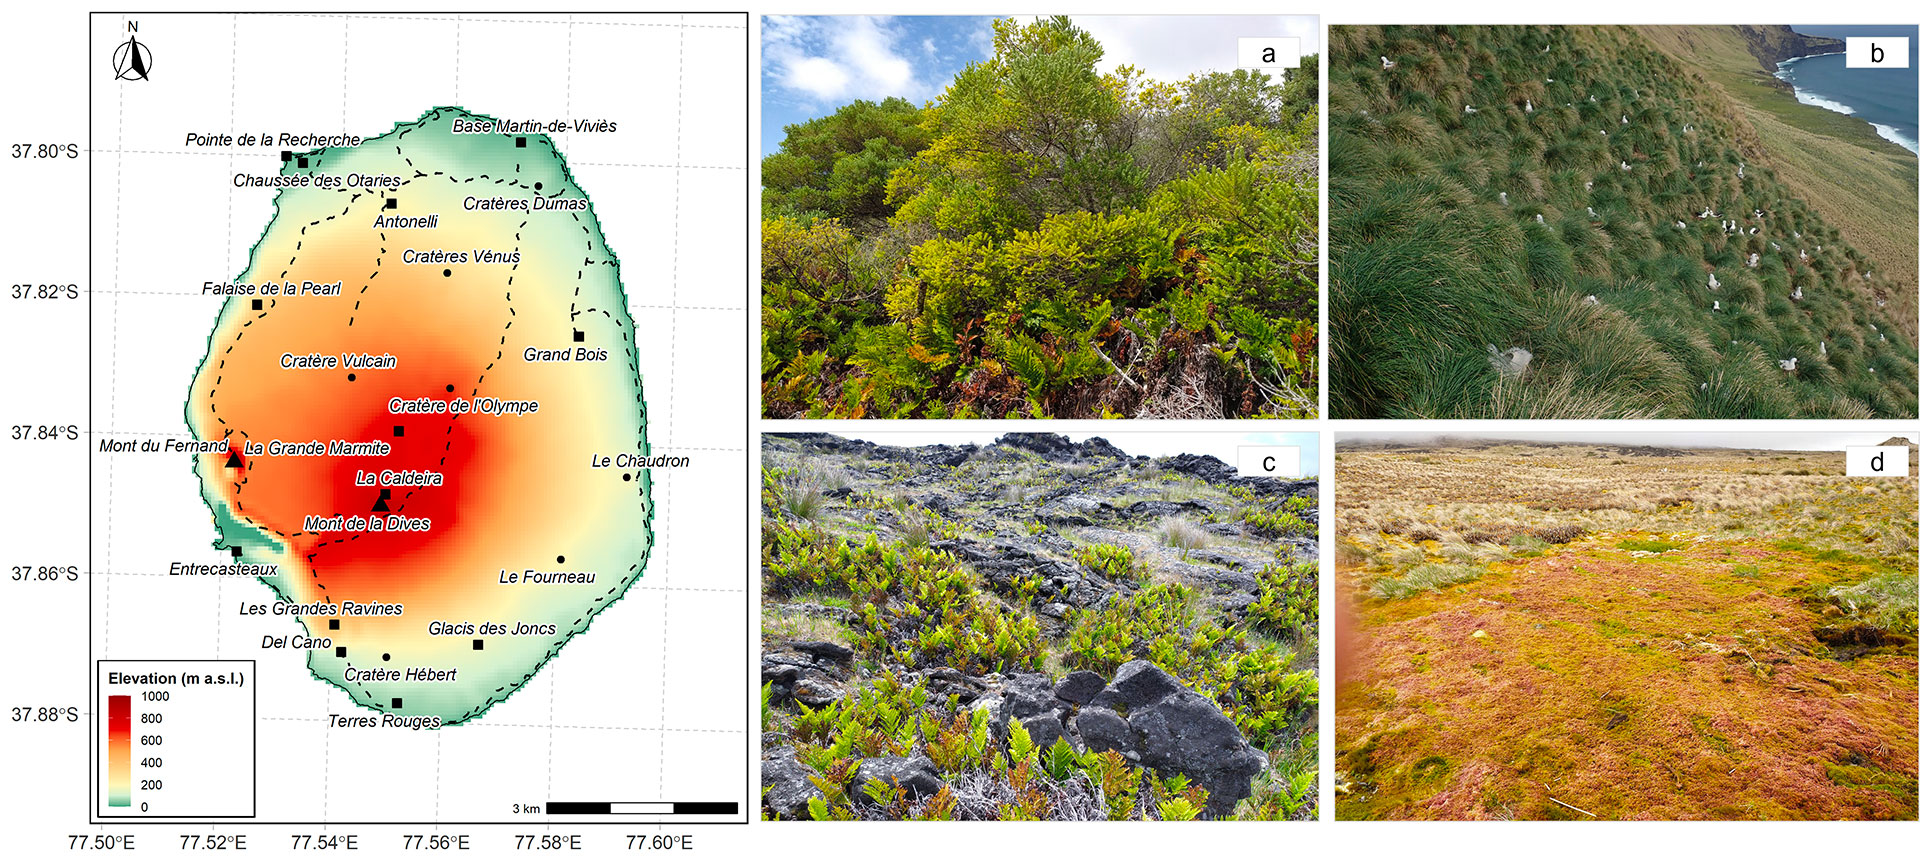
▲ Figure 1: Topographic map of Amsterdam Island (French Southern Territories) and photographs of its typical vegetation formations: a – Phylica arborea thicket, a wet filicophyte facies; b – Coastal grassland enriched with Poa novarae in tussocks; c – Mineral formation with Rumohra adiantiformis; d – Sphagnum spp. bog, Sphagnum violascens facies (the black triangles indicate the main mountain peaks, the black circles the main craters, whilst the dotted lines represent transit routes. © D. Espel, 2024
Objectives of the CARTOVEGE² project
In this new project, the work established in CARTOVEGE1 has been extended to the islands of St Paul and Amsterdam in order to improve the potential for applying the typological method and the habitat mapping tool to other territories and to explore its possibilities.
Particular attention has been paid to the accessibility and use of these tools by managers (e.g. the TAAF administration, national botanical conservatories, and nature and coastal area conservatories).
The CARTOVEGE² project therefore achieved the following objectives:
- To apply the typological classification method to Amsterdam Island to generate the first typology of the island’s natural habitats;
- Optimize the Cartovege processing chain so as to (i) further automate the processing steps in order to reduce the need for expertise and (ii) facilitate its use in a context of limited computing resources and/or use by non-experts;
- Apply the processing workflow to define the best habitat modelling method and produce the first very high-resolution habitat maps of St Paul and Amsterdam Islands.
Methodology
The project is based on the integration of field ecological data (floristic and environmental), drone imagery acquired with a DJI Mavic 3M, and multi-source satellite imagery (Pleiades, Pleiades Neo and WorldDEM Neo).
Typological classification
The typology of natural habitats on Amsterdam Island was developed from over 1,100 phytosociological surveys, using the methodology developed as part of the Cartovege1 project. The approach was based on a hierarchical classification of the surveys, founded on floristic, physiognomic and environmental criteria, and subsequently validated using field photographs.
The data used were drawn both from historical surveys extracted from the ‘Habitats, Fauna, Flora’ (HIF) database and from a field survey carried out during the 2024–2025 Antarctic summer. This work was carried out in collaboration with the French Polar Institute and the Directorate for the Environment of the French Southern Territories, with the aim of supplementing and updating knowledge of the island’s vegetation.
Processing chain
The Cartovege processing pipeline is based on various modules written in the R programming language. Most of the scripts run sequentially, whilst some are optional and can be skipped by the user if desired.
Improvements to the pipeline have involved:
- Developing various modules to:
- Automatically generate a large amount of additional and artificial training data using segmented and photo-interpreted drone imagery, validated against ground truth. This increases the training dataset and optimizes the sampling effort.
Integrating the calculation of texture indices based on a GLCM matrix: extraction of spatial metrics to better characterize intra-pixel heterogeneity and habitat structure.
Generate an automated and statistically robust remote-sensing typology, without the need for floristic expertise: construction and adaptation of the nomenclature based on available data and their spectral separability.
Automatically select the best predictor variables for habitat classes: identify the variables that contribute most to classification in order to limit redundancy and improve model robustness.
Develop hierarchical classification models (i.e. integrating the hierarchical structure of the typology into the predictive variables) and compare their performance with linear (‘flat’) classification models. Through this, the broad habitat categories guide the recognition of finer-grained classes.
Facilitate the temporal monitoring of habitats based on an automatic search of available optical imagery and the calculation of habitat changes over time.
Generate a Shiny interface to visualize modelling results (statistics, landscape metrics and habitat maps).
Optimize computation times and enable habitat mapping by limiting access to computing servers, notably through tile-based prediction followed by mosaicking.
👉 The pipeline can now run on a standard laptop with 32 GB of RAM (using 9 tiles for a 54 km² island). Performance and memory footprint depend on the number of tiles defined by the user, allowing the processing to be adapted to different hardware capabilities and operational constraints.
💡 See the results of these improvements
► Figure 2. Schematic representation of the field data and imagery processing chain developed as part of the CARTOVEGE1 project and improved as part of the CARTOVEGE² project. | 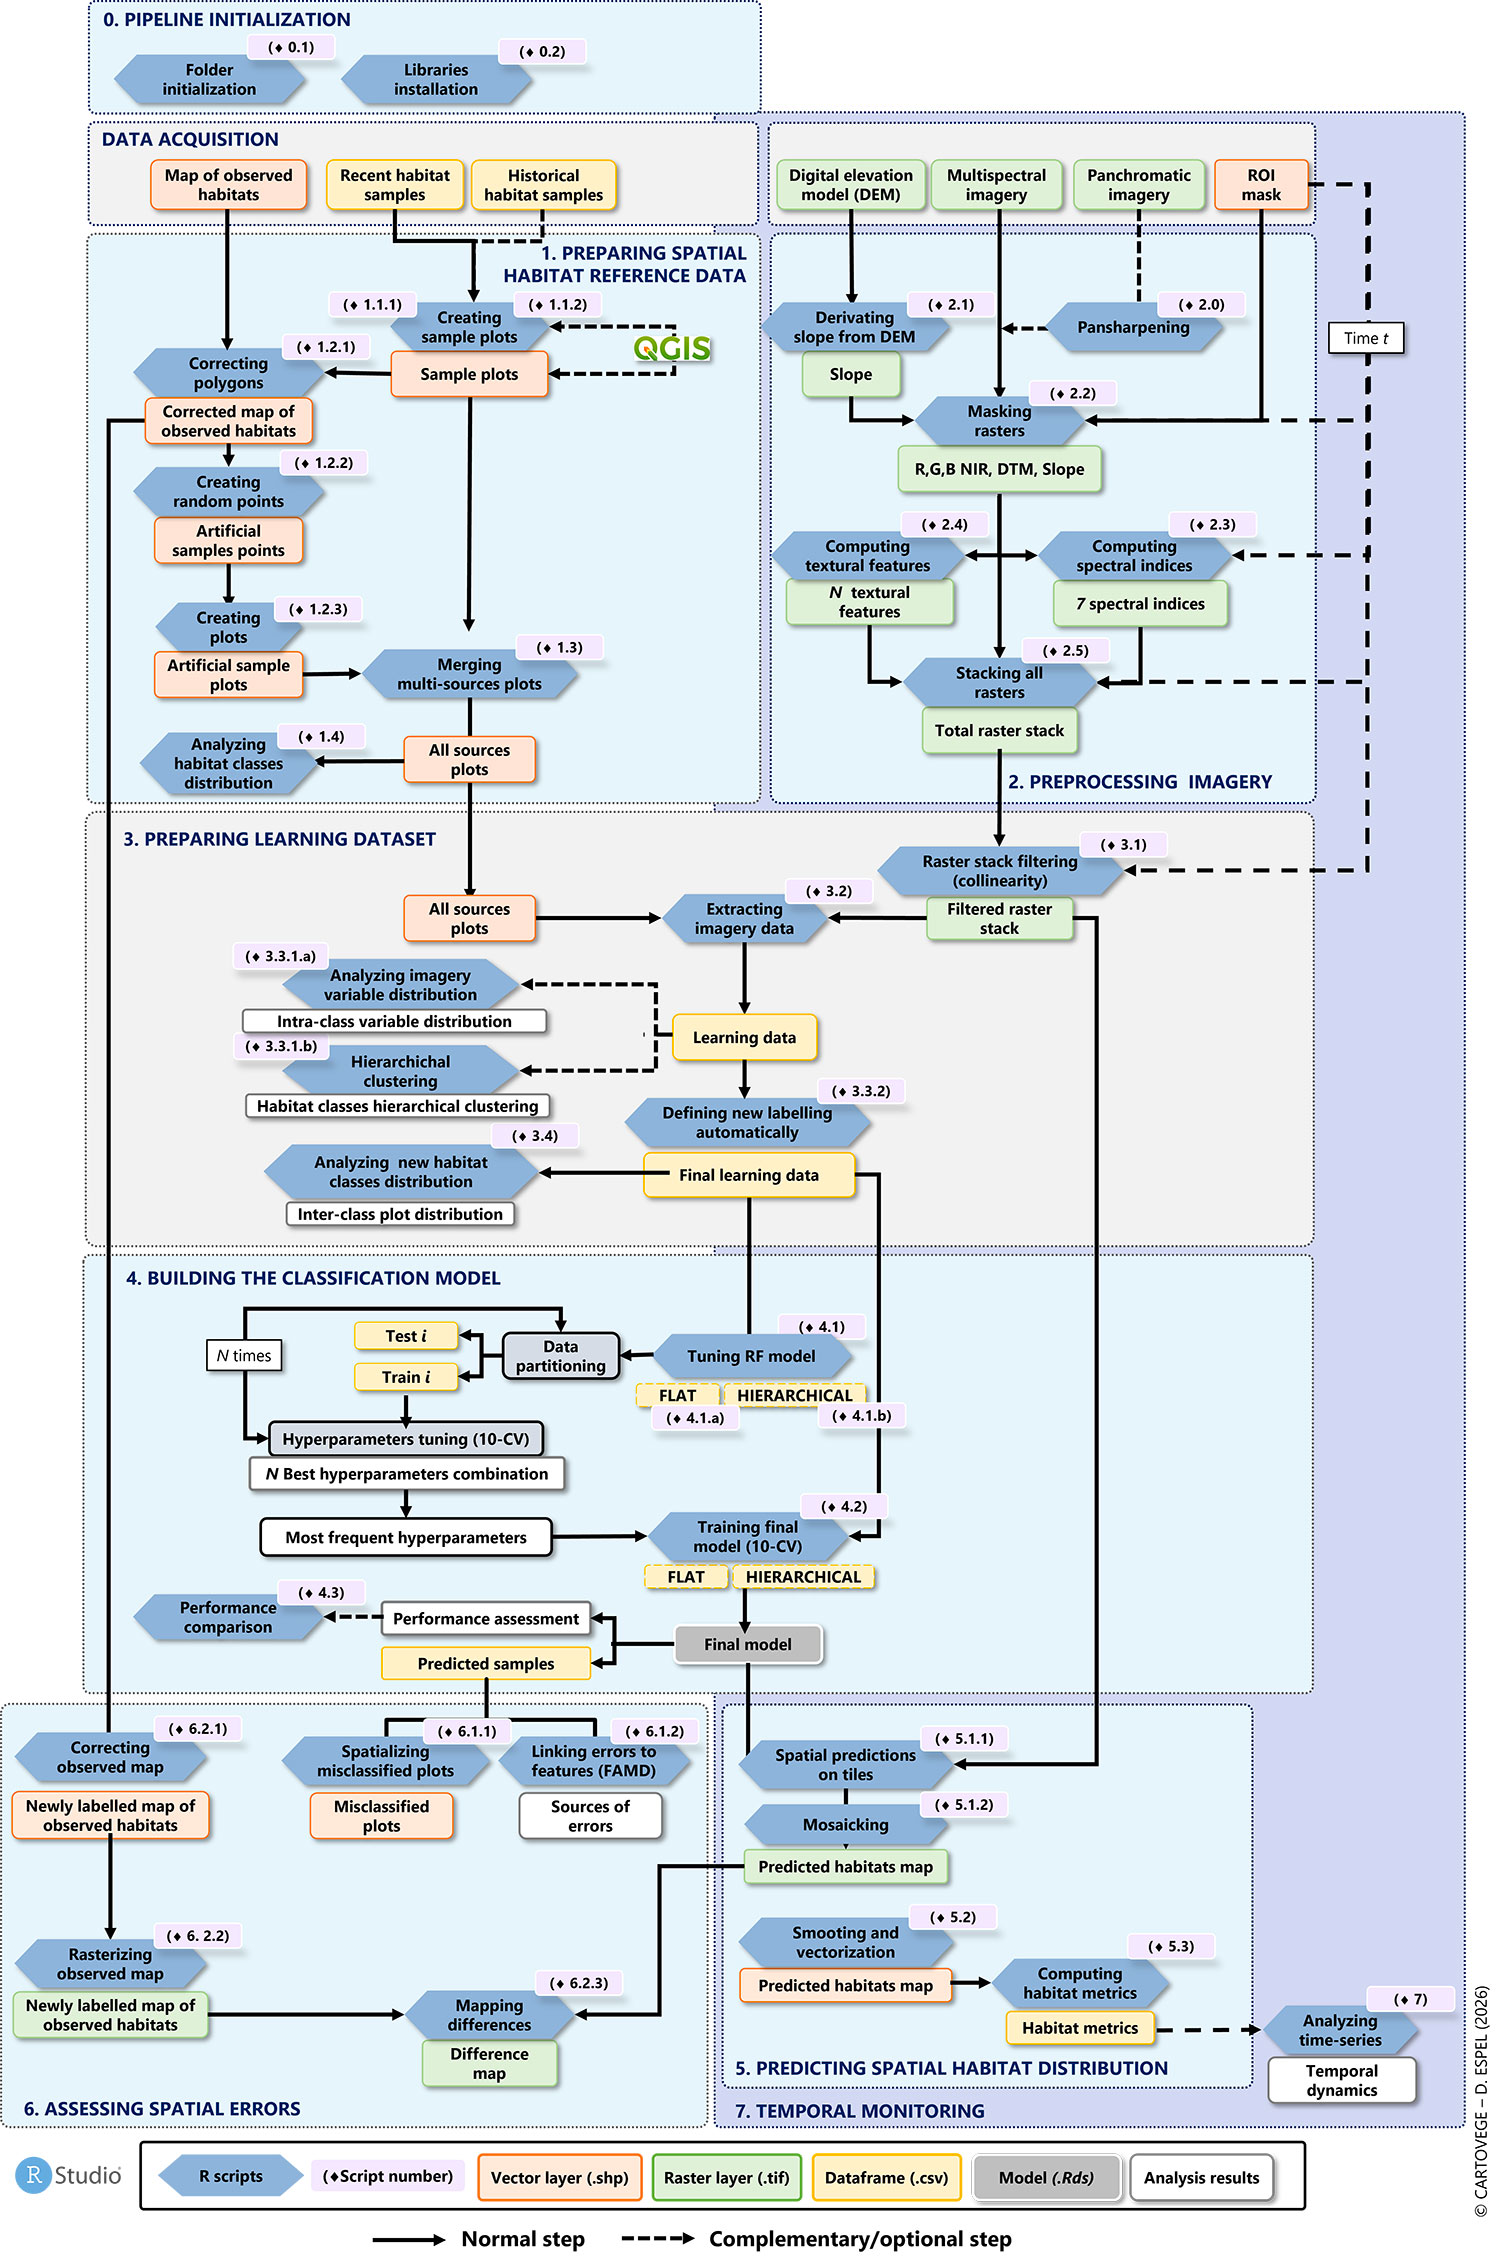 |
Modelling and cartographic outputs
Using the processing pipeline, several modelling approaches were developed and compared to assess their ability to predict the natural habitats of Amsterdam and Saint-Paul Islands using very high-resolution remote sensing data.
The work focused in particular on:
comparing the performance of hierarchical classification models with that of linear classification models;
assessing the contribution of artificial training data generated from drone imagery to optimize field sampling efforts;
analyzing the influence of the spatial resolution of the training data (50 cm, 1 m and 2 m) on habitat mapping performance;
assessing the models’ ability to predict all classes of the Amsterdam Island habitat typology.
Following this work, based on the most effective modelling method, several cartographic outputs were produced for St Paul and Amsterdam Islands:
very high-resolution reference maps of natural habitats;
temporal monitoring maps enabling the analysis of vegetation changes;
comparative maps produced before and after the fire on Amsterdam Island in January 2025, in order to assess its impact on natural habitats.
Application site(s)
French Southern Territories:
- Amsterdam Island, St Paul-Amsterdam District
- St Paul Island, St Paul-Amsterdam District
Data and tools
Satellite
- High spatial resolution optical imagery (multispectral – 4 bands): Pleiades, Pleiades Neo (Mono/Tri-Stereo)
- Digital elevation model: SRTM, World DEM Neo
- Infrastructure: Dinamis (Data Terra) and Copernicus, USGS (NASA)
Drone
Multispectral aerial imagery (4 bands): DJI MAVIC 3M
Land
Historical data (2015–2024) from the Habitats-Flora-Invertebrates database co-managed by the RNN TAF and the SUBANTECO IPEV/136 project: this database compiles spatially and temporally georeferenced data on the flora and invertebrates of St Paul and Amsterdam Islands, and associated environmental conditions (substrate type, slope, altitude, soil moisture, etc.).
Data from the 2024 summer campaign: additional floristic data to (i) refine and validate the typology on Amsterdam; (ii) train and validate the Amsterdam habitat classification model
Other
Topographic data: coastline (Shom)
- High-resolution climate time series (French Polar Institute Project 136-SUBANTECO, Météo-France)
Literature
Ecological knowledge: biological invasions, auto ecology and synecology of native and non-native species, phytosociology;
Knowledge of spatial modelling and remote sensing;
Expertise in statistical analysis: ascending hierarchical classification, clustering, etc.;
Habitat guides for the Crozet (Espel et al., 2024) and Kerguelen (Fourcy, 2023) archipelagos;
Atlas of the flora of the French Southern Territories (Agnola et al., 2026);
Bibliographic review of the habitats of sub-Antarctic islands
Literature on the flora of Amsterdam Island
Tools
Programming languages
Processing pipeline: R
High-performance computing cluster: Bash
Database manager: PostgreSQL
Statistical tools
Satellite imagery processing pipeline developed as part of the SCO CARTOVEGE1 project
Automatic segmentation (eCognition)
Pixel-based classification models: machine learning (Random Forest, etc.)
Classification methods using multivariate analysis and clustering
Mapping/photogrammetry visualization tools
Geographic Information System software: QGIS
Drone image stitching software (photogrammetry): Agisoft Metashape
Map hosting tool on CarHab (MNHM, French National Museum of Natural History)
Final products
- Digitization of georeferenced data on the distribution of flora (plant species and vegetation formations) on Amsterdam Island, and of satellite imagery used to create habitat maps;
- Production of the first typology of vegetation formations on Amsterdam Island (ecological typology)
First description of the habitat of the endemic species, the Amsterdam Albatross, classified as Critically Endangered by the IUCN and covered by a national action plan.
Development of a correspondence table between the habitats of Amsterdam Island and those of St Paul Island.
Integration (forthcoming) of information on habitat types into the national HABREF database and of the maps produced into the CarHab web platform.
- Development of an automated processing pipeline for multi-source imagery and field data for remote sensing of habitats (optimization of the Cartovege remote sensing pipeline)
- Habitat maps:
Comparative maps of predicted habitats on Amsterdam Island and St Paul Island.
Comparative maps of predicted habitats on Amsterdam Island before and after the fire
Temporal habitat maps of the Amsterdam Islands based on modelling of vegetation formations using available data (field data and explanatory variables).
- Production of field monitoring tools: form for automatic in situ habitat recording
3 publications (currently being drafted)
- "The Guide to Terrestrial Habitats of Amsterdam Island" published by Quae (vegetation classification reference): identification key and summary sheets.
- “Cartovege, an end-to-end remote sensing pipeline with R for very high-resolution habitat mapping in isolated environments”: submission planned for Computers and Geosciences, to explain the entire Cartovege processing chain (pipeline + case study on the Crozet Archipelago);
- “Pathways to Automated and Smarter Monitoring: Advanced Strategies for High-Resolution Habitat Mapping in Sub-Antarctic Islands—Lessons from Amsterdam Island, French Southern Territories”: submission planned for Remote Sensing in Ecology and Conservation, to propose recommendations on remote sensing and habitat monitoring in sub-Antarctic and subtropical environments (case study on Amsterdam Island).
Dissemination:
All data and metadata underpinning the project and the resulting publications will be published with a digital identifier (DOI) via the Dryad repository in accordance with FAIR principles, and under the ‘Creative Commons Zero, CC0 1.0’ license.
Methods developed through programming will be stored in .m, .r or .txt format and made publicly available (GitHub). The processing chain is freely available here.
Scientific publications will be deposited on open platforms (bioRxiv, Zenodo, HAL).
Main results
Habitat classification
The first comprehensive typology of Amsterdam Island’s habitats has been developed, now serving as a reference ecological description for the monitoring, management and conservation of the island.
This typology highlights the ecological richness and uniqueness of Amsterdam Island, with 45 plant formations and non-vegetated habitats identified, grouped into 13 major habitat types and 5 major ecological complexes. Of these formations, 36 correspond to native habitats (78%) and 9 to exotic habitats (22%).
The results also highlight the significant heritage value of these habitats: nearly half of the native habitats are home to at least one heritage or endemic species, 28% serve as breeding sites for local wildlife, and 72% act as resting places or living areas for animal species.
The typology also made it possible to describe, for the first time, the habitats favorable to the Amsterdam Albatross, an endemic species classified as ‘critically endangered’ (IUCN). The results highlight a strong association between nesting sites and the Elaphoglossum succisifolium wet facies of peatlands with Dicranoloma subconfine and/or Racomitrium lanuginosum (Figure 3), and less frequently, with their Austroblechnum penna-marina facies. Nests are often built in areas sheltered from the wind, particularly near clumps of Ficinia nodosa.
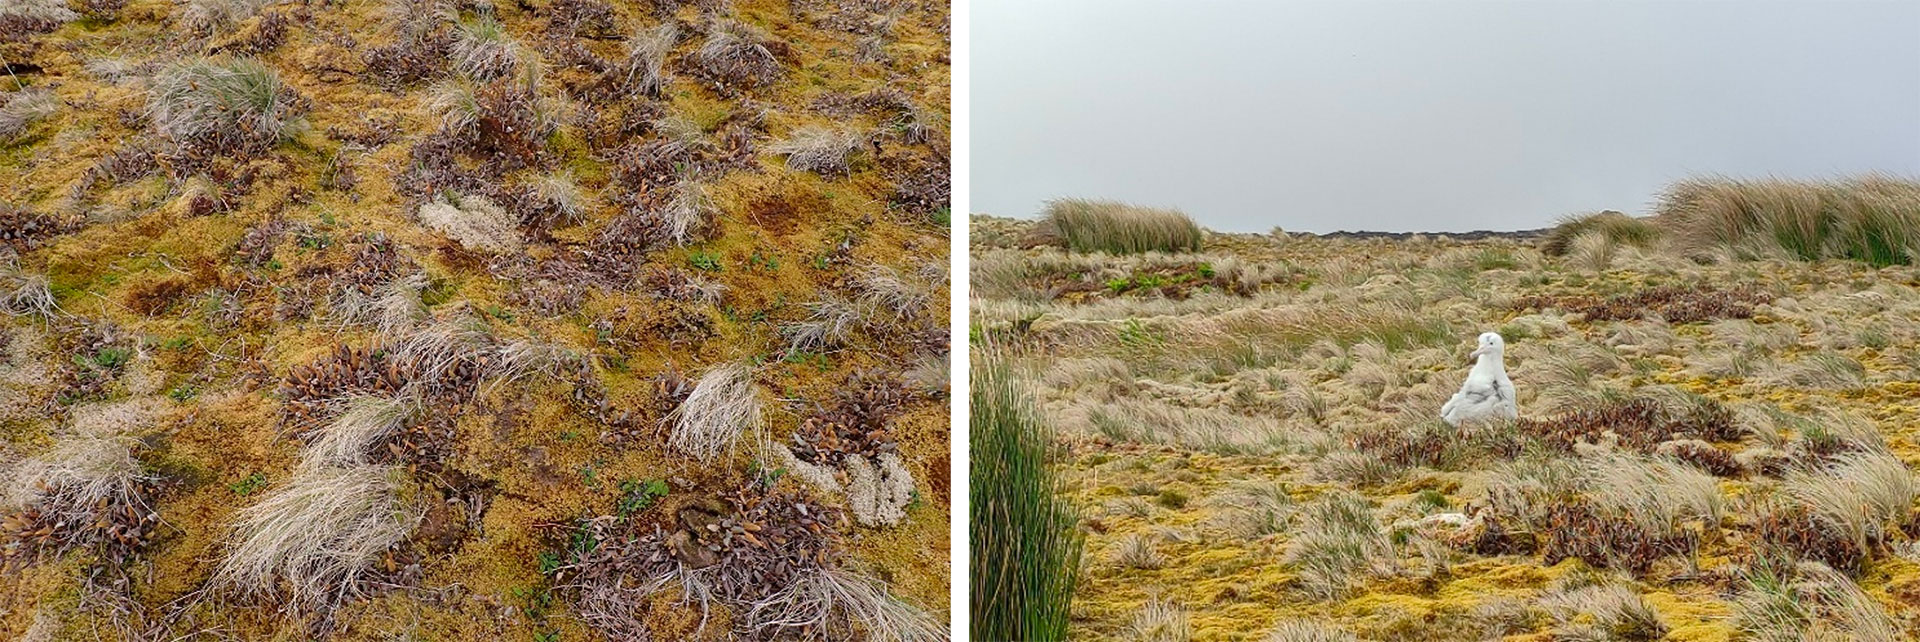
▲ Figure 3. Dicranoloma subconfine and/or Racomitrium lanuginosum bog and its Elaphoglossum succisifolium wet zone, occupied by the Amsterdam Albatross. © D. Espel, 2024
Observations also show that nesting areas are often located at the interface between several peatland habitats (Sphagnum spp. bogs) and parapeatland habitats (parapeatland grasslands with Racomitrium lanuginosum, Agrostis delislei and Poa alopecurus subsp. Fuegiana and mesic paraturf grasslands with Agrostis delislei and Carex spp.), suggesting that the species may seek a specific combination of microclimatic conditions and vegetation structure. These results provide new insights into the ecological requirements of the Amsterdam Albatross and form a valuable basis for the monitoring and conservation of this iconic species.
📗 As with the Crozet Archipelago within the Cartovege1 project, the expertise gained on the habitats of Amsterdam Island and the detailed understanding of their associated environmental conditions have enabled this typology to be formalized in the form of a guide to the terrestrial habitats of Amsterdam Island (currently being finalized). This guide will serve as a reference tool for scientists and managers of the French Southern Territories National Nature Reserve.
Finally, on Saint-Paul Island, classified as a strict nature reserve, the analysis of historical data (60 phytosociological surveys from campaigns authorized in 2018 and their associated photographs) has enabled the establishment of a correspondence table between the typology developed for Amsterdam Island and the habitats identified on Saint-Paul. This harmonization provides, for the first time, a coherent ecological framework across both islands, facilitating future work on mapping, ecological monitoring and conservation.
Cartographic modelling
A more effective hierarchical approach
The work has demonstrated the value of hierarchical classification models for mapping natural habitats. By explicitly integrating the structure of the typology (bottom-up hierarchical classification) into the prediction process, these models proved significantly more effective than linear (‘flat’) classification approaches, with, for example, a Kappa coefficient of 0.751 compared to 0.484 for ‘flat’ models, for predictions at the 3rd typological level.
These results thus confirm the value of combining ecological knowledge with the hierarchical structure of habitats in remote sensing models.
The contribution of artificial training data
The project also demonstrated the value of automatically integrating artificial training data generated from photo-interpreted drone imagery.
These data do not provide any notable improvement for the prediction of large ecological complexes (1st typological level with 5 classes to predict). However, from the 2nd typological level onwards, they significantly improve model performance, with gains of between 10 and 20% depending on the typological level considered (Figure 4).
► Figure 4: Comparison of the performance of models trained using different data sources. | 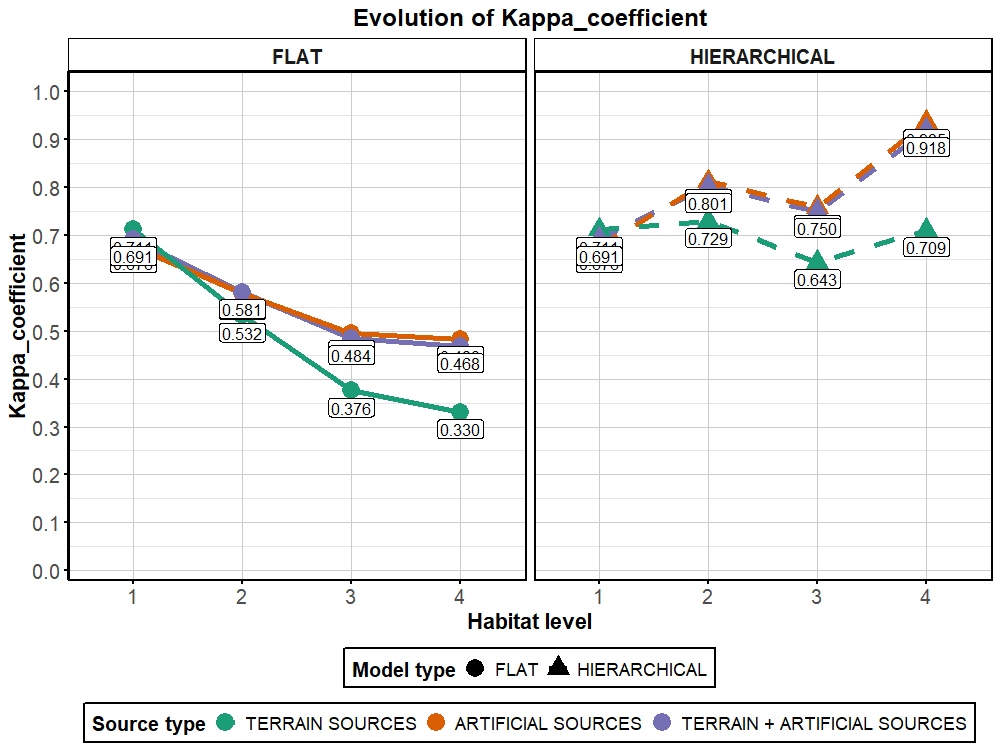 |
The performance obtained from a dataset consisting solely of artificial records is comparable to that obtained by combining field records and artificial records. These results open up interesting prospects for optimizing field sampling efforts and reducing the costs of acquiring the data required for habitat mapping.
Influence of the spatial resolution of training data
The results show that classification performance remains broadly stable regardless of the resolution of the training data used (50 cm, 1 m or 2 m), with comparable accuracy statistics across the different scenarios. This robustness suggests that, within the framework of the methodology developed, optical imagery information at the habitat unit scale is sufficiently discriminatory, regardless of the pixel resolution used for training.
These results indicate that it is possible to consider using multispectral satellite data at 2 m resolution (without systematic use of pan sharpening – 50 cm for Pleiades) for certain habitat mapping applications, which opens up interesting prospects in terms of reducing data costs and expanding the range of available imagery sources.
A near-exhaustive mapping of the habitats of Amsterdam Island
The results show that it is possible to map almost all of Amsterdam Island’s natural habitats using very high-resolution remote sensing data. The remote-sensing typology obtained is thus very close to the reference ecological typology.
Only a few very localized habitats, or those difficult to detect via imagery, could not be identified, notably the bryophyte-covered ravine bottoms of the Grandes Ravines de Del Cano and a tree and shrub formation comprising exotic species in the Antonelli crater, as well as certain aquatic habitats grouped into a single class.
At the third typological level (vegetation formations and non-vegetated habitats), the hierarchical model trained using field and artificial data achieved a Kappa coefficient of 0.76, indicating very good discriminatory power.
82% of habitats exhibit good to very good classification quality (57% of habitats with F1-scores > 0.71; 30% with F1-scores > 0.58), whilst only five classes show poorer performance (F1-scores between 0.31 and 0.47). These correspond mainly to habitats that are under-represented in the training data, to ecological transition zones, or to habitats with very similar spectral signatures.
Finally, the hierarchical classification models developed across the four typological levels all proved to be very robust and effective (0.68 < Kappa < 0.93 depending on the level), providing the first reference maps of the island’s habitats (Figure 5).
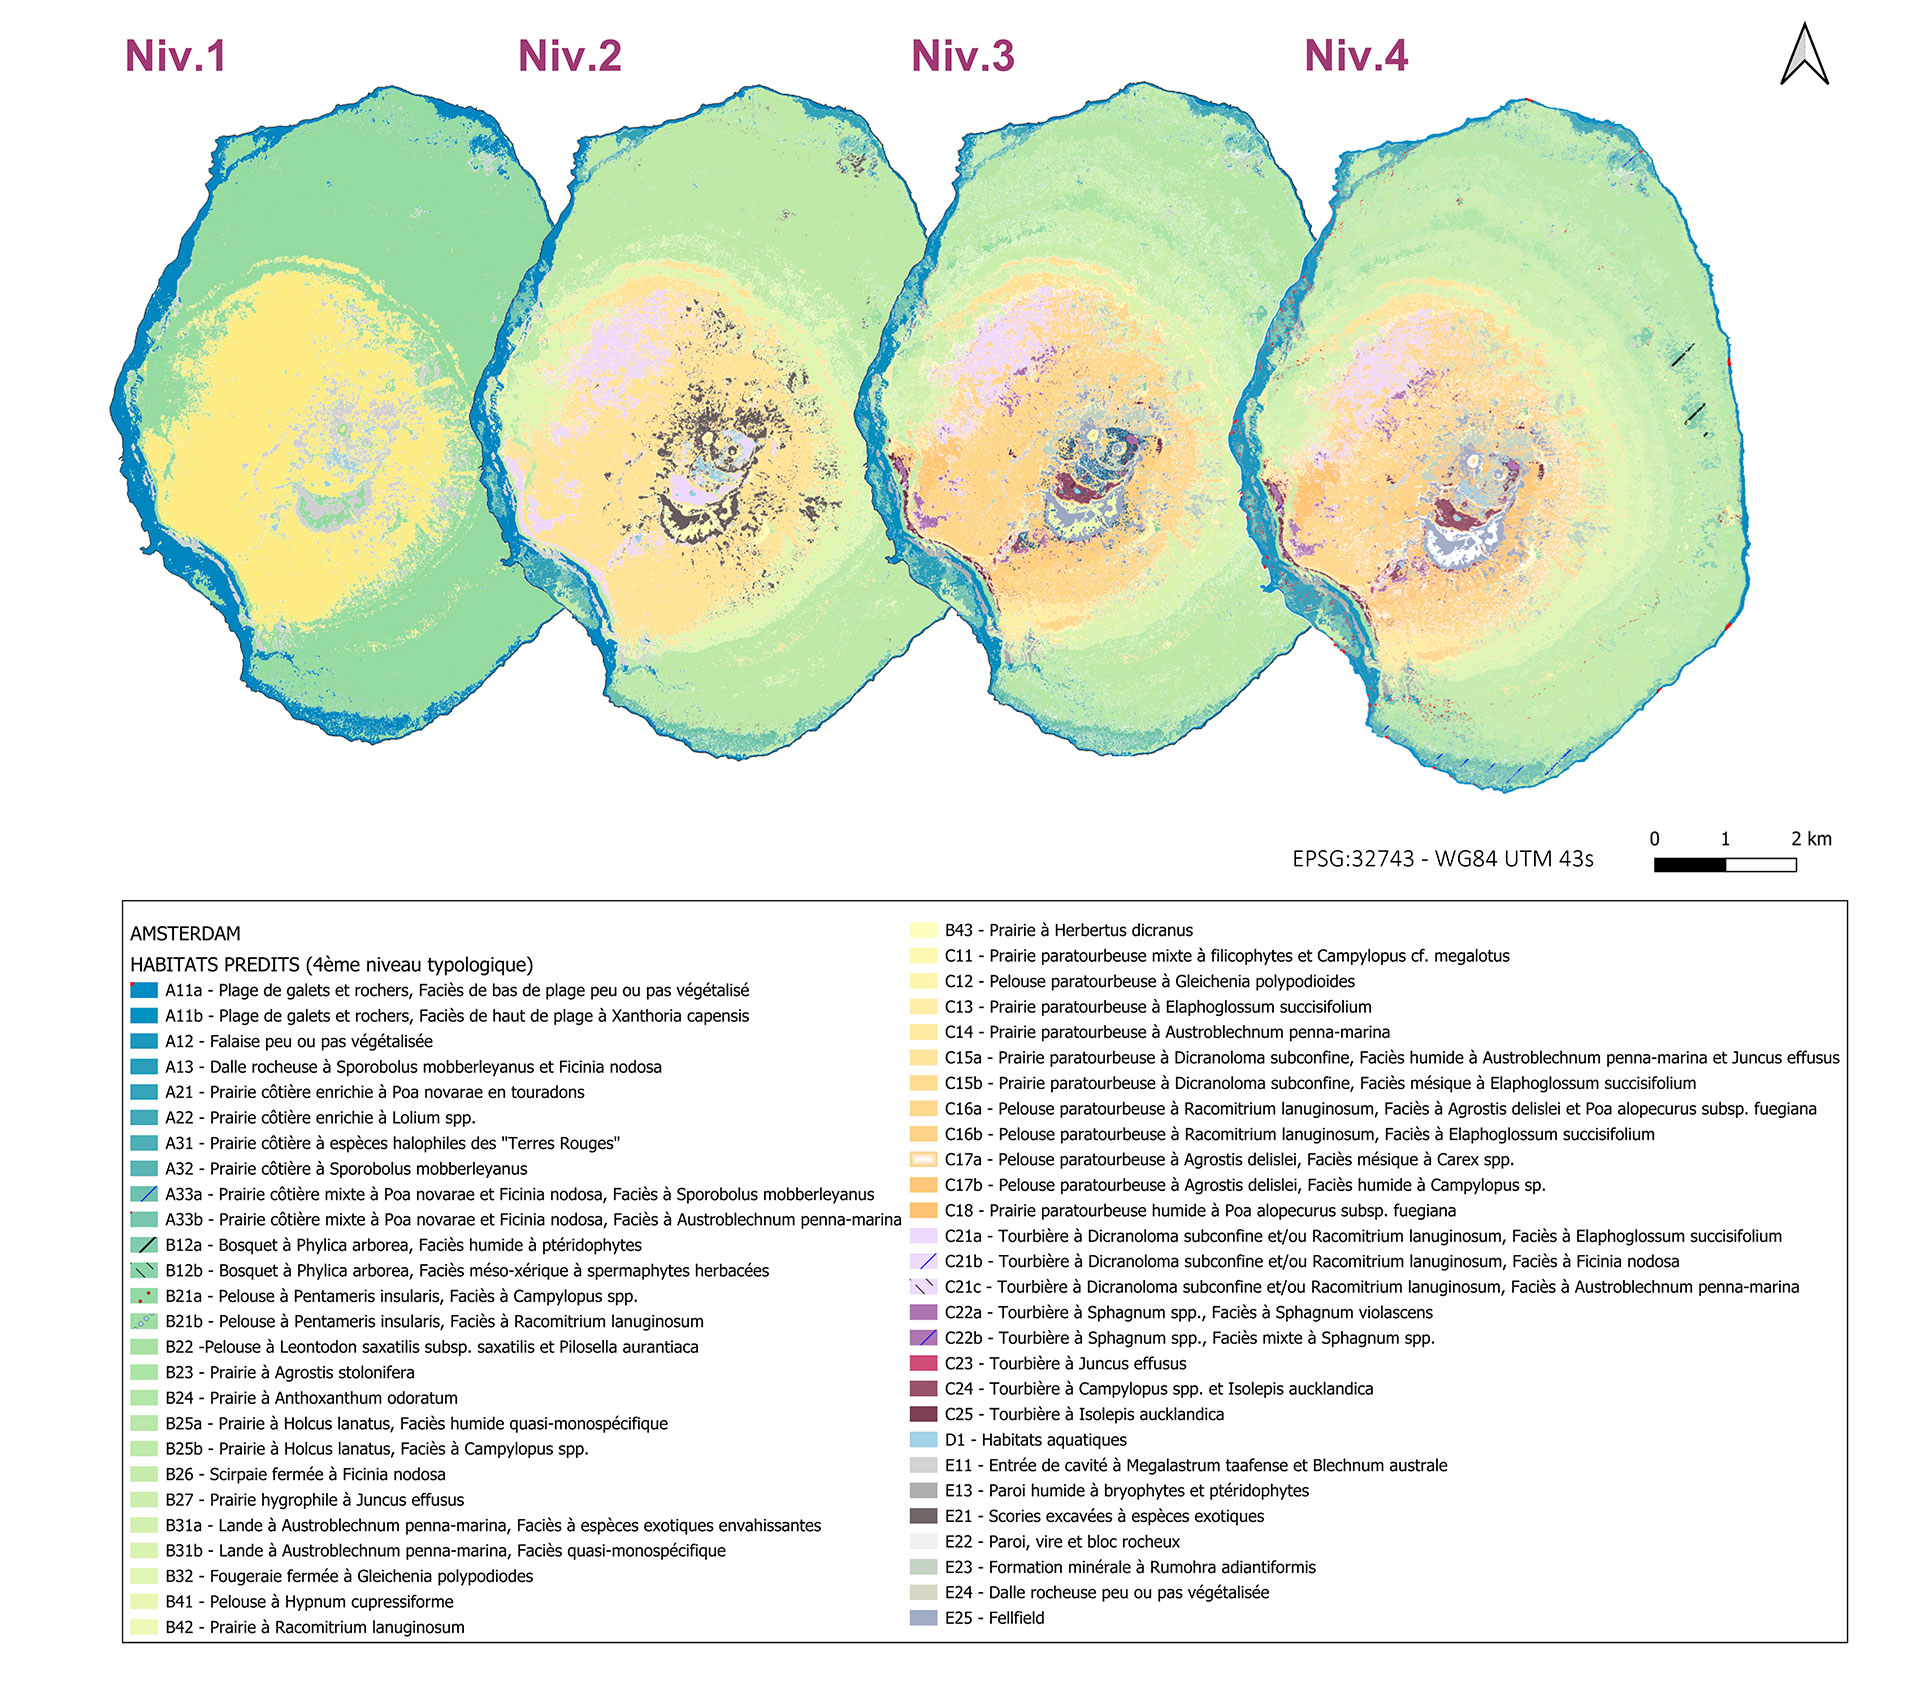
Figure 5: Maps of predicted habitats at all typological levels – reference year (November 2021, 50 cm resolution) – derived from hierarchical models trained on field data and synthetic data. Level 1 (habitats) is identified by a capital letter (e.g. ‘A’ for coastal and halophytic habitats). Level 2 corresponds to a letter–number combination, where the letter refers to the higher level and the number to a specific habitat type (e.g. A.1). Level 3 is defined by an incremental hierarchical numbering system (e.g. A.1.1). Level 4, corresponding to facies, is identified by lowercase letters (e.g. A.1.1.a).
This multi-level typological structure paves the way for numerous applications in mapping and ecological monitoring, particularly for the temporal analysis of vegetation dynamics and to support the management of natural habitats (see the ‘Outlook’ section below).
Examples of applications (temporal monitoring on Amsterdam Island, Amsterdam/St Paul comparison, before/after comparison of the January 2025 fire) can be found in the June 2026 news update, “Cartovege2: Mapping the Unique Biodiversity of the Subantarctic Islands”.
Outlook
CARTOVEGE2 presents a unique opportunity to use very high-resolution satellite imagery to track the trajectories of vegetation formations in isolated island territories with significant conservation challenges.
The methods developed during the project have demonstrated the feasibility of cartographic and reproducible monitoring of virtually all natural habitats using remote sensing data, whilst identifying the optimal trade-offs between spatial resolution, sampling effort and classification performance. These results pave the way for more operational monitoring protocols, transferable to other natural areas facing similar challenges in biodiversity monitoring and adaptive management, and less dependent on field surveys.
The maps produced now serve as a reference for studying vegetation dynamics on St Paul and Amsterdam Islands. They will enable scientists to analyze the effects of climate change, biological invasions, natural disturbances (e.g. fires) and ecological restoration efforts, particularly following the eradication of introduced mammals carried out in 2024 as part of the Indian Ocean Ecosystem Restoration (RECI) project.
Finally, these maps will feed into the plant species distribution models developed as part of the French Polar Institute’s ‘136-SUBANTECO’ project and the ‘ASICS’ project (Biodiversa). The integration of these spatialized data will improve projections of the future effects of climate change on plant communities and strengthen decision-support tools for the management and conservation of terrestrial ecosystems in the French Southern Territories.
References
| Cartovege2 on GEO Knowledge Hub, a long lasting digital repository created by the Group on Earth Observations: https://doi.org/10.60566/7pz26-dfy33 |
Related projects
SCO projects
CARTOVEGE1 (2021-2023)
Space4Nature, satellites and AI to map habitats in the UK
Non SCO projects
- RECI project ("Restoration of Indian Ocean Island Ecosystems")
- Institut Polaire Français Paul-Emile Victor project 136-SUBANTECO (Subantarctic biodiversity, effects of climate change and biological invasions on the terrestrial biota',2022-2025) which deals in particular with the distribution of plant species (native and invasive) within the TAFs;
- BiodivERsa 2021-2024 Biodiversity and Climate Change 'ASICS' project (ASsessing and mitigating the effects of climate change and biological Invasions on the spatial redistribution of biodiversity in Cold environmentS), the aim of which is to carry out predictive modelling of the distribution of flora at the scale of polar and alpine regions, under different climate change scenarios.
- SoilTemp: a global database of soil and surface microclimatic data
- INEE-CNRS Antarctic and Austral Territories Workshop Zone: long-term monitoring of Antarctic and sub-Antarctic biodiversity and ecosystems.
- CarHab, a national mapping programme for natural and semi-natural habitats carried out in collaboration with the OFB (Office Français de la Biodiversité), PatriNat (MNHN-OFB-CNRS-IRD), a centre for expertise and data on natural heritage, and the IGN (Institut national de l'information géographique et forestière), the CBN (national botanical conservatories), the EVS laboratory (UMR 5600, Jean Monnet Saint-Etienne University), the CESBIO (Centre d'Etudes Spatiales de la Biosphère), the CEREMA (Centre d'études et d'expertise sur les risques, l'environnement, la mobilité et l'aménagement) and the BRGM (Bureau de recherches géologiques et minières).
Project news
- 17/06/2026: Cartovege2: mapping the unique biodiversity of the sub-Antarctic islands
- 24/04/2025: Cartovege2: Mission Amsterdam
- 05/03/2024: Transition for Cartovege