

CARTOVEGE
Predicted maps of Amsterdam’s terrestrial habitats —reference year (November 2021, 50 cm resolution)—generated using hierarchical models trained on field data and synthetic data.
The 2015 satellite image, which differed significantly from the other images, did not allow for the creation of a usable map, likely due to errors in pixel interpretation. Since no imagery data is available between 2015 and 2020, changes in habitats during this period cannot be documented. However, starting in 2020, the maps allow for detailed and reliable monitoring of habitat changes across the island. © CARTOVEGE² - D. Espel (2026)
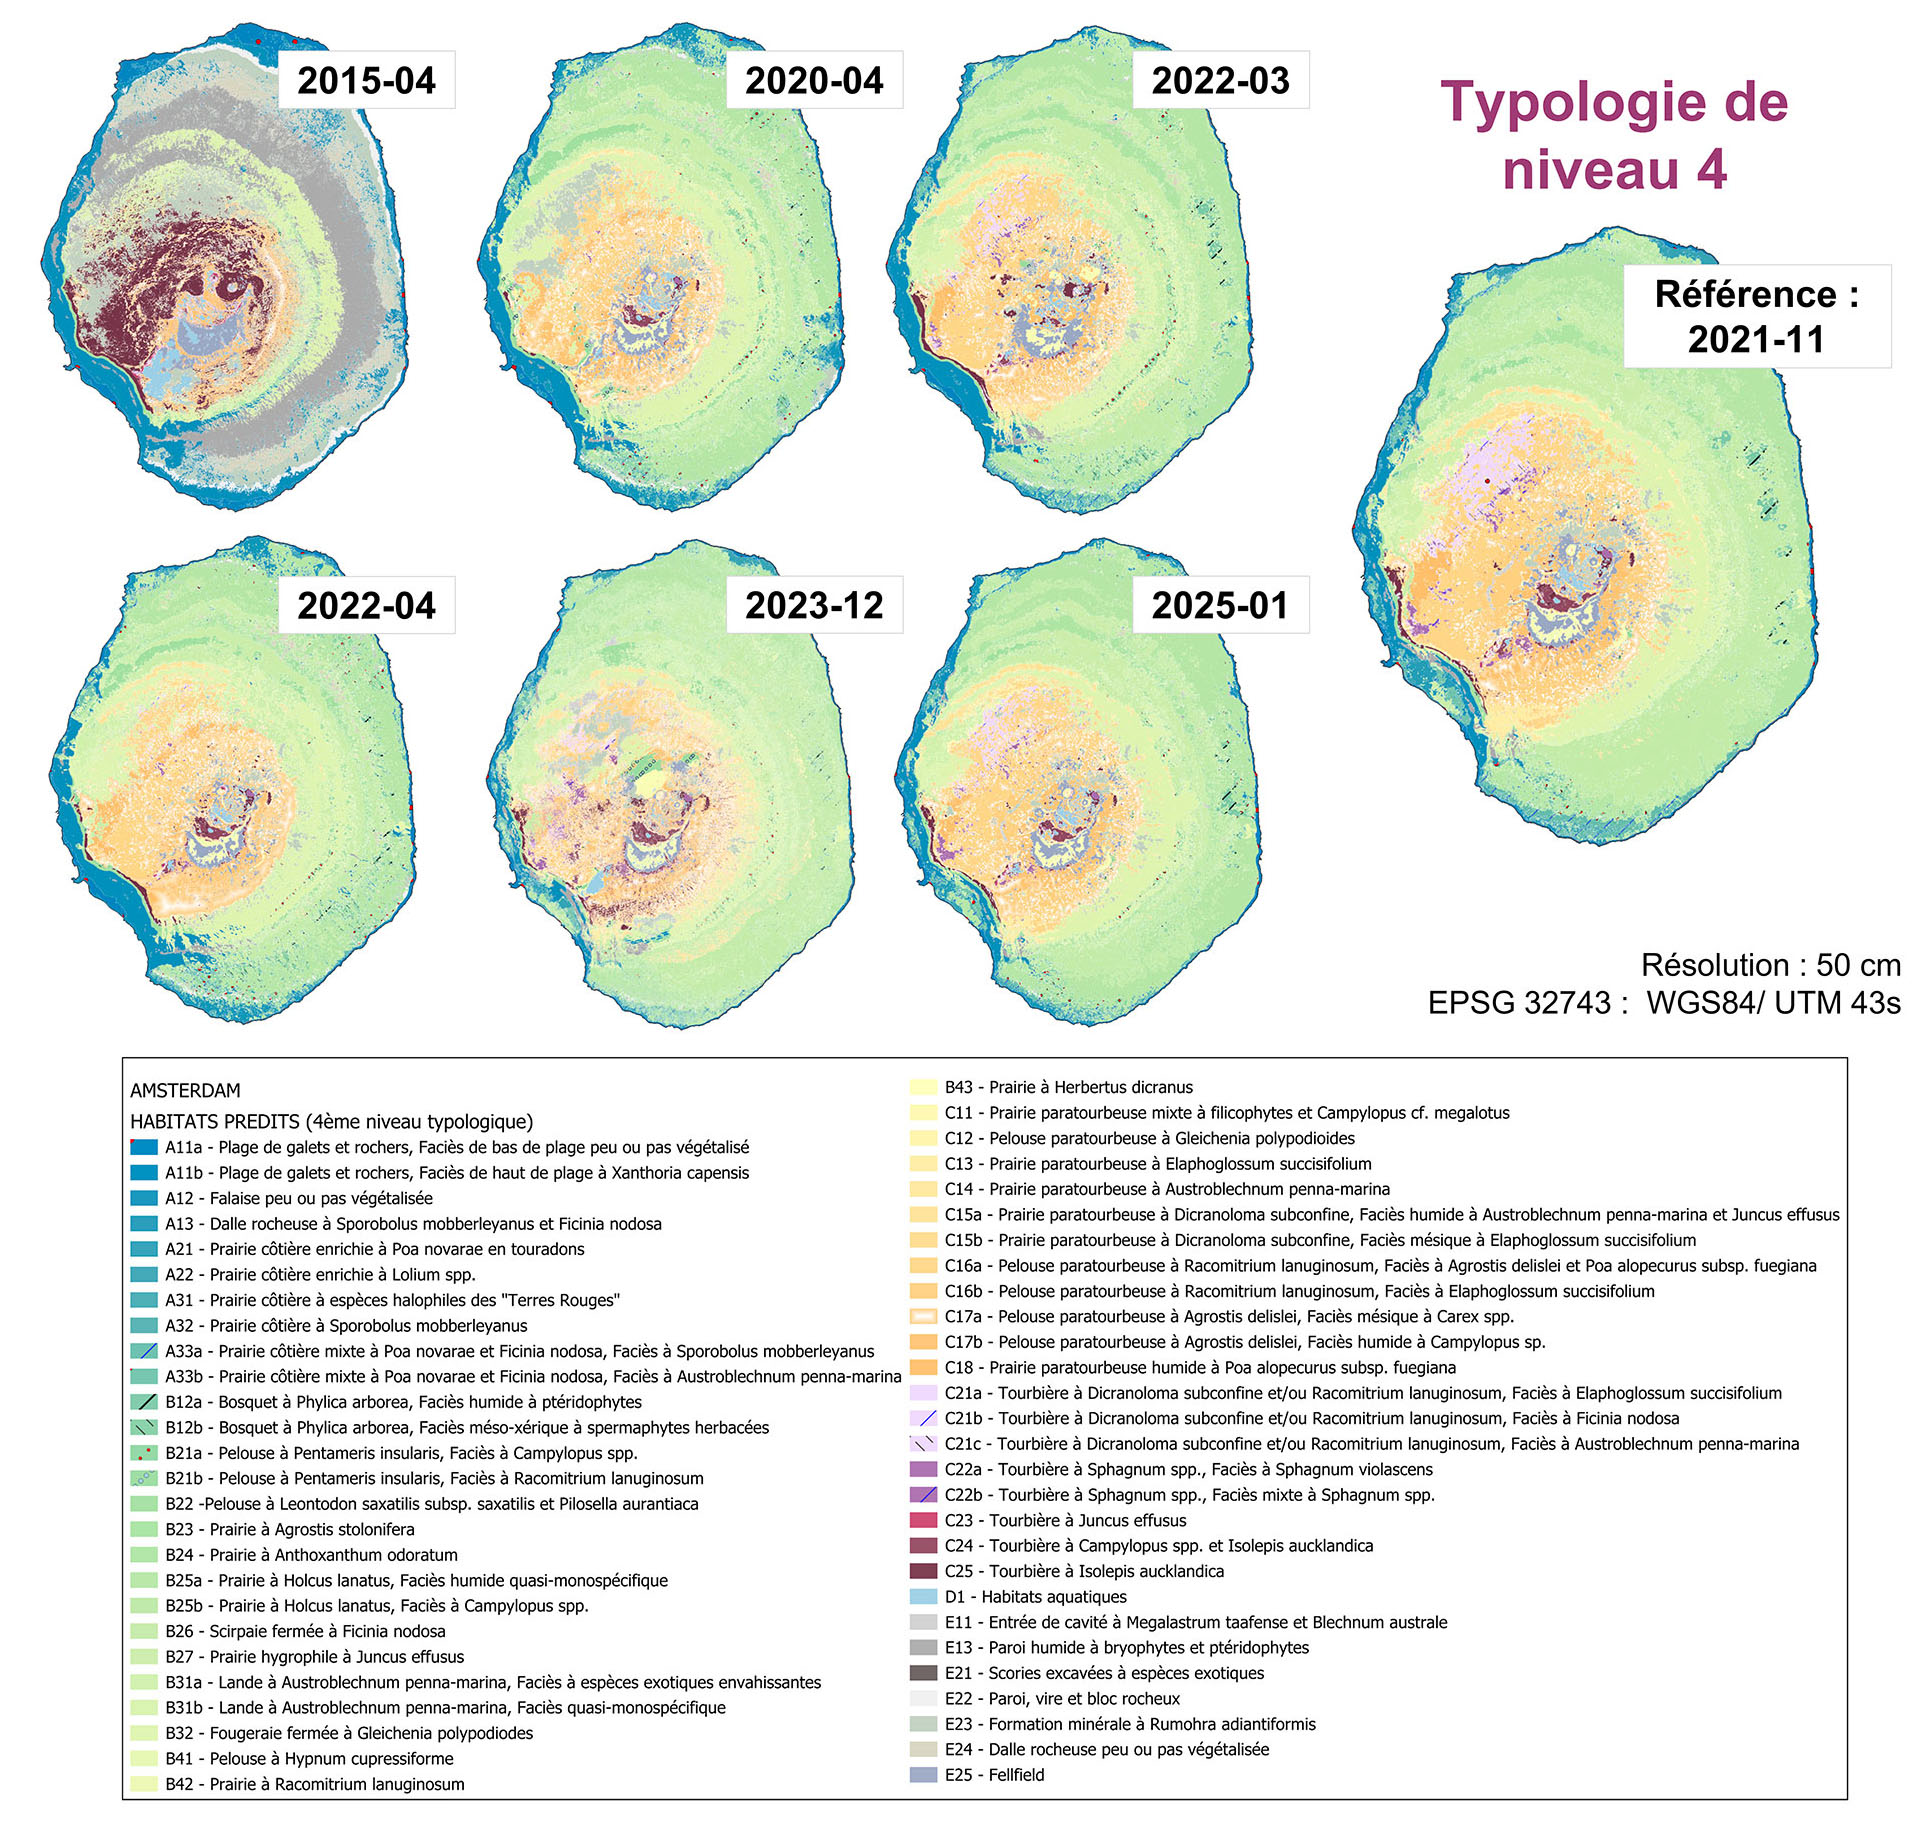
Level 1 (habitats) is identified by a capital letter (e.g. ‘A’ for coastal and halophytic habitats). Level 2 corresponds to a letter–number combination, where the letter refers to the higher level and the number to a specific habitat type (e.g. A.1). Level 3 is defined by an incremental hierarchical numbering system (e.g. A.1.1). Level 4, corresponding to facies, is identified by lowercase letters (e.g. A.1.1.a).