

SCOFrance
PartnersCNES, Maisons pour la Science, Académie de Toulouse, ESA
Useful links
KeywordsEducation, awareness, climate and temperature change, Sentinel-2 imagery
EducSCO: 1 link for 3 apps
EducSCO is THE SCO's cross-disciplinary project, one that has no end date because it regularly produces new resources to raise awareness among young people (and those who are not so young) about climate change using satellite data.
|
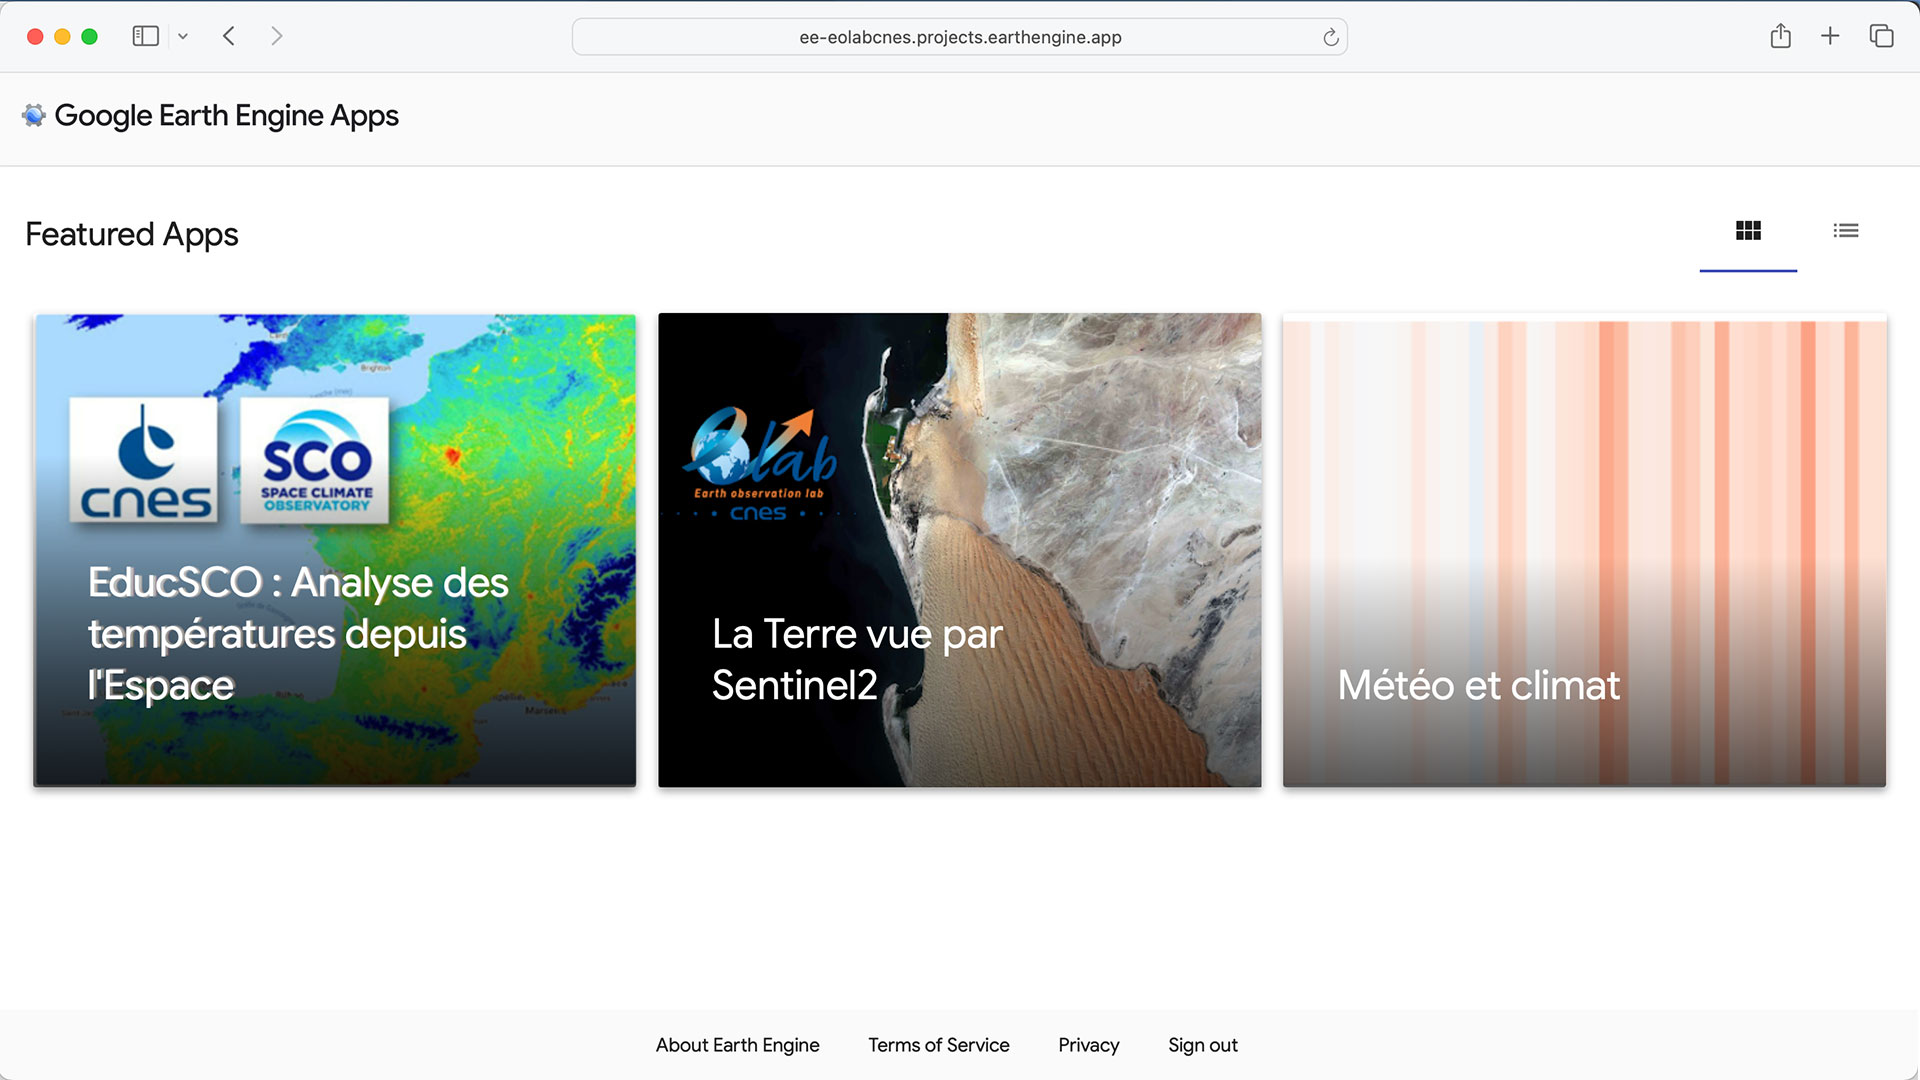
Today, it is pooling access to its flagship (and bilingual) apps, EducSCO Temperatures and EducSCO Weather and Climate, via a single web link, with the added bonus of access to the "Earth as seen by Sentinel-2" app. |
Users: remember to update the link(s)! |
The three apps were developed on Google Earth Engine with the same educational objective: to raise awareness among secondary school students about the effects of climate change by observing how the Earth is changing (Earth as seen by Sentinel-2), explaining the difference between weather and climate (EducSCO Weather & Climate) and showing how satellite data can be used to study temperatures (EducSCO Temperatures). Developed by engineers at CNES's Lab'OT in partnership with teachers, the applications are suitable for educational use at secondary school level. It should be noted that the more technical Earth as seen by Sentinel-2 application requires a more advanced level of knowledge of satellite images, in particular an understanding of spectral bands.
La Terre vue par Sentinel-2, an invitation to explore the Earth
Behind these apps is one person in particular: Olivier Queyrut, a specialist in Earth observation data processing and head of CNES's Lab'OT, as well as a SCO project advisor. He remembers that "in 2019/2020, Google Earth Engine offered the promise of easy access to all Sentinel-2 imagery combined with data processing and result visualization capabilities. Everything needed to show the Earth in all its landscape diversity, throughout the seasons, and to see how it is changing year after year as a result of human activity and climate change. That's how the Earth as seen by Sentinel-2 app was born."
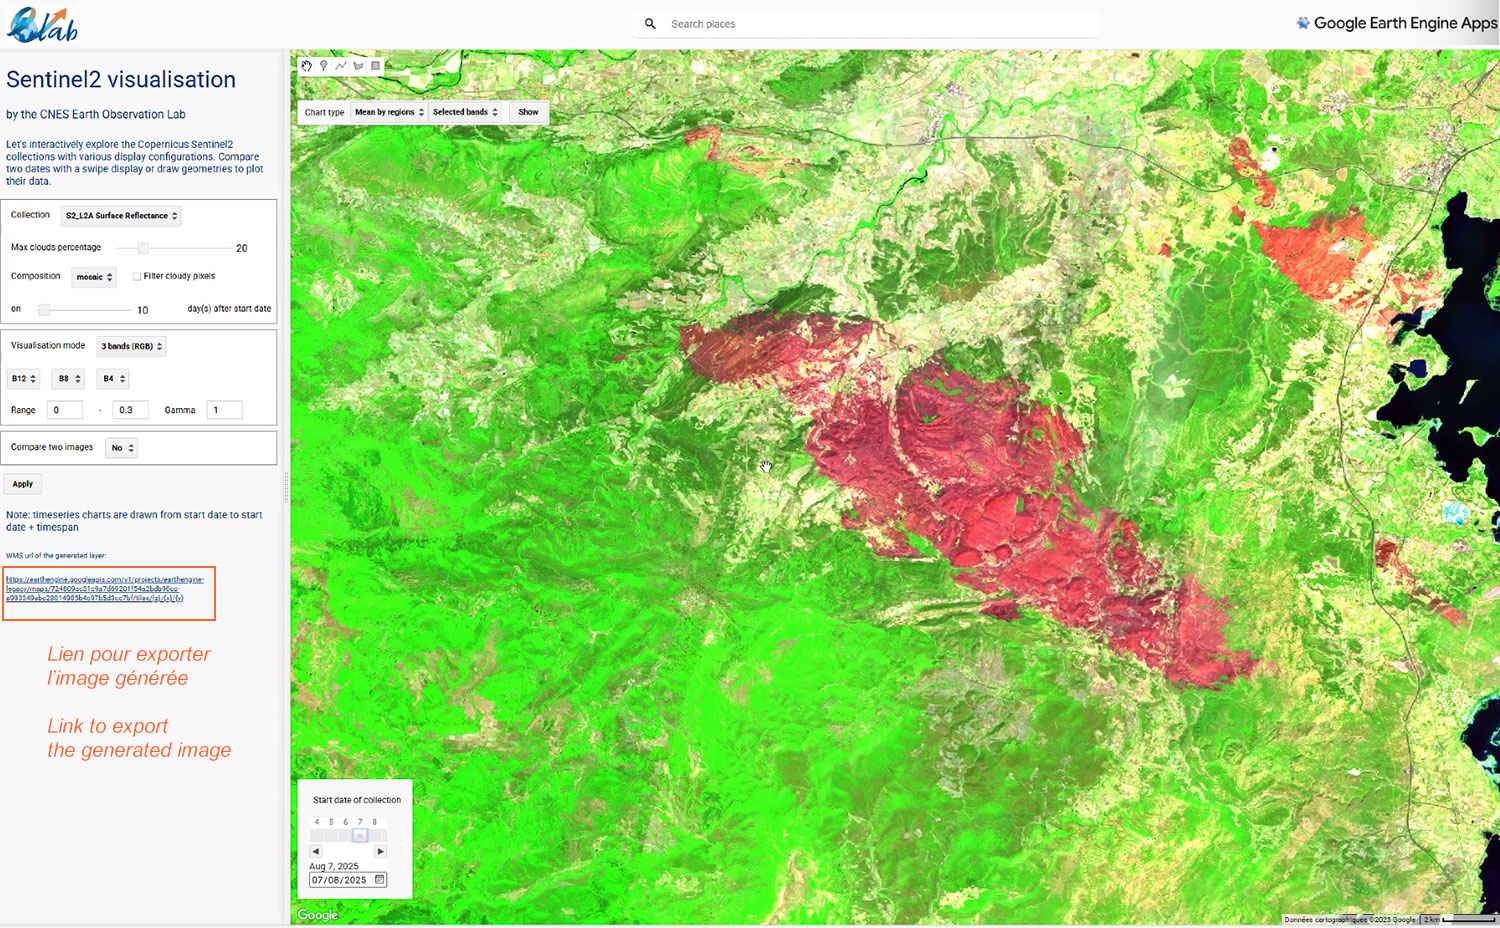
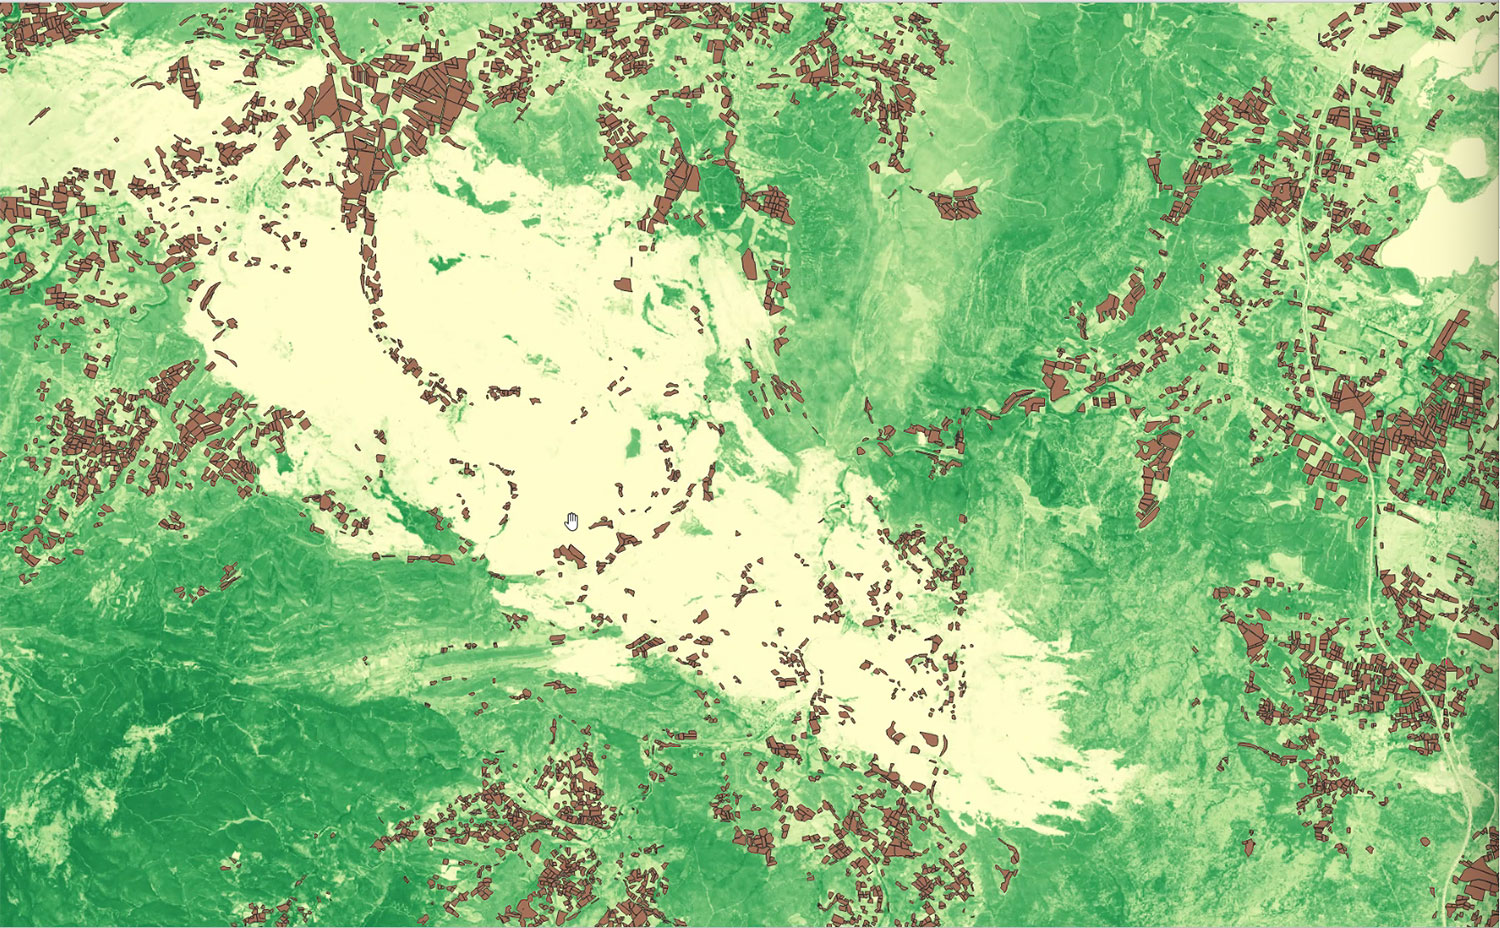
Today, Olivier not only still uses Earth as seen by Sentinel-2, but he is using it more and more: "The strength of this app lies in its ability to show everything that can be done with Sentinel-2 imagery to observe the territory and understand the phenomena (natural or man-made) that occur there." In fact, Olivier seizes every opportunity and every comment in a training session for an immediate demonstration. "Just recently, I was with people who were concerned about the impact of smoke on vineyards following the August 2025 fires in the Aude region in France. I was able to show them how to visualize the extent of these fires in just a few clicks. Then, with a simple copy and paste of the link generated by the app into QGIS, we were able to superimpose the vineyard plots onto this image," says Olivier. (see images below)
|
|
◀︎ Zoom in on the Aude region from 7 August 2025 to view the extent of the fires. |
|
|
◀︎ Export the image generated in QGIS to add the vineyard parcel layer. |
|
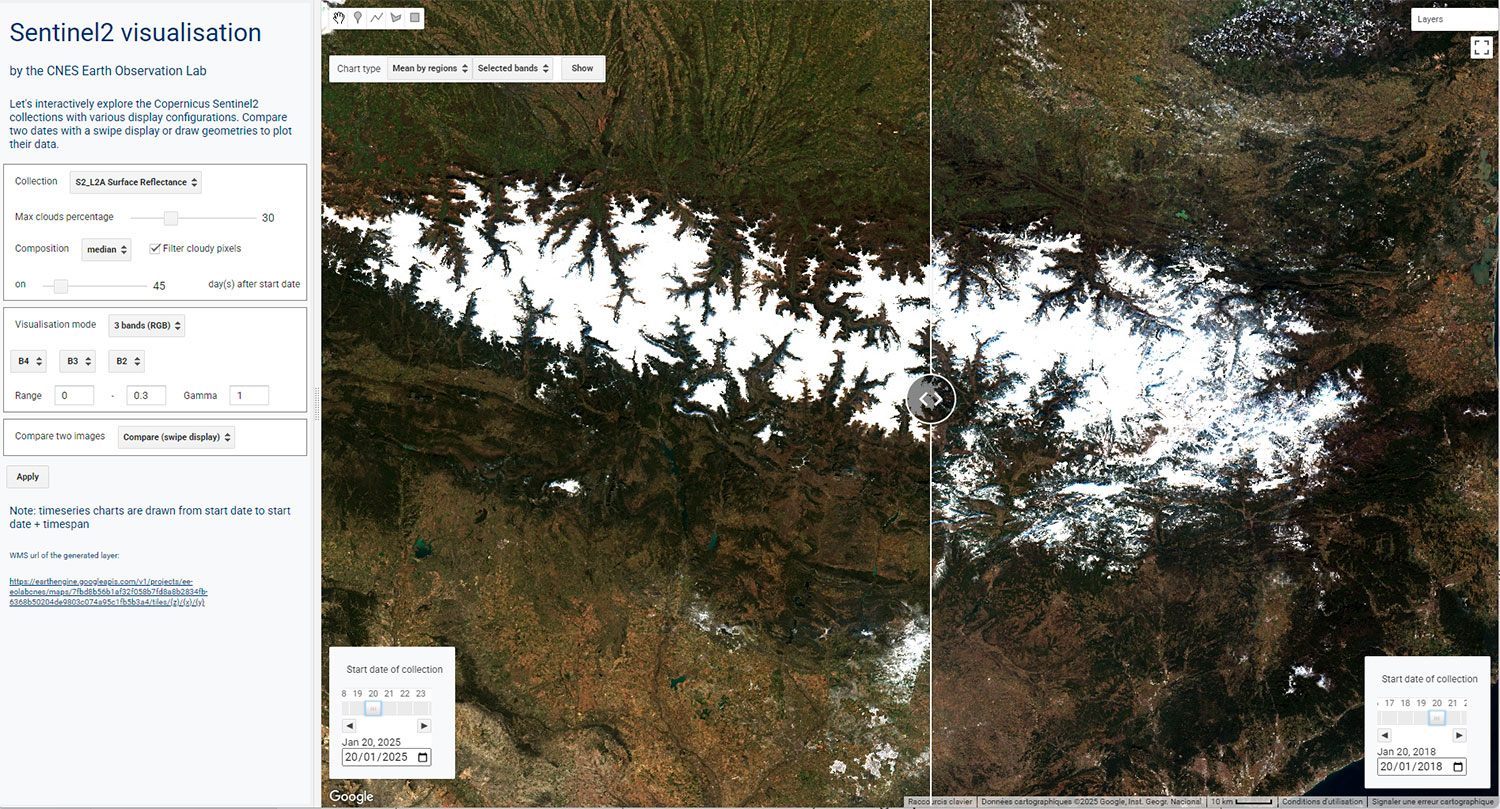
💡 There is one last feature worth mentioning that anyone can use: side-by-side comparison of the same area on two different dates.
► Comparison of snow cover in the Pyrenees in 2018 (right) and 2025 (left). |
|
The Earth as seen by Sentinel-2 is therefore an excellent way to familiarize yourself with satellite imagery.
The moral of the story: even if you know nothing about spectral bands, go ahead, try it out, compare and, as Olivier so aptly puts it, "See how beautiful our Earth is!".
⏱️ For immediate awareness of the impacts of climate change, take a look at the timelapses generated by Google Earth Engine: from the retreat of the Colombia Glacier to the drying up of the Aral Sea from 1984 to 2022, the images speak for themselves.