

SCOFrance
PartnersCerema, Geomatys, CNES, STOWA
Useful linksProject page
🎥 Demonstration at the March 2025 quarterly meeting
KeywordsPolder, wetlands, restoration, digital twin
EO4Wetlands, a digital twin for wetlands
|
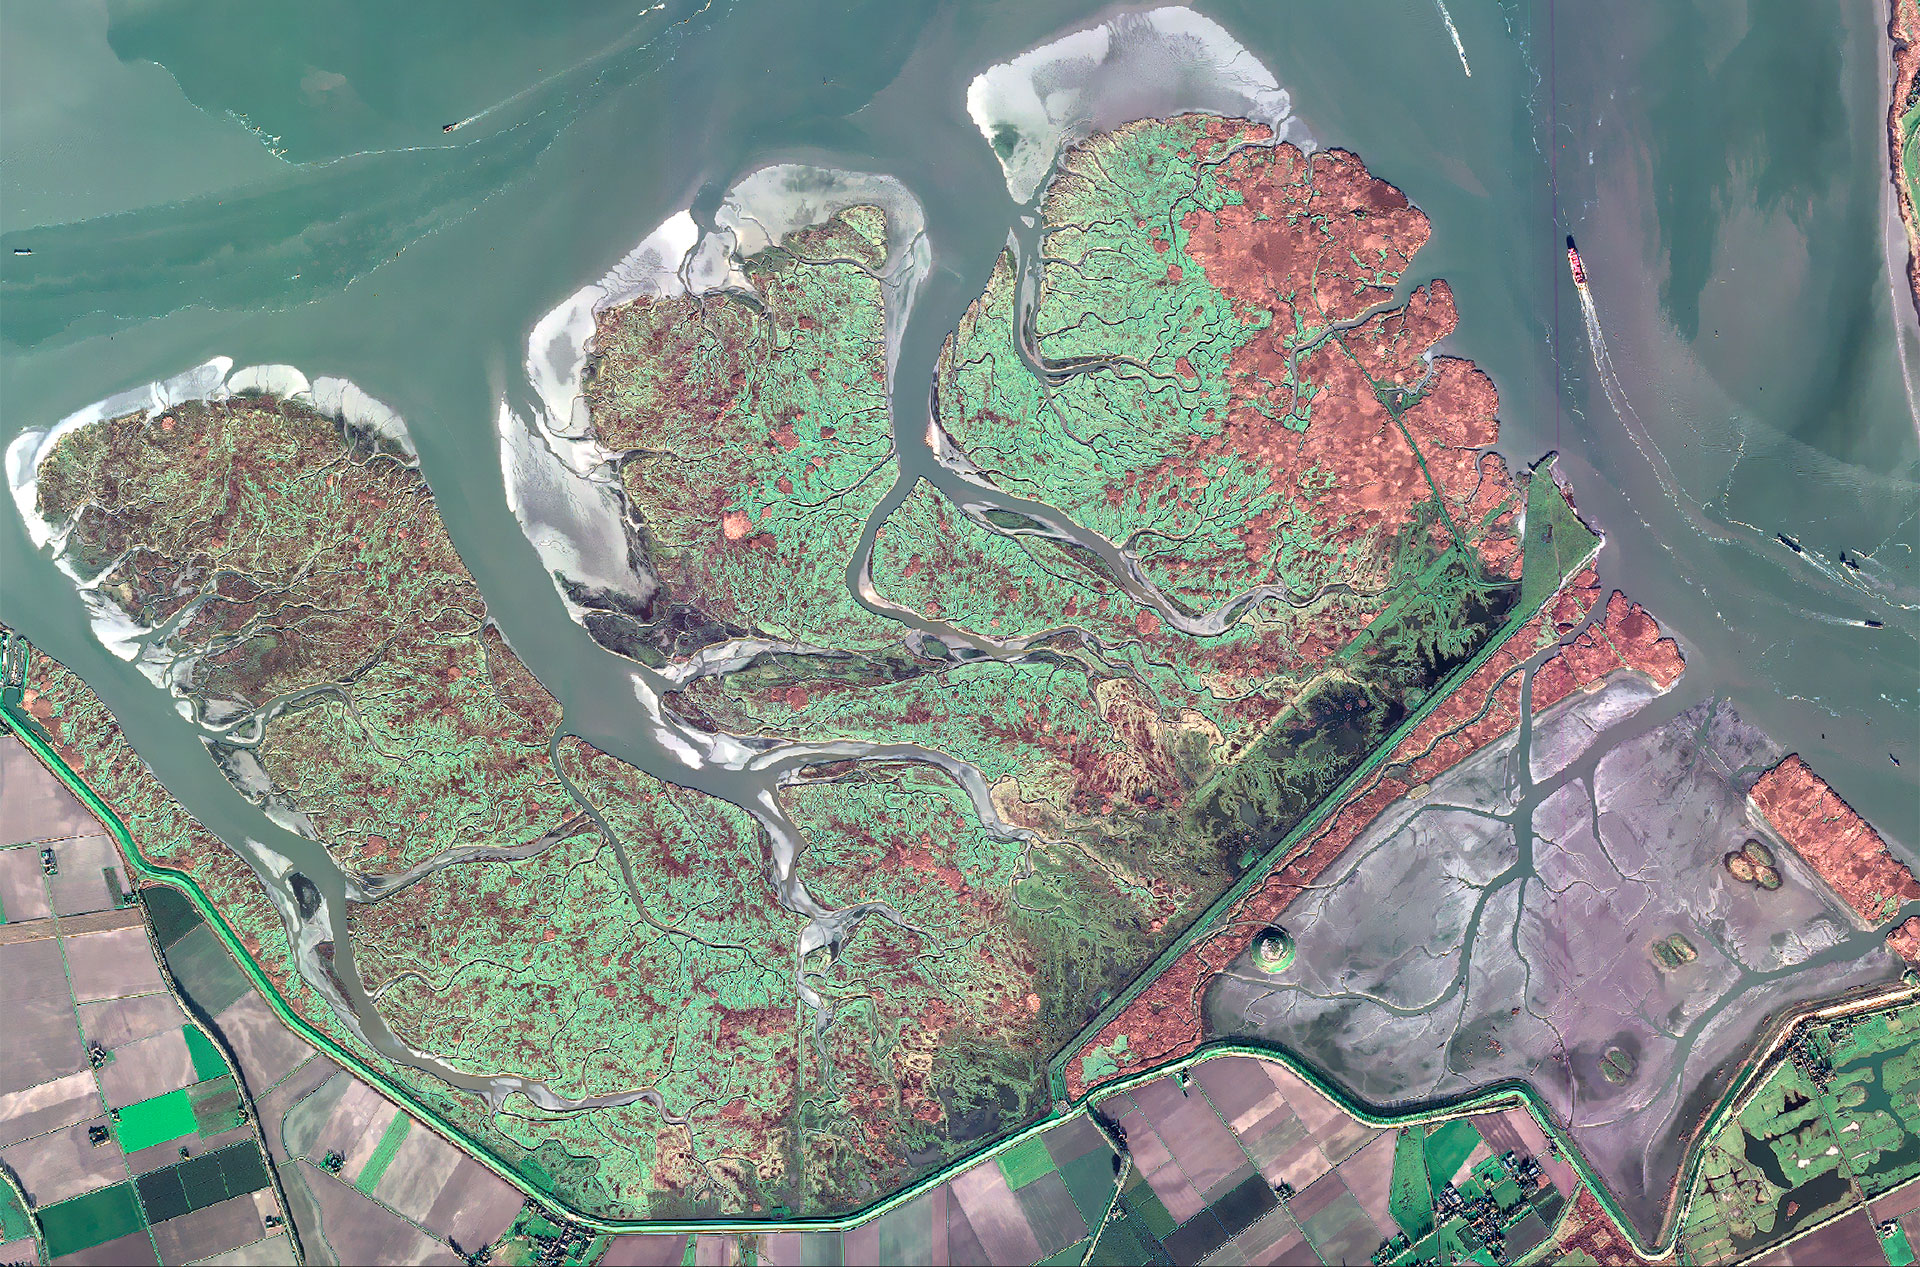
It was an ecological and scientific gamble: to give back to nature the land conquered by man. In 2022, on the border between the Netherlands and Belgium, the Hedwige and Prosper polder dike was destroyed, reconnecting these lands to the Scheldt River. In just 11 months, the old agricultural furrows, drainage channels and all other traces of human activity disappeared under the sediment brought in by the tide. It was a dramatic transformation, as if nature had simply been waiting for its turn. This is where the SCO EO4Wetlands project comes in. At the convergence of space technologies, ecological research and 21st-century climate issues, EO4Wetlands has built a database of satellite images acquired at different wavelengths and spatial and temporal resolutions to create a digital twin of the polder and monitor the renaturation of the site, which is subject to the influence of climate change and located in a heavily anthropised area. Some satellite estimates were verified using continuous measurements from a SoilVUE probe (Campbell Scientific) installed on site. |
A comprehensive approach Although the project began on the Belgian-Dutch polders, its ambition is much broader. After comparing changes in certain parameters on the former polders of Ploubalay and Freiston Shore (UK), the EO4Wetlands team is highlighting lessons learned from working on sites that have been renatured in the recent past. |
40 years of history captured from space
Led by Cerema (French Centre for Studies and Expertise on Risks, the Environment, Mobility and Development), EO4Wetlands goes back as far as possible and draws on four decades of satellite images (Landsat since 1985, Sentinel since 2018), a treasure trove of data. By combining these archives with field surveys, scientists can track the transformation of wetland ecosystems. Each pixel becomes an indicator: vegetation color, surface temperature, water content – everything is measured, compared and modelled. Using automatic classification algorithms, the project distinguishes between pioneer habitats and mature seagrass beds, identifies the return of biodiversity and its duration following renaturation, and enables the resilience of ecosystems to be assessed.
A digital twin to track the metamorphosis
|
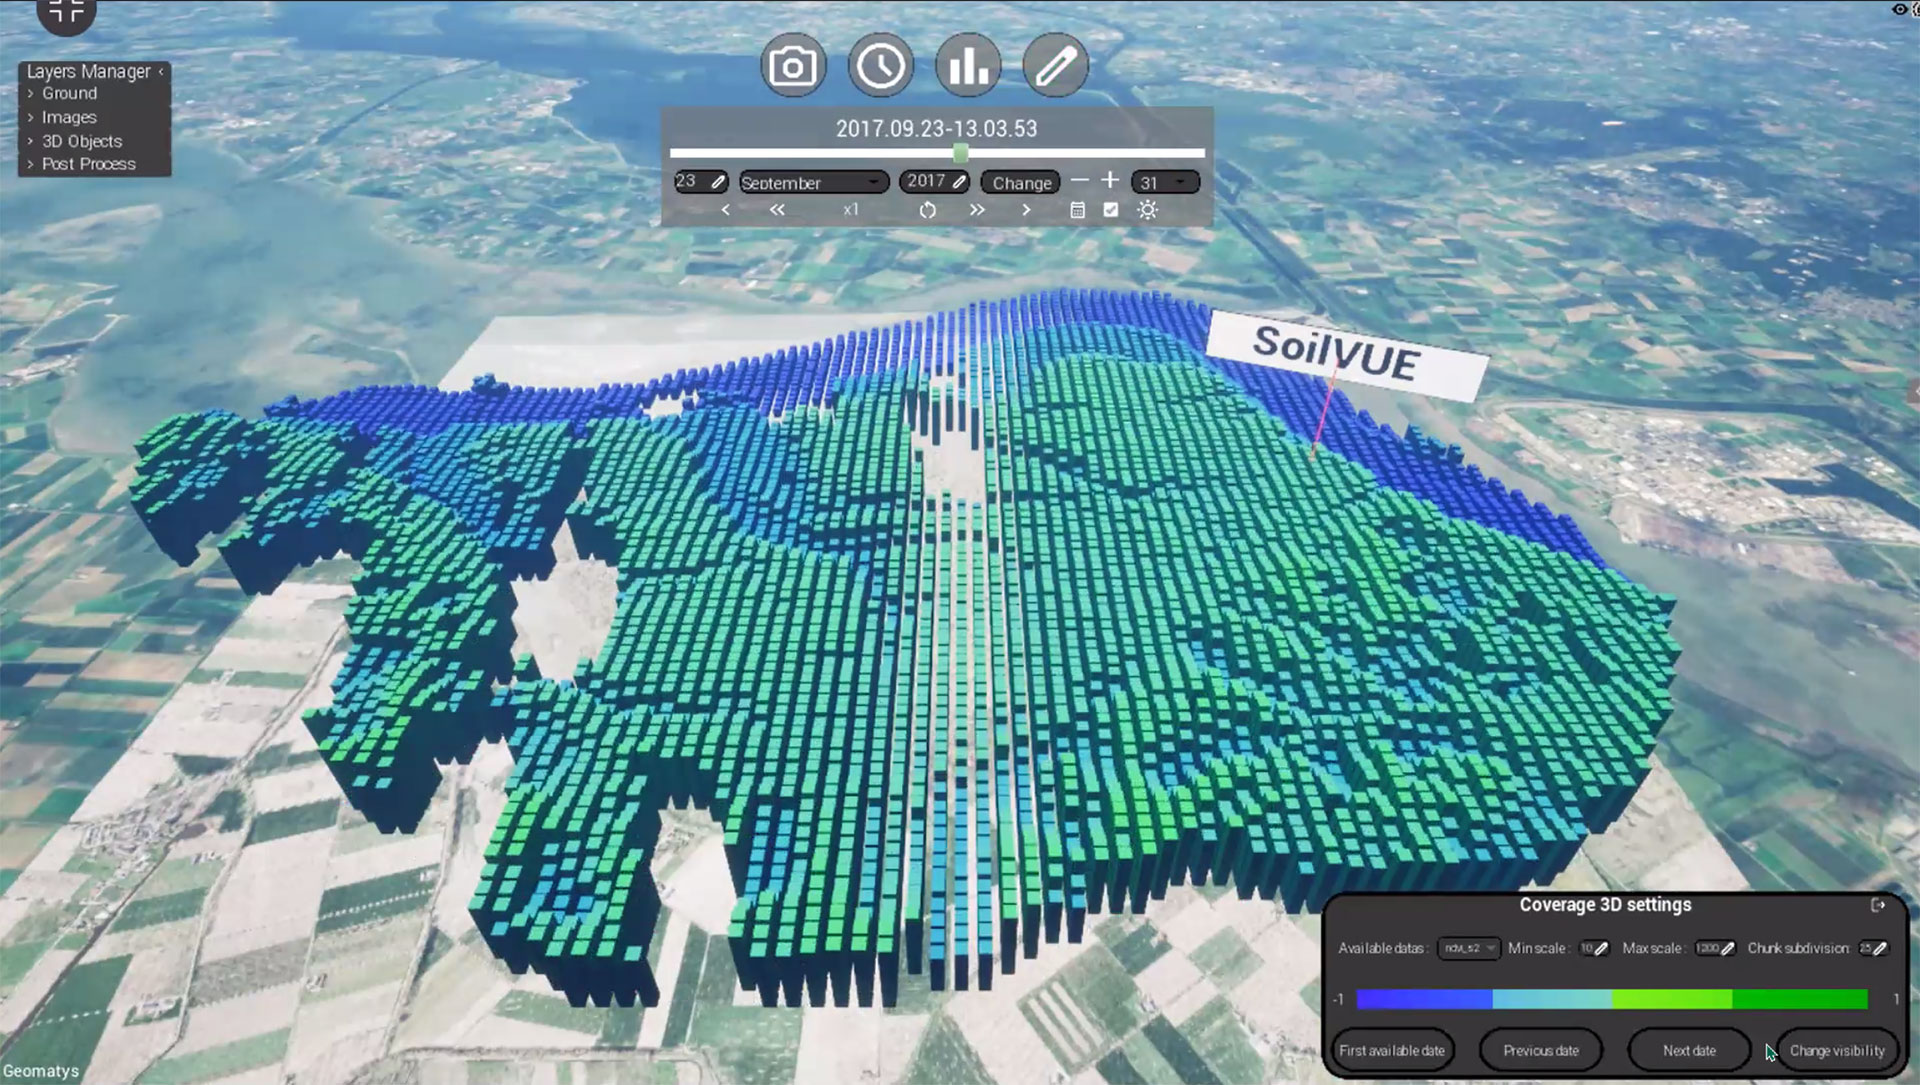
Designed by Geomatys, a digital twin merges all satellite and in situ data – geographical, hydrographic, oceanographic, meteorological – into an immersive, interactive and scalable interface. |
4,000 satellite images and products processed and provided by Cerema to design the digital |
Available for Linux and Windows, the platform allows all observations to be viewed in 2D or 3D and indicators to be extracted in the form of maps or graphs describing the evolution, through time and space, of vegetation and soil water content. This makes it possible to compare these key indicators and explore the correlations between tides, precipitation and soil dynamics.
|
|
◀︎ The digital twin implemented by EO4Wetlands provides a detailed visualization of land-sea interface phenomena. © Geomatys |

|
|
◀︎ Visualization of indices in the form of a 3D bar chart. © Geomatys |
Results: where the dyke disappears, life returns
EO4Wetlands analyses show a gradual transformation of wetlands, with visible short-term impacts and significant long-term climate trends.
📍 In the short term (1 year): nature in fast motion
- Pioneer vegetation began to establish itself in the first year, as shown by the NDVI and EVI vegetation indices.
- Sentinel-1 (radar) data show increased variability in soil moisture.
- Sentinel-2 images reveal the emergence of new vegetation patterns.
- The soil temperature at a depth of 5 cm, measured on site, is very close to satellite estimates.
🧭 In the medium term (2–5 years): towards complex habitats
- The classification method developed as part of the project provides an initial diagnosis of how the main habitat classes have changed over time. The return of species characteristic of wetlands indicates a shift towards more perennial plant formations.
- Tides dominate the dynamics by shaping temperature, humidity, and even plant growth.
🌡️ Long term (40 years): a significant climate trend
- Between 1980 and 2020, the average air temperature rose by +1.7°C, and sea level rose by +7.6 cm.
- Since 2015/2016, NDVI values have remained higher in winter, indicating denser vegetation linked to lower winter temperatures.
- These data provide a valuable historical basis for anticipating future changes.
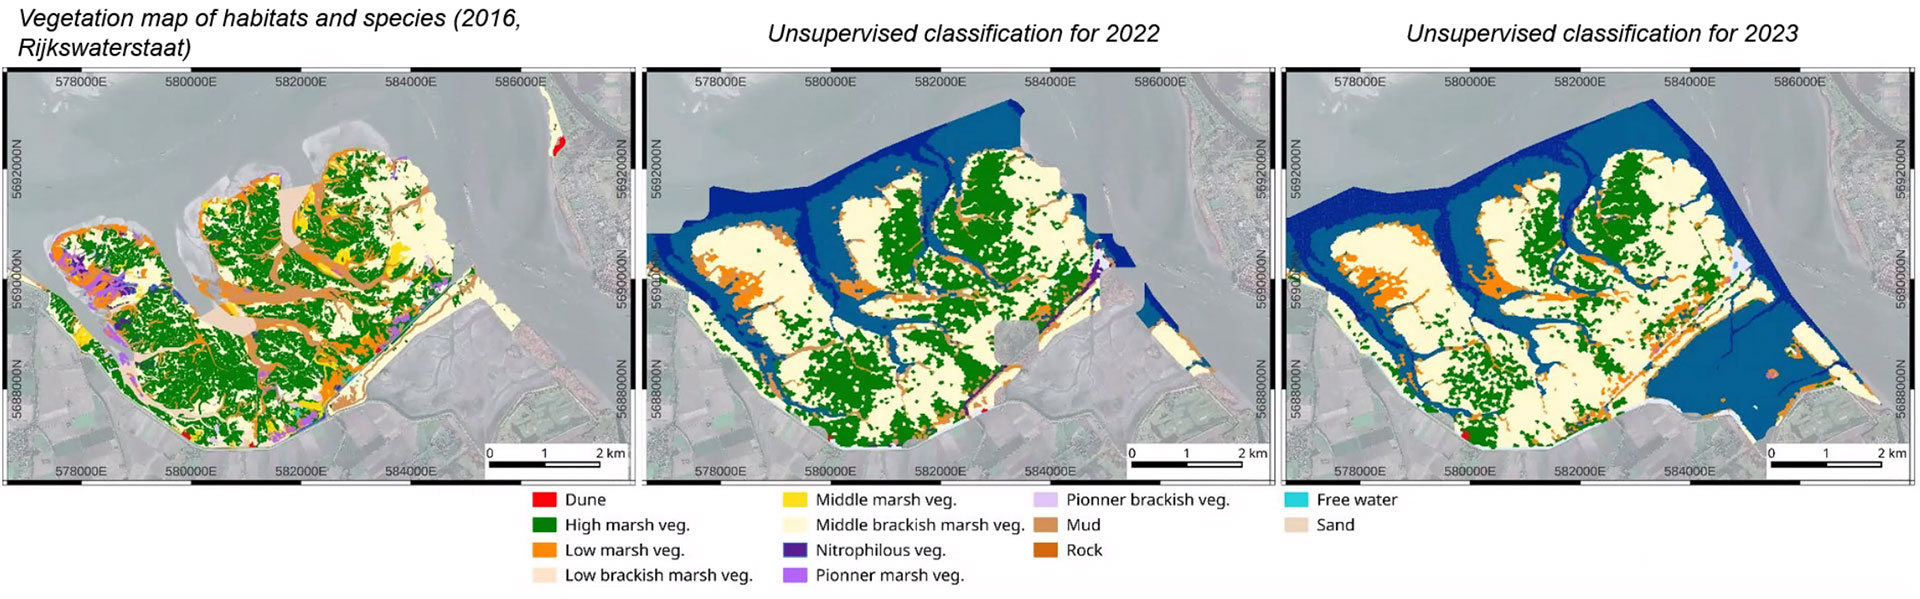
▲ a) Map of habitat and species vegetation in 2016 obtained through photo interpretation and field surveys © Rijkswaterstaat. Maps b) and c) show the unsupervised classifications of habitats in the Saetfinghe wetland and the former Hedwige and Prosper polders for 2022 and 2023 respectively. The majority classes obtained by automatic classification are associated with the habitats surveyed during the 2016 campaign.© Cerema
For more information, visit the project page
The story continues with BONSAI
Thanks to the solid technological foundations laid, the EO4Wetlands adventure is now continuing through the European Interreg NWE BONSAI (Boosting flood resilience in estuarine systems anticipating shifting climate zones) project, which aims to strengthen the resilience of flood defense systems in estuaries. Still with the support of Cerema, BONSAI is being led by the Dutch Foundation for Applied Water Research (STOWA), which was the main partner in the EO4Wetlands project. The circle is now complete, and Europe will soon have the appropriate tools to build a transnational strategy and more resilient local action plans, with better disaster management.