

EO4Wetlands

Earth observation for multi-scale monitoring of wetlands restoration
Project completedBy combining various satellite data acquired at different wavelengths, spatial and temporal resolutions, EO4Wetlands has implemented a digital twin to study the transformation of the former Hedwige and Prosper polders in relation to the neighboring wetland of the Saeftinghe Floodplain. The classification method developed provides an initial diagnosis of the evolution of the main habitat classes over time. Based on unsupervised classification, these results can be reproduced anywhere, provided that prior knowledge of the terrain is available to interpret these classification maps. Work is now continuing through the Interreg NWE BONSAI project to promote estuary defense systems in the face of climate change.
Overview
Wetlands are among the critical ecosystems that play a major role in climate change, biodiversity and hydrology. The 2017 World Wetlands Days particularly highlighted how wetlands help cope with disasters such as floods and tides. As part of the Polder2C's Interreg project, experiments on the polder of the Living Lab Hedwige-Prosperpolder (LLHPP), on the Dutch-Belgian border, will lead to the partial destruction of a seawall and to wetland restoration. This was a unique opportunity to monitor itsevolution in a maritime context faced with rising sea levels and, more broadly, global warming. To achieve this goal, the multiplicity and availability of Earth observation data offer new tools.
The project thus lays the foundations for a wetland monitoring tool that brings together all the data on study sites obtained from in situ sensors and satellites, making it available to end users. The operational result, based on automatic recognition, consists of a synoptic view of habitat changes at different spatial and temporal scales. The tool thus helps end users in charge of flood defense systems to monitor changes in vegetation, for example.
Application site(s)
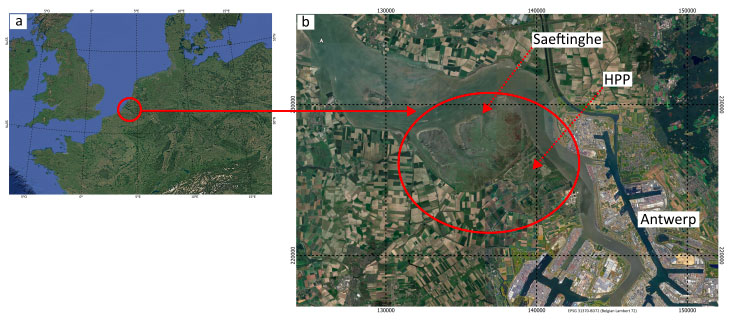
Living Lab Hedwige-Prosperpolder, Belgium/Netherlands
|
► The study area encompasses the Saeftinghe Floodplain wetland and the former HPP (Hedwige-Prosper polders) polders. © Cerema |
 |
Data
Satellite
- Sentinel-1 (radar)
- Sentinel-2 (multispectral)
- Sentinel-3 (thermal infrared)
- Landsat (multispectral and thermal infrared)
- ALOS -1 & -2, RISAT, MODIS (NDVI and thermal infrared product)
- Pléiades (multispectral)
This data was used to gain a better understanding of the evolution of the renaturation of the polders in relation to the Saeftinghe Flooded Country wetland.
|
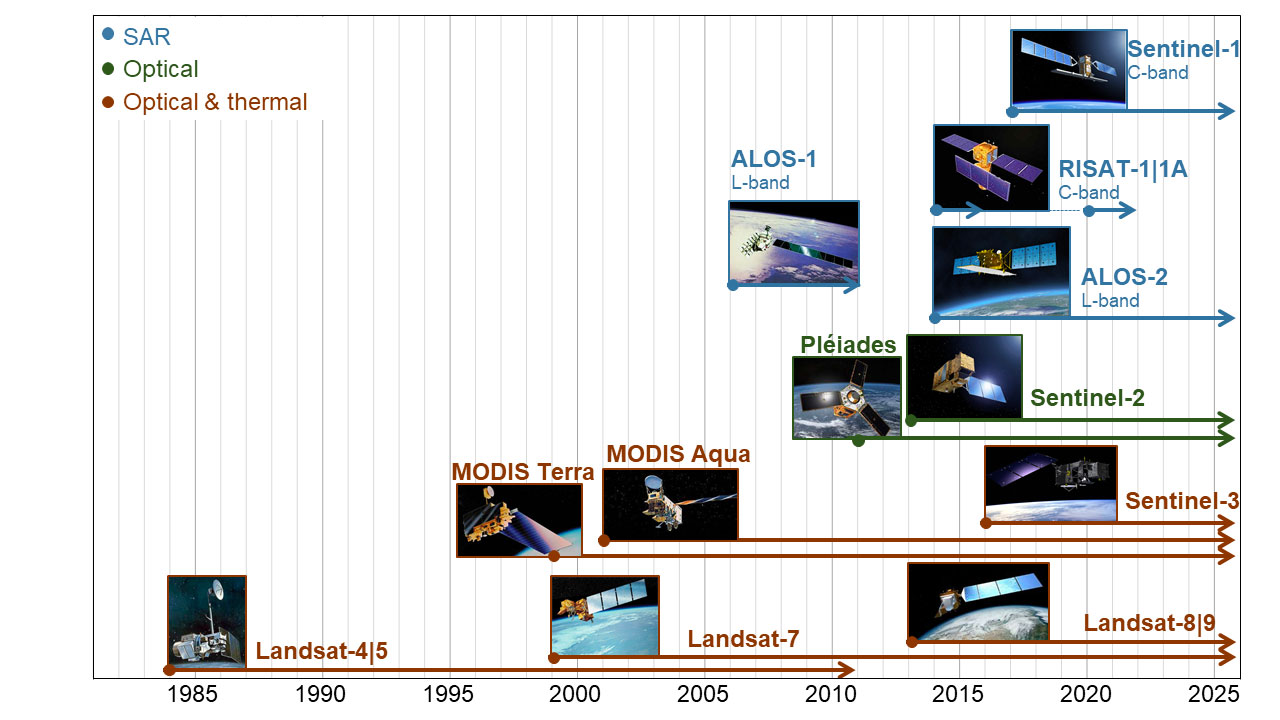
► Satellites used in the project. The colors represent the observation wavelengths and the arrows represent the period taken into account. © Cerema |
|
Methodology and role of satellite data
In order to study the evolution and transformation of the study site into a wetland and the flooded land of Saeftinghe, a catalog was compiled comprising Sentinel and Landsat images dating back to 2018 and 1985, respectively, as well as MODIS, ALOS, and Pléiades images.
This variety of satellite data, acquired at different wavelengths, spatial and temporal resolutions, made it possible to estimate:
- the correlation between different data sets, particularly those associated with sensors installed at the study site.
- the influence of climate change on wetlands over the past 40 years.
- the influence of tides and meteorological phenomena on variables measurable from satellite data and in situ sensors.
- the evolution of renaturation based on habitat classification.
This information is based on:
- classification of visible and near-infrared data via NDVI (Normalized Difference Vegetation Index) and/or EVI (Enhance Vegetation Index).
- monitoring of wetland dynamics due to variation in surface water content using radar data.
- Validation of satellite surface temperatures in the study area against surface temperature measurements taken by a SoilVUE probe (© Campbell Scientific), installed during the project.
Time series of satellite images make it possible to monitor day-to-day changes in floodplains and vegetation during the renaturation of a former polder. This diversity makes it possible to examine the correlations between spatial measurements and in situ probe readings, to assess the impact of climate change on wetlands based on forty years of observations, and to study the influence of tides and meteorological phenomena. Specifically, the EVI index obtained from Sentinel-2 images has enabled the development of an unsupervised automatic classification method to track habitat changes over time and space following renaturation.
|
|
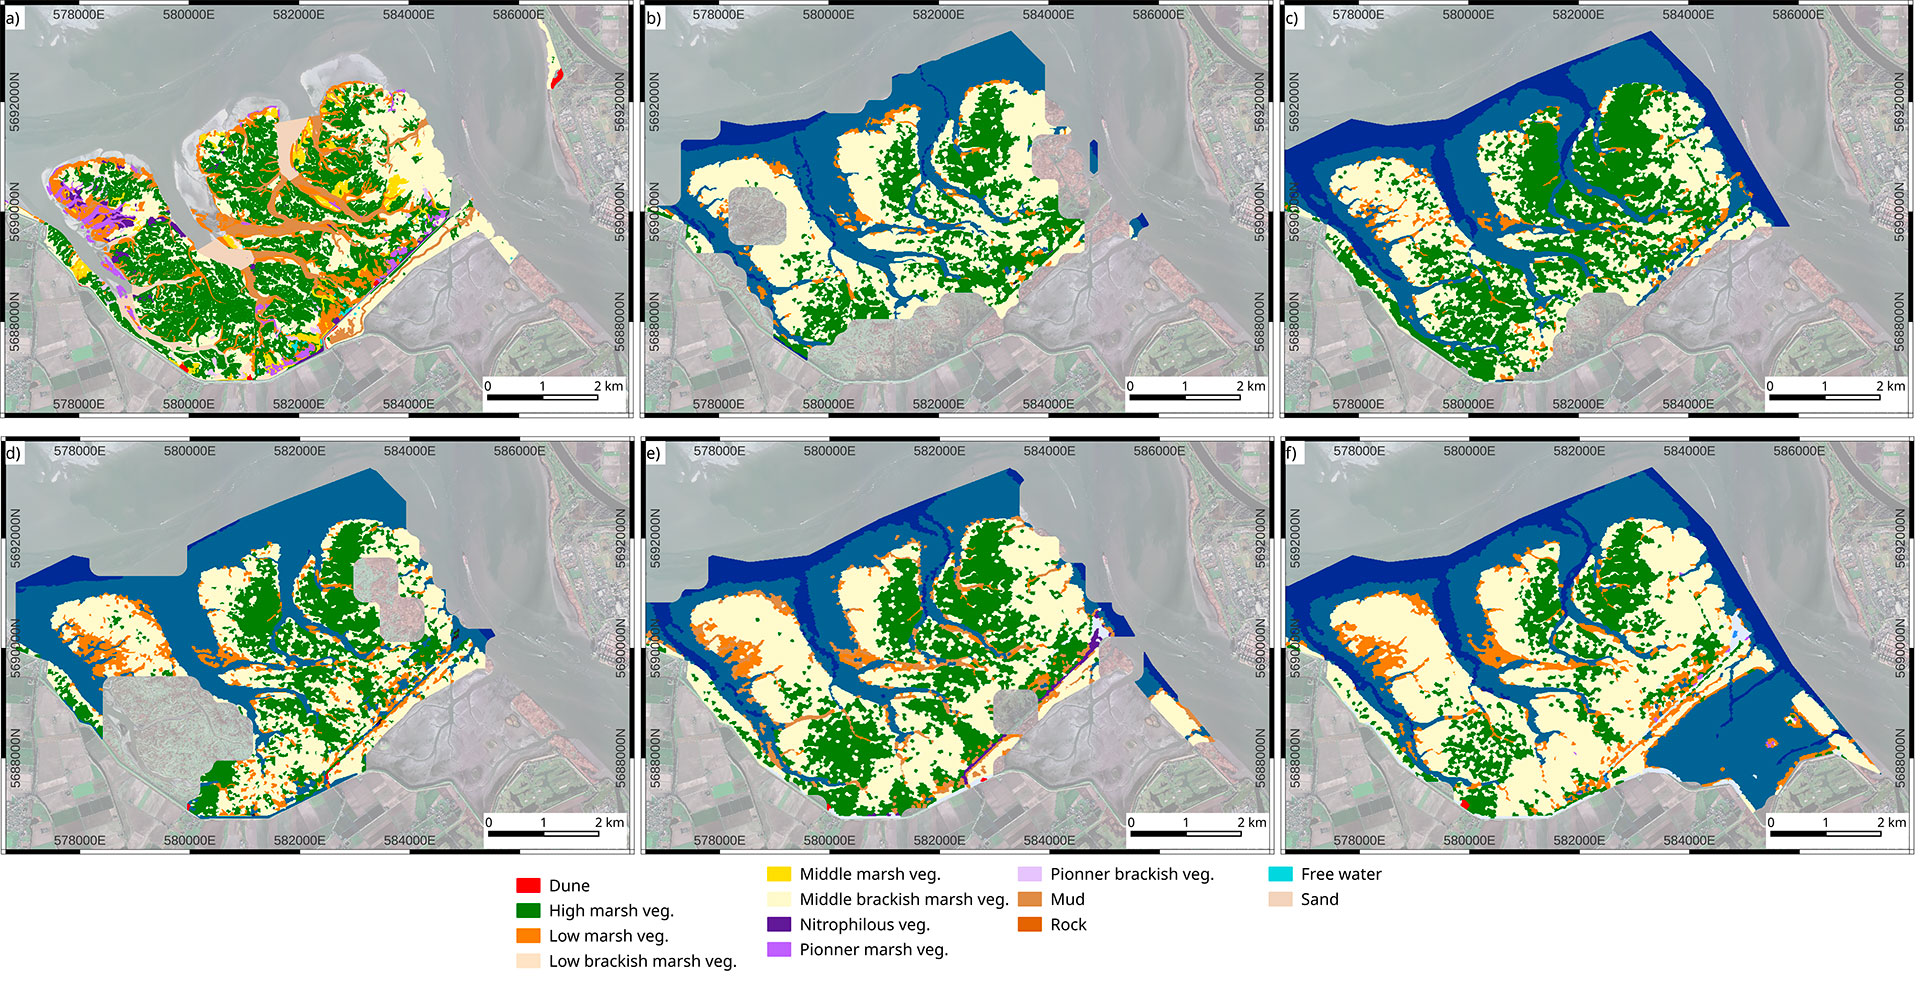
◀︎ a) Vegetation map of habitats and species from 2016 obtained through photo interpretation and field surveys. © Rijkswaterstaat. Maps b) to f) represent the unsupervised classification maps of the Saetfinghe and HPP habitats from 2019 to 2023. The majority classes obtained by automatic classification are associated with habitats surveyed during the 2016 campaign (a). © Cerema |
In addition, with satellite data archives now available (since ~2016 for Sentinel, ~2000 for MODIS, and the 1990s for Landsat), historical studies have been undertaken to assess the past and future impact of climate change on wetlands.
The methodology developed during the project was also applied to two other coastal wetlands in northwestern Europe: “The Wash” and the Freiston polder (United Kingdom) as well as the Bay of Mont-Saint-Michel and the Ploubalay polder (France). Both share the same oceanic climate (cool-warm summers, cold winters, often overcast skies) as our study sites. The renaturation of these sites, some of which are more or less old, has made it possible to estimate the duration of complete renaturation of the former polders studied in the EO4Wetlands project.
Results – Final product(s)
EO4Wetlands has developed an open-access digital twin that merges all satellite and in situ data into a scalable interface. Combining cloud infrastructure, high-performance 2D and 3D/4D visualization, and rich datasets, it allows users to explore changes in vegetation and soil moisture content over time and space. Using these key indicators, users can interactively analyze the environmental dynamics of study sites, such as the correlations between tides, precipitation, and soil dynamics.
The project has also published a website detailing its history, challenges, and methodology, as well as a link to download the digital twin.
👉 The development of the digital twin, by Geomatys, is based on a mapping server and a data lake hosted on a Kubernetes cluster, complemented by a 3D/4D visualization application developed under Unreal Engine. Developed for Linux and Windows, the application offers excellent visual quality and scalability. It can be downloaded free of charge at this link: https://files.geomatys.com/s/4aRCpBPyN2wCZRY.
👉 The data lake integrates global datasets (GEBCO, EMODnet) as well as local data (DTM, LiDAR) provided as part of the project, transformed into a quantified 3D mesh. It also incorporates satellite images via OGC protocols (WMS/WMTS). The project-specific satellite layers include the Sentinel-1/2, Landsat 5/8/9 series and their indices (NDVI, RVI, etc.), as well as surface temperature products (MODIS, ASTER, ECOSTRESS), which can be viewed in flat projection or 3D graphics.
👉 A tool allows index values to be extracted along lines, polygons, or points over the desired period. LiDAR data is converted into a pyramidal 3D mesh to optimize rendering according to the zoom level. SoilVUE in situ probe readings (from January 1, 2024, to June 24, 2025) and geophysical electrical resistivity measurements provided by Cerema are also integrated. This makes it possible to view time profiles, filter by date, and search for indicators directly in the 3D/4D environment.
|
|
|
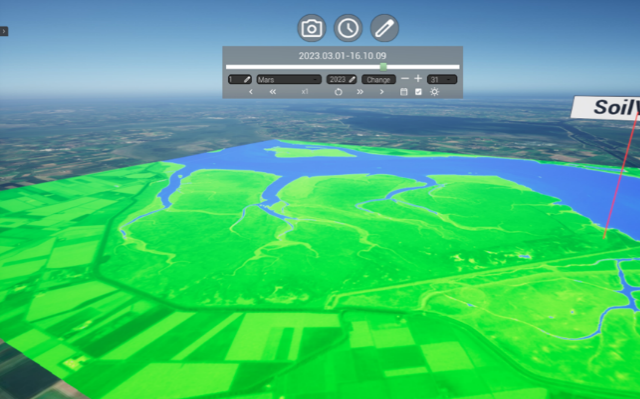
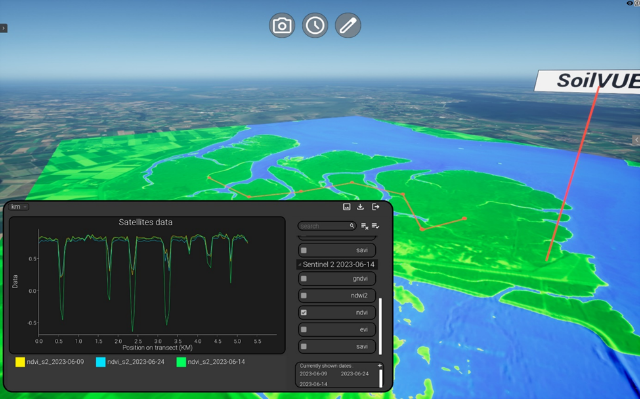
▲ a) Map representation of the NDVI index and b) Extraction of NDVI values according to selected dates along a transect (in red) drawn directly in the tool. The “SoilVUE” label locates the probe in the digital twin. © Geomatys
|
|
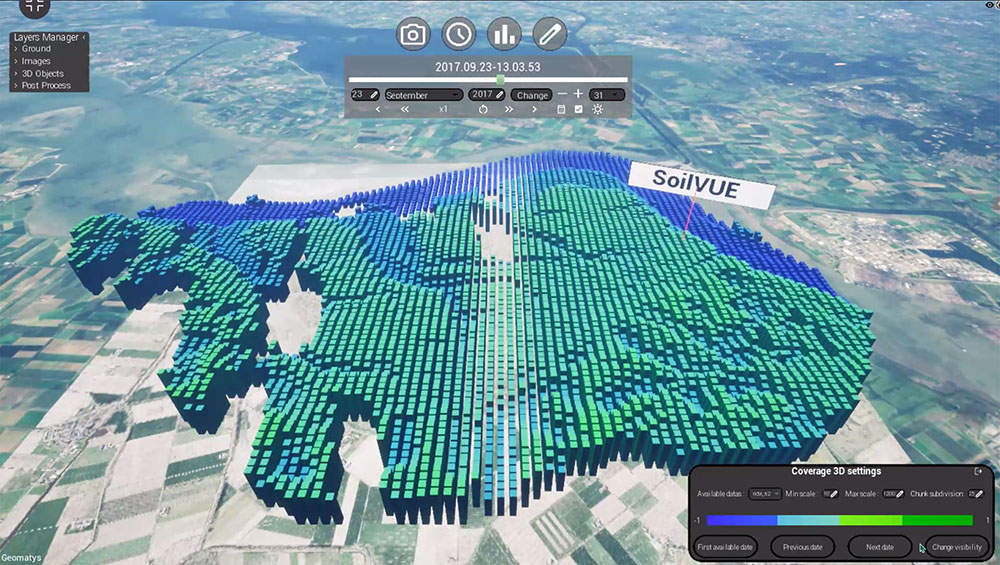
◀︎ Visualization of indices in the form of a 3D bar chart. © Geomatys |
👉 Based on unsupervised classification, these results can be reproduced anywhere with prior knowledge of the terrain to interpret the classification maps.
👉 The interpretation of the results is available in the article dated January 13, 2025.
➡️ Work and monitoring of the sites are continuing through the Interreg NWE BONSAI* project (Boosting Flood Resilience in Estuarine Systems Anticipating Shifting Climate Zones), which aims to increase the short- and long-term resilience of flood defense systems in the estuaries of the NWE region in the face of climate change. In this regard, the EO4Wetlands study sites are now BONSAI's reference sites.
Resources
For more information, see the following documents on the Cerema website:
- the final technical report in English
- the summary of the technical report in French
References
| EO4Wetlands on GEO Knowledge Hub, a long lasting digital repository created by the Group on Earth Observations: https://doi.org/10.60566/wkbrj-ngd08 |
- Gayet, G. et al. Guide de la méthode nationale d’évaluation des fonctions des zones humides–version 1.0. Onema, collection Guides et protocoles(2016).
- Bhatnagar, S. et al. Mapping vegetation communities inside wetlands using Sentinel-2 imagery in Ireland. International Journal of Applied Earth Observation and Geoinformation 88, 102083 (2020).
- Adam, E., Mutanga, O. & Rugege, D. Multispectral and hyperspectral remote sensing for identification and mapping of wetland vegetation: a review. Wetlands Ecol Manage 18, 281–296 (2010).
- Guo, M., Li, J., Sheng, C., Xu, J. & Wu, L. A Review of Wetland Remote Sensing. Sensors 17, 777 (2017).
- Whyte, A., Ferentinos, K. P. & Petropoulos, G. P. A new synergistic approach for monitoring wetlands using Sentinels -1 and 2 data with object-based machine learning algorithms. Environmental Modelling & Software 104, 40–54 (2018).
- Rapinel, S., Clément, B. & Hubert-Moy, L. Cartographie des zones humides par télédétection : approche multi-scalaire pour une planification environnementale. Cybergeo : European Journal of Geography (2019) doi:10.4000/cybergeo.31606.
- Sánchez-Espinosa, A. & Schröder, C. Land use and land cover mapping in wetlands one step closer to the ground: Sentinel-2 versus landsat 8. Journal of Environmental Management 247, 484–498 (2019).
- Hubert-Moy, L., Clément, B., Lennon, M., Houet, T. & Lefeuvre, E. Etude de zones humides de fond de vallées à partir d’images hyperspectrales CASI : Application à un bassin versant de la région de Pleine-Fougères (Bretagne, France). Photo-Interprétation. European Journal of Applied Remote Sensing 39, 33–43 (2003).
- Amani, M., Salehi, B., Mahdavi, S. & Brisco, B. Spectral analysis of wetlands using multi-source optical satellite imagery. ISPRS Journal of Photogrammetry and Remote Sensing 144, 119–136 (2018).
- Muro, J. et al. Land surface temperature trends as indicator of land use changes in wetlands. International Journal of Applied Earth Observation and Geoinformation 70, 62–71 (2018).
- Muro, J. et al. Short-Term Change Detection in Wetlands Using Sentinel-1 Time Series. Remote Sensing 8, 795 (2016).
- Antoine, R. et al. Electric potential anomaly induced by humid air convection within Piton de La Fournaise volcano, La Réunion Island. Geothermics65, 81–98 (2017).
- Antoine, R. et al. Thermal infrared image analysis of a quiescent cone on Piton de la Fournaise volcano: Evidence of convective air flow within an unconsolidated soil. Journal of Volcanology and Geothermal Research 183, 228–244 (2009).
- Lopez, T. et al. Subsurface Hydrology of the Lake Chad Basin from Convection Modelling and Observations. Surv Geophys 37, 471–502 (2016).
- Lopez, T. et al. Thermal anomalies on pit craters and sinuous rilles of Arsia Mons: Possible signatures of atmospheric gas circulation in the volcano. Journal of Geophysical Research: Planets 117, (2012).
Related projects
Project news
- 13/01/2025: EO4Wetlands, a digital twin for wetlands: presentation of the tool and interpretation of results
- 🎥 27/03/2025: Presentation of EO4Wetlands project and its progress at the 16th SCO France Quarterly Meeting "Coastal ranges: issues and solutions"
- 08/07/2024: EO4Wetlands, a further step towards satellite-guided depoldering monitoring
- 12/12/2023: EO4Wetlands, depoldering monitored by satellite: field visit and installation of a connected probe in the field