

FloodDAM-DT
 based on water cycle applications, particularly floods. An international effort via collaboration between CNES (France) and NASA (USA).")
Project completedThe SCO FloodDAM-Digital Twin project was finished on June 26th, 2024 with an "in live" end-to-end demonstration of the entire processing chain. CNES and JPL were able to demonstrate the capability to interface both systems and services and provide access to homogenized and standardized data on Garonne (France) and Ohio (USA)catchments. The demonstration was also based on different reanalysis and forecasting scenarios for flood impact assessment.
On-demand processing was handled by the development of an architecture compliant with digital twin specifications, while all the products generated during the demonstration for the Ohio and Garonne sites were integrated into the Hydroweb.next hydrological platform, which centralizes, displays and distributes these products with open access to users.
This project has also made available the open-source FloodML software dedicated to flood mapping from earth observation images.
Overview
Context
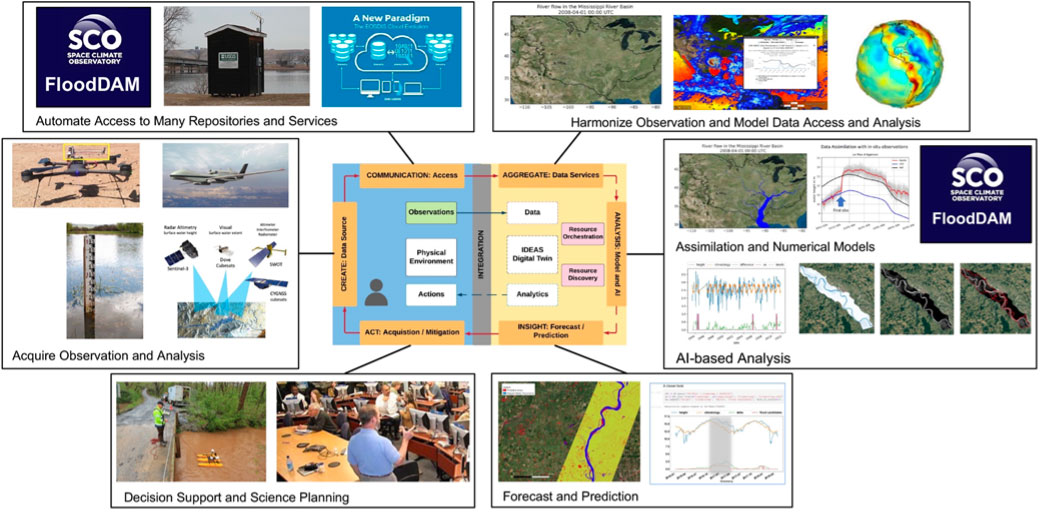
The SCO FloodDAM Digital Twin (DT) project led by CNES in collaboration with the IDEAS (Integrated Digital Earth Analysis System) project within the Advanced Information Systems Technology (AIST) program led by NASA has participated to devise an Earth System Digital Twin (ESDT) for local and global flood risk warning and mapping systems using space technologies.
This international collaboration has enabled to analyze and evaluate different scenarios to assess the risks and impact of flooding in the past and in the future :
- What now? A digital replica representing an integrated picture of the past (re-analysis) and current states of floods to improve understanding of overflow dynamics (land use planning, insurance, etc.)
- What next? Real-time flood forecasting showing how floods will evolve in the short term (civil protection, crisis management, etc.).
- What if? Flood impact assessment representing how floods, flows and water bodies could evolve under different climate scenarios.
▲ Figure 1. Diagram of the IDEAS and FloodDAM-DT digital twin for the water cycle and flooding. © NASA JPL
Objectives and methodology
The DT architecture for hydrology was able to dynamically connect hydrological/hydrodynamic models and continental water data (in situ, airborne, remote sensing (RS) data sources, e.g. radar and optical) from both agencies (NASA and CNES) to produce large-scale flood prediction for different scenarios emerging from DT.
This work involved a multi-agency effort to provide a scalable open-source platform focused on the distribution of hydrological products such as water resources and flood risks.
The FloodDAM-DT demonstrator is based on an ever-growing volume of heterogeneous Earth observation data, multi-physics and multi-scale fluid dynamics modelling tools enhanced with data assimilation algorithms, machine learning algorithms from the field of Artificial Intelligence (AI) and advanced analyses for data processing. The project has developed standardized and normalized interfaces of the French and American space agencies to facilitate the use of data, as well as the considerable computing resources available to the consortium.
The project used open-source software and data. The main processing blocks are:
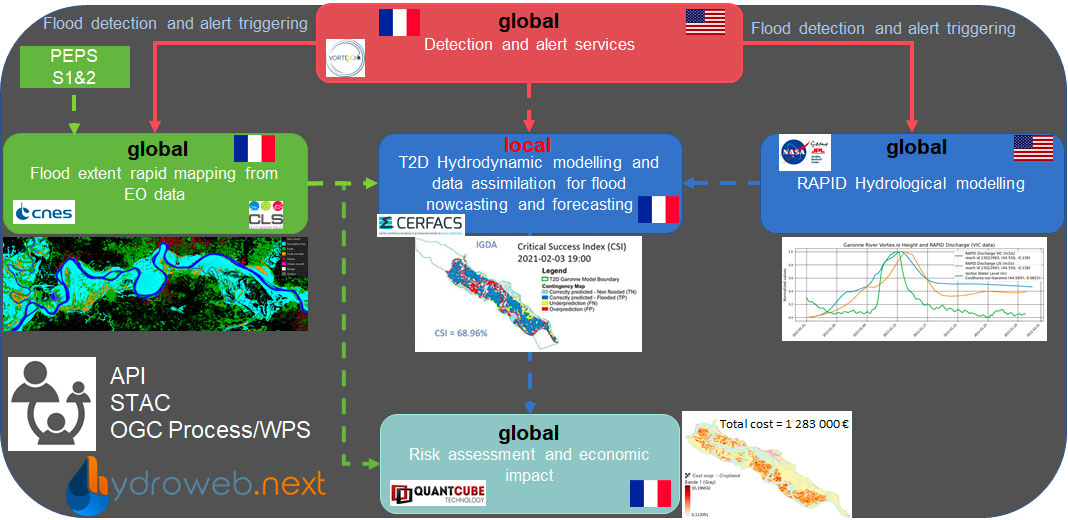
- flood alert and detection,
- lood extent rapid mapping, and monitoring of on-going flood events,
- short-term prediction of flood surfaces and free-surface elevation maps using high-fidelity hydrodynamic models over local areas, and
- real-time and post-event estimation of the financial risk associated with flooding.
▲ Figure 2. FloodDAM Digital Twin project pipeline © CNES
👉The products from each processing block of the FloodDAM-DT project, as well as the products from the JPL models, have been integrated into the national hydrological platform Hydroweb.next, which is open to all users.
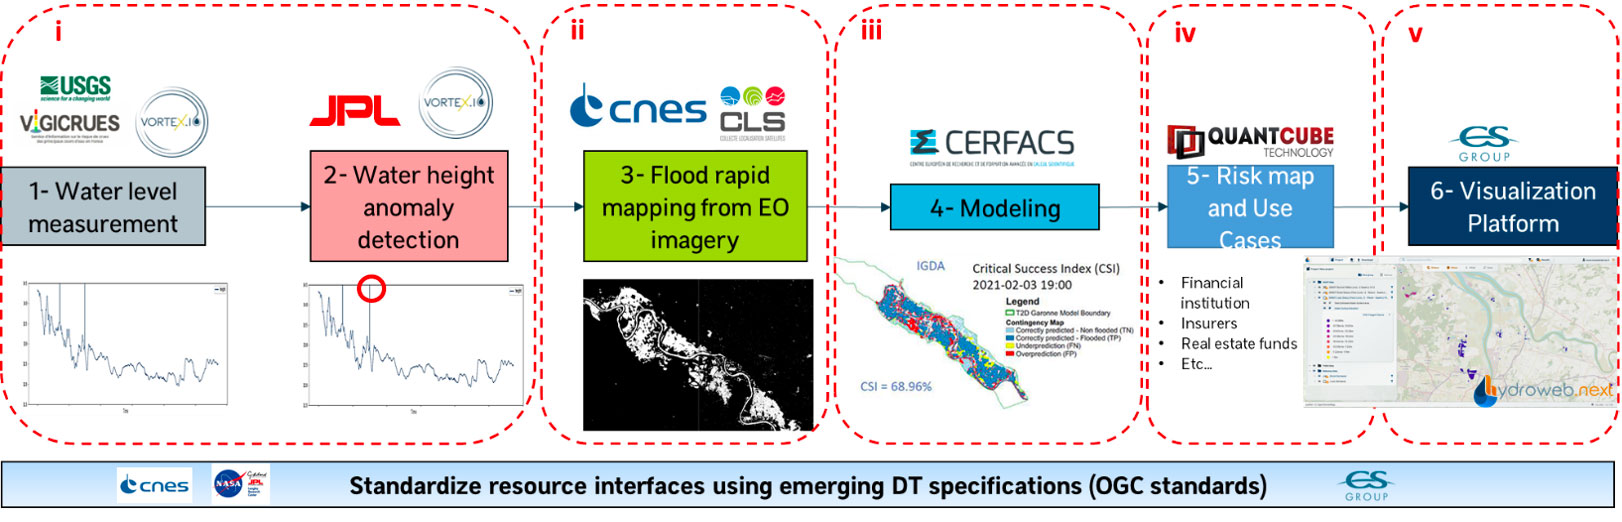
Interoperability
The interoperability of the chain was ensured by developing an architecture with various components implemented on the CNES side: on-demand processing server, FloodML algorithm, and particularly the hydroweb.next hydrological platform in charge of distributing and giving access hub for FloodDAM data.
|
▶︎ Figure 3. Activities of the various stakeholders and interfaces used to implement the FloodDAM scenario. |
|
✦ Standardized interfaces have been implemented using homogenized data. The following standards have been used: OGC API Processes, STAC API (The SpatioTemporal Asset Catalog API), OGC WMS (Web Map Service) and OGC WFS (Web Feature Service), S3 (Amazon Simple Storage Service), POSIX (Portable Operating System Interface), AMQP (Advanced Message Queuing Protocol) and Mail (POP, IMAP).
From a user point of view, the most relevant standards are the OGC API Processes (to launch processing execution), STAC API (for results retrieval), and OGC WMS/WFS for results dissemination to the hydroweb.Next platform.
✦ It should be noted that the on-demand processing service has been focused on the generation of flood mapping via the FloodML algorithm. On-demand processing handled requests and managed calls to the CNES cluster computing resources, where the processing was executed: retrieving necessary data, preparation, execution of FloodML processing via the OGC API Process interface, and making the results available on Hydroweb.next to ensure their dissemination and availability to other services. These various processes were linked together by setting up the FloodDAM Jupyter Notebook* for the duration of the project, which made it possible to retrieve simulation results from JPL's RAPID hydrological model via the in-situ OGC API.
✦ The FloodDAM Jupyter Notebook* developed, tested and validated during the project focuses on the on-demand processing and visualization results of the rapid flood mapping brick from the FloodML algorithm and RAPID river flow outputs on these events for different digital twin scenarios.
*Web application that stores lines of Python code and the results of their execution.
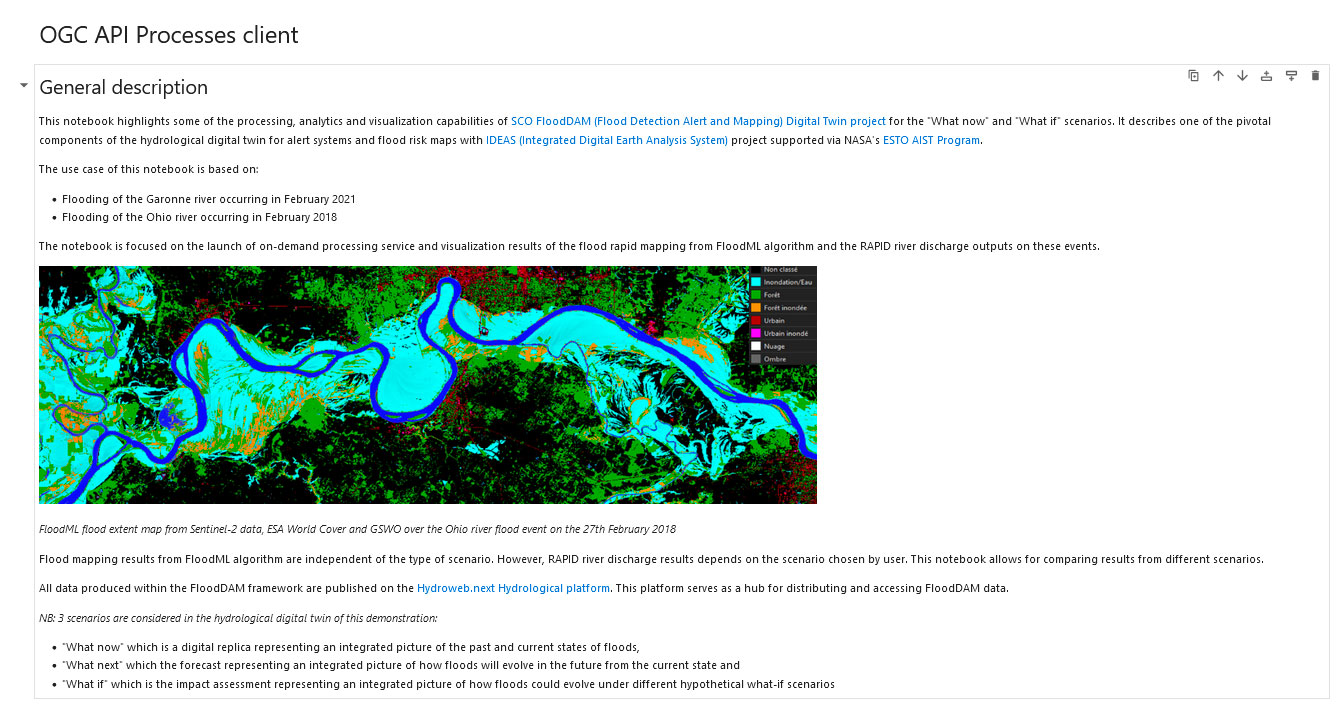
▲ Figure 4: FloodDAM Jupyter Notebook
Innovative contributions and logical links
Compared to its precursor FloodDAM, the DT version offers the following advantages:
-
Automation of each processing block and an end-to-end demonstration of the complete chain (flood detection and warning, rapid flood mapping, hydrodynamic modeling, mapping and estimation of socio-economic impacts) on selected catchments (Garonne in France, Ohio in the USA).
-
Integration of products from the digital twin into the hydrological French Hydroweb.next platform (HYSOPE-II project) which centralizes and distributes all water-related open data and integrate products requested by users.
-
Interoperability with other services and systems through the Hydroweb.next platform and API, using standardized interfaces and homogenized data formats.
-
Multi-scale modeling chaining with NASA/JPL RAPID large-scale hydrology and Telemac-2D river hydrodynamics models with data assimilation (CERFACS).
-
Use of new satellite data for rapid flood mapping, flood extent forecasting and free-surface elevation maps via data assimilation into hydrodynamic models.
-
A high-resolution, hydro-compatible digital terrain model (DTM) based on Pleiades satellite stereoscopic acquisitions.
-
Estimating and assessing the socio-economic impact of flooding
-
Moving towards an earth digital twin focused on hydrology: a digital replica of the state of watersheds to understand hydrology and flooding, at several spatio-temporal scales, and making the FloodDAM chain transposable to other sites of interest in terms of risk, safety and financial stakes.
Agenda :
- 21 June 2022: 1st Copil (Steering Committee)
- 16 November 2023: 2nd Copil
- December 2023: pre-demonstration of IDEAS and FloodDAM-DT services
- January 18, 2024: pre-demonstration based on the ingestion of data from the digital twin on the Garonne slope in the Hydroweb.next platform.
- June 26, 2024: final meeting and end-to-end demonstration on different scenarios in France and the United States based on the ability to interface the two systems and services and provide access to homogenized and standardized data on the Garonne and Ohio watersheds.
Application site(s)
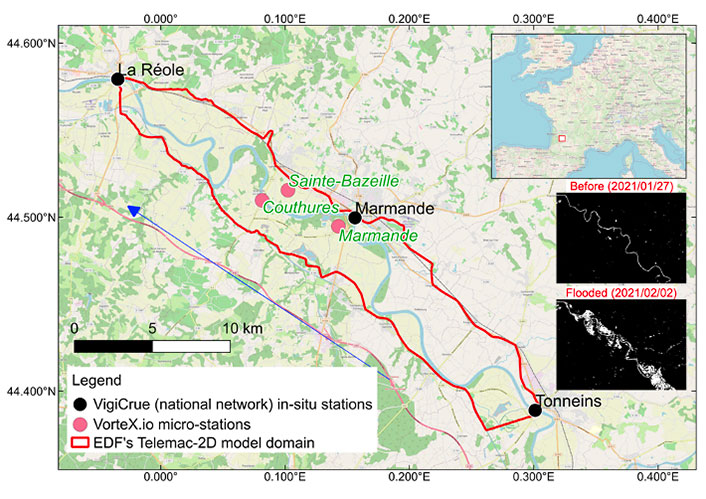
▲ Figure 5. Garonne Marmandaise watershed (France) delineated by the red zone with an illustration of flood extent maps from Sentinel-1 before and after the 2021 flood event. © CERFACS |
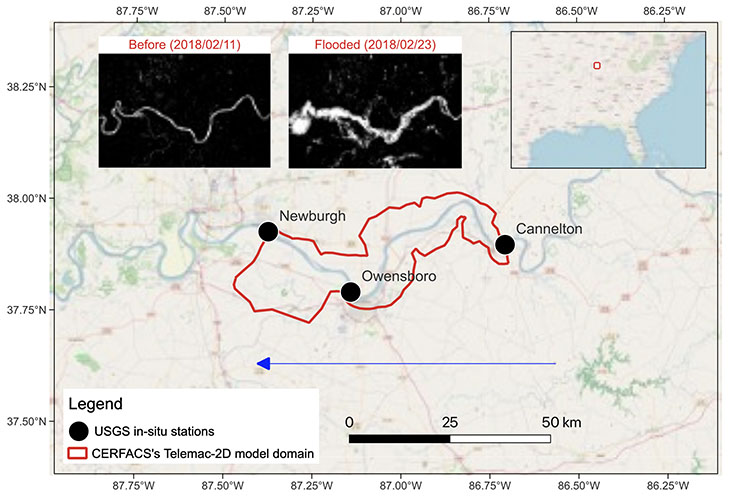
▲ Figure 6. Ohio River watershed (USA) delineated by the red zone with an illustration of inundation extent maps from Sentinel-1 before and after the flood event in February 2018. © CERFACS |
Data
Satellite
- High-resolution (HR) data with global coverage for all test sites:
- Optical (Sentinel-2, Landsat-8/9)
- Radar (Sentinel-1)
- Altimtry (Sentinel-6, Sentinel-3, SWOT)
-
Very high resolution (VHR) data on demand:
-
Derivative products
- Spatial data portals : PEPS , IR DataTerra (THEIA, AERIS, ODATIS, FORM@TER), etc.
- Météo France data and models on the AERIS portal
- Copernicus Services: C3S (Climate Change), Emergency Management Service (EMS) avec les service Rapid Mapping Service (RMS), Risk and Recovery Mapping (RRM) et European Flood Awareness System (EFAS), Atmosphere Monitoring Service (CAMS), Land Monitoring Service (CLMS)
- DTM/DNR data: Copernicus DTM 30m, MERIT DTM 90m, IGN LIDAR (RGE Alti)
Other
- Data from in-situ stations in France by the VigiCrues network and in the United States by the USGS network
- Data from in situ and drone stations supplied by vorteX.io
- Numerous territorial data sets: land use maps (ESA-WorldCover), population maps and densities, graphical parcel register (RPG), etc.
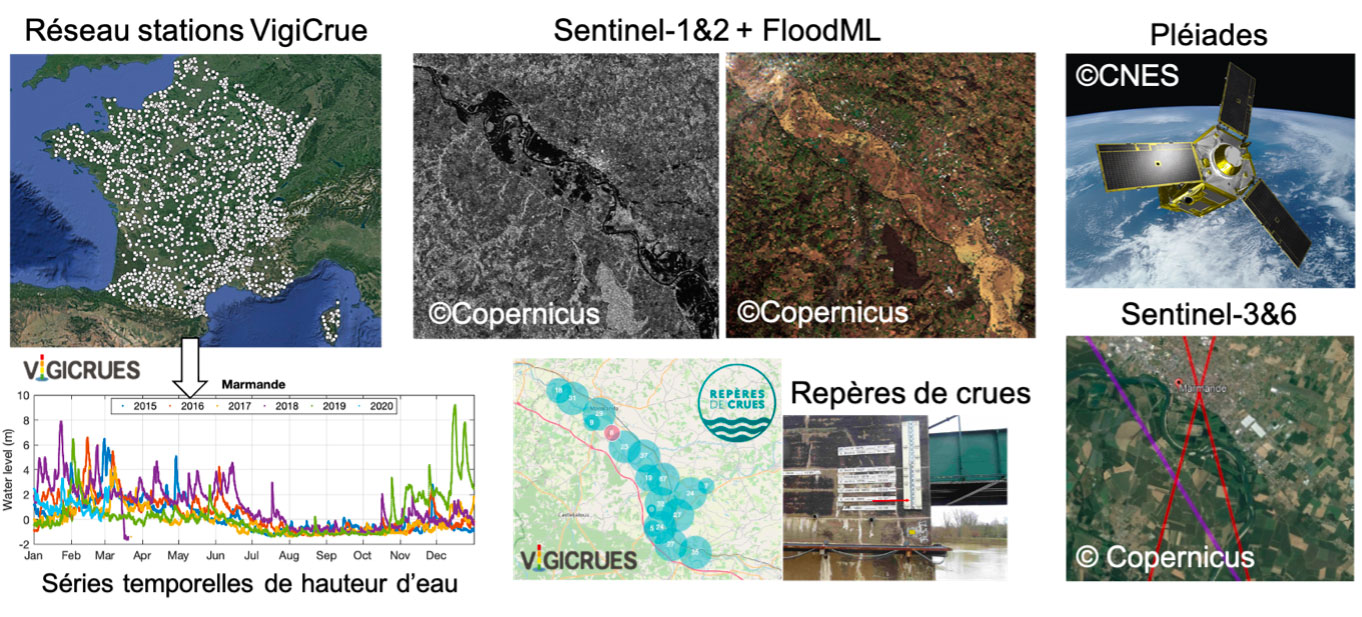
▲ Figure 7. Overview of data used in the SCO FloodDAM-DT project.
Results – Final products
This 24-month project finished with an end-to-end demonstration of the complete processing chain, showing its multi-scale aspect on 2 selected sites: the Garonne Marmandaise catchment in France and the Ohio catchment in the United States. The demonstration provided access to in-situ and satellite data, flood extent mapping from AI data processing, CFD modeling output and flood-related socio-economic risk assessment.
Alert service
|
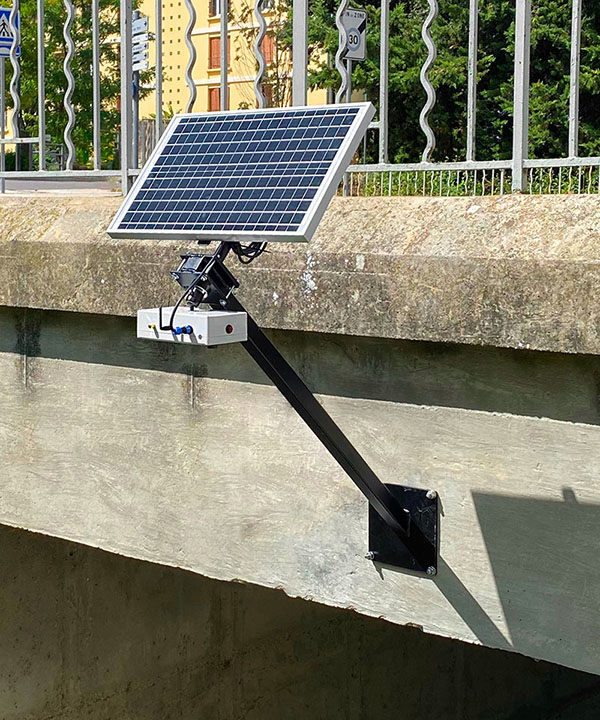
Floods are monitored by national in-situ networks such as VigiCrues in France and USGS in the United States. The FloodDAM-DT project completes these measurements with new vorteX.io in-situ stations in order to improve spatial resolution (particularly in flood plains and tributaries), diversify sensors types and consequently improve the quality of flood map predictions from hydrodynamic modelling with data assimilation. In addition to these measurements, vorteX.io can carry out a drone overflight equipped, like the micro-stations, with a LIDAR instrument that measures water height with centimetric precision, a GNSS receiver and an 8Mpx camera that provides flow velocity information and ortho-photos.
|
▲ VorteX-io micro-station © vorteX-io |
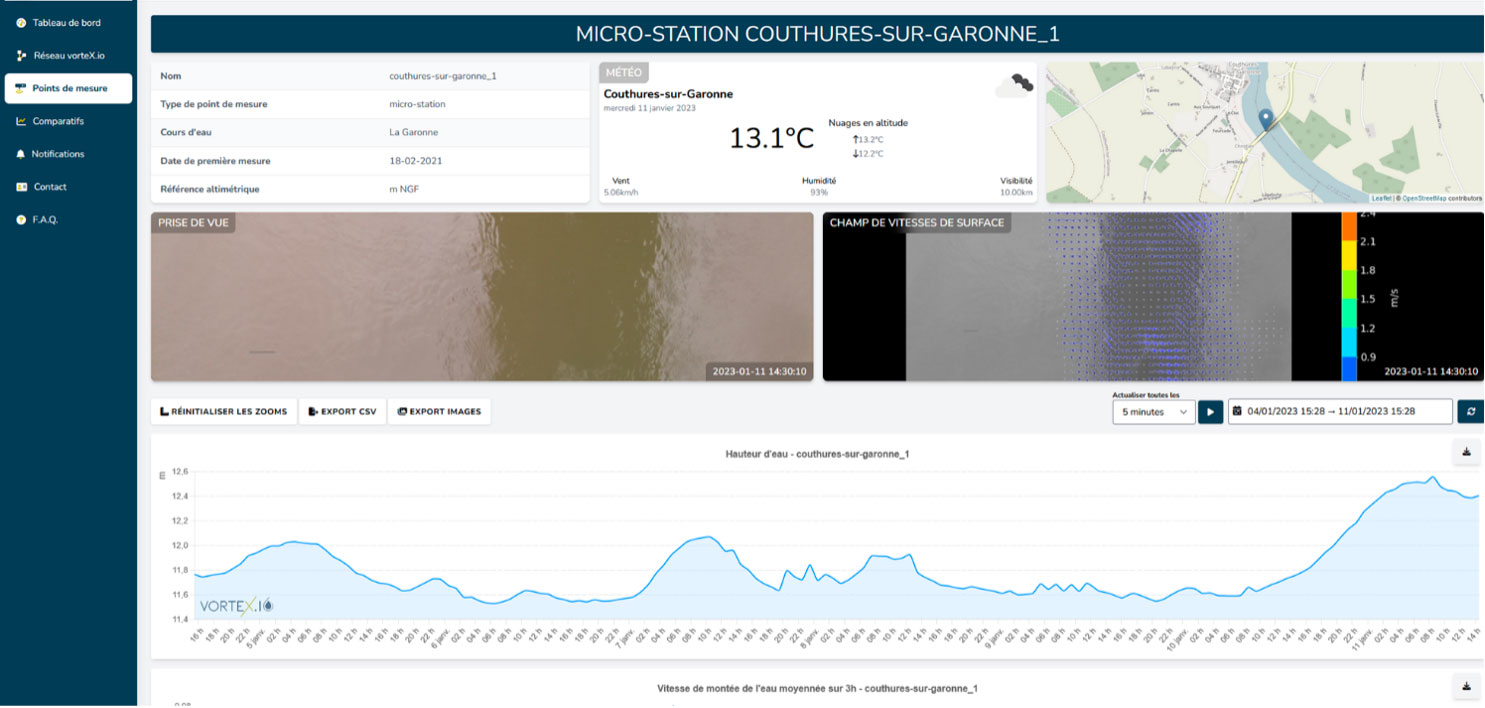
▲ Figure 8. The Maelstrom platform developed by vorteX.io provides a flood detection and warning service. The platform also provides real-time measurements of water height, surface speed and images from in-situ stations, as well as precise GNSS positioning. In this example, the vorteX.io in-situ station in Couthures-sur-Garonne is being monitored. © vorteX.io
Flood extent mapping
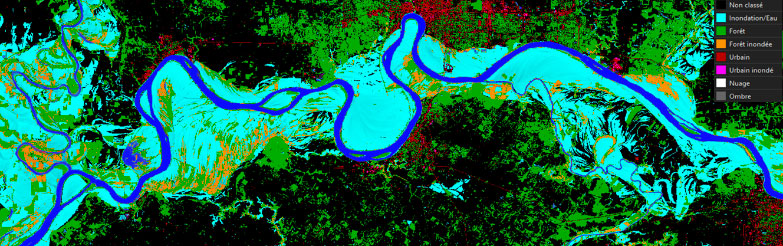
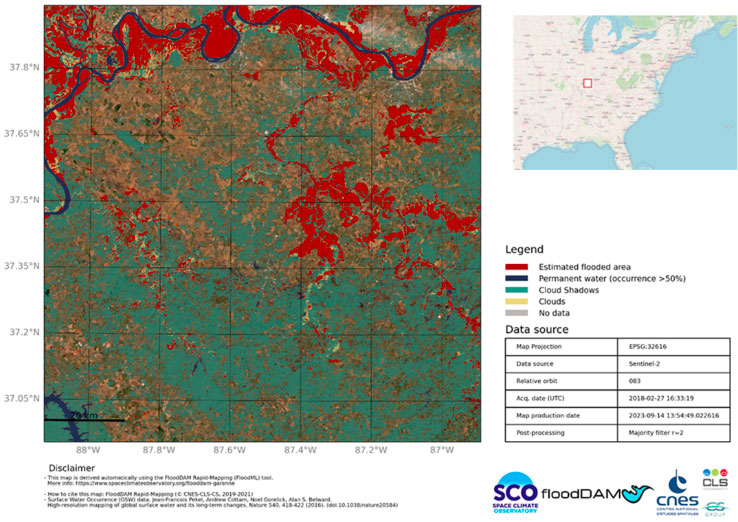
The FloodDAM project delivered impressive results at global scale, covering an area of 10,000 km² in less than 15 minutes using the CNES open source Flood-ML algorithm (https://github.com/CNES/floodml) based on random forest change detection trained on past events from the Copernicus EMSR.
👉 FloodDAM-DT has improved this algorithm by adding an ESA WorldCover land-use map based on 7 classes to optimize discrimination of flooded areas on which the satellite presents ambiguities.
👉 Flood extent maps can be generated on a global scale, at satellite passes times as shown in figures 9 and 10. At these same times, more accurate flood maps are also available thanks to hydrodynamic modeling with the assimilation of in-situ and remote sensing data, over areas for which models have been developed.
|
▶︎ FloodML automatic report
▲ Figure 9. Production of rapid flood mapping using FloodML for a flood event on the Ohio River (US) on 2018-02-27 using Sentinel-1 radar images and the ESA World Cover land cover map. © CNES-CLS |
▲ Figure 10. Systematic reporting of rapid flood mapping using FloodML on the 2018-02-27 Ohio flood event using Sentinel-1 radar imagery. © CNES-CLS |
Re-analysis and short-term forecasting of floods
Modelling and data assimilation tools can also be used to provide maps of flood extent between satellite passes, as well as forecasts beyond the present time. It should be noted, however, that the maximum forecast timeframe is highly dependent on the size and dynamics of the basin. The data assimilation algorithm combines in-situ water level data, Sentinel-1&2 flood extent maps, Sentinel-6 and SWOT altimetry data, as well as UAV acquisition data and in-situ surface velocity measurements. Finally, on demonstration catchments, data-assimilated hydrodynamic models have been used to provide free-surface elevation maps over the entire simulated domain, at very fine time steps, in the past, for re-analysis, as well as for forecasting beyond the present.
👉 The Telemac2D hydrodynamic model used for the Garonne marmandaise was made available by EDF under a research agreement with CERFACS. The Telemac-2D model for the Ohio selected area was developed at CERFACS, in collaboration with NOAA and Ohio State University.
👉 The reanalysis results are illustrated in Figure 11 for the Garonne Marmandaise, for the January-February 2021 flood event. They show that the assimilation of in-situ data and remote sensing data reduces the quadratic deviation from water level observations at Vigicrue stations (Fig. 11b) and improves agreement with the flooded area observed by Sentinel1.
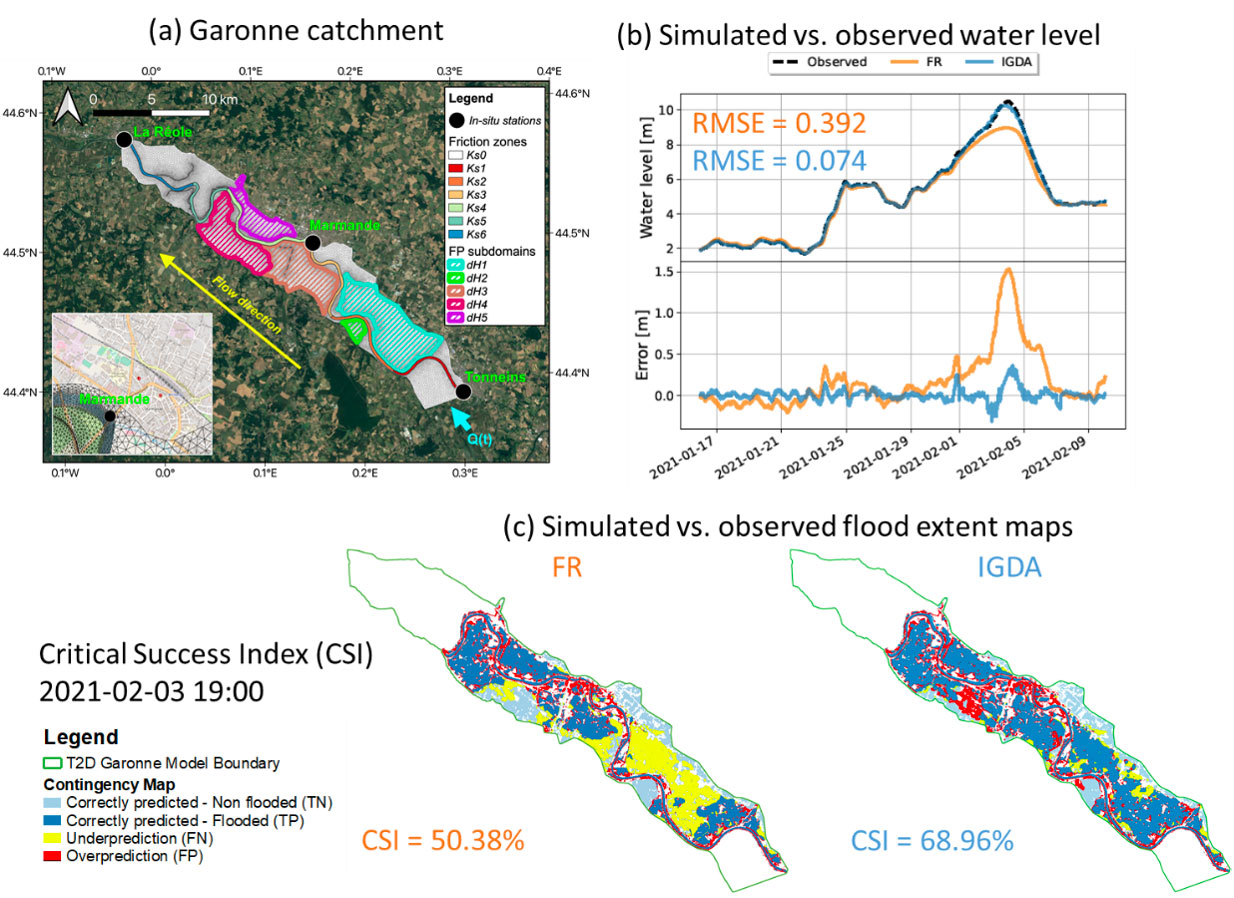
▲ Figure 11. Water level map of the Garonne watershed for the 2021 flood. (a) Garonne watershed over a length of 50 km. (b) Comparison of CFD modeling with observations: the black dotted line represents the observed water level, the orange line represents the open-loop Telemac-2D simulation and the blue line represents the Telemac-2D simulation using data assimilation. (c) Flood extent contingency map representing flood extent prediction on the left by FR without data assimilation, and on the right by IGDA with satellite and in-situ data assimilation, for 03/02/2021. Correctly predicted flooded areas are shown in dark blue, correctly predicted non-flooded areas in light blue, under-predicted areas in yellow and over-predicted areas in red. © CERFACS
👉 Short-term flood forecasts in the "what if" scenario can be seen in Figure 12 below for both study sites.
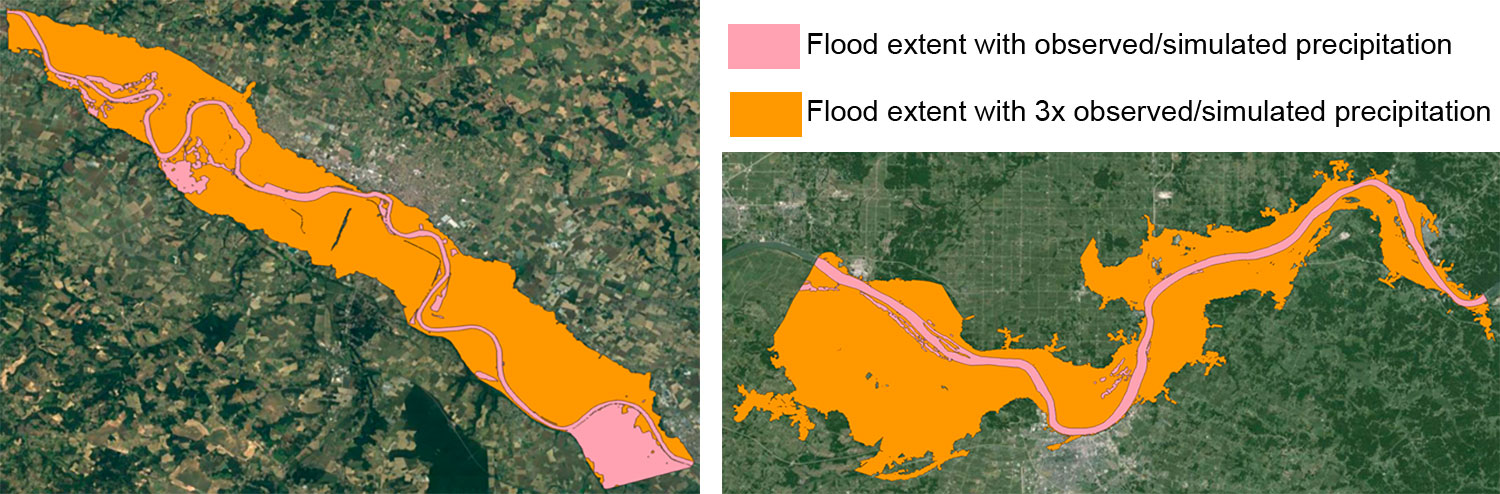
▲ Figure 12. Flood extent maps in a hypothetical "what if" scenario where observed or simulated precipitation has been increased, left on the Garonne Marmandaise watershed, right on the Ohio River. © CERFACS
Socio-economic risk mapping
For areas with a high economic impact, a real-time product on the estimation of financial risks linked to flooding has been generated for different types of players, such as industry, agriculture and land use planning.
Indeed, by combining the outputs either from the water elevation modeling maps or from Floom flood extent maps with a database of physical assets and social media geolocation data, textual and structured data (prices of agricultural commodities, fuel, real-time inflation calculations for users, etc.) and using methods that link water height and flood duration to physical risk, the QuantCube methodology provides an estimation of the flood financial risk directly at the level of a site and more broadly at the level of a company.
👉 👉Directly accessible on the QuantCube environmental intelligence platform, the flood risk impact map and financial risk assessment can then be translated into a score.
|
|
◀︎ Figure 13. Map of costs in euros per pixel for different types of land use in the Garonne Marmandaise for the 02/02/2021 flood. © QuantCube Technology |
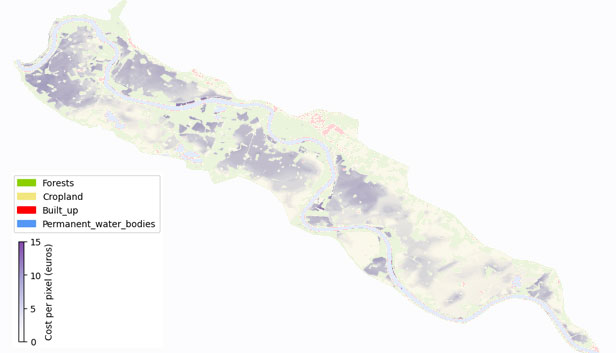
As part of the demonstration, the FloodDAM-DT project provides access to the physical risk maps and the financial impact of the flood risk assessed on the 2 selected sites, Marmande and Ohio, via the Hydroweb.next platform.
Hydroweb.next: Distribution and visualization platform for hydrological products
The Hydroweb.next platform has been used to integrate all the output from FloodDAM processing chain at selected sites for the demonstration. The Hydroweb.next platform is open to all users and enables exchanges with other platforms and services, thanks to the use of standardized interfaces and homogenized data via the interface or API.
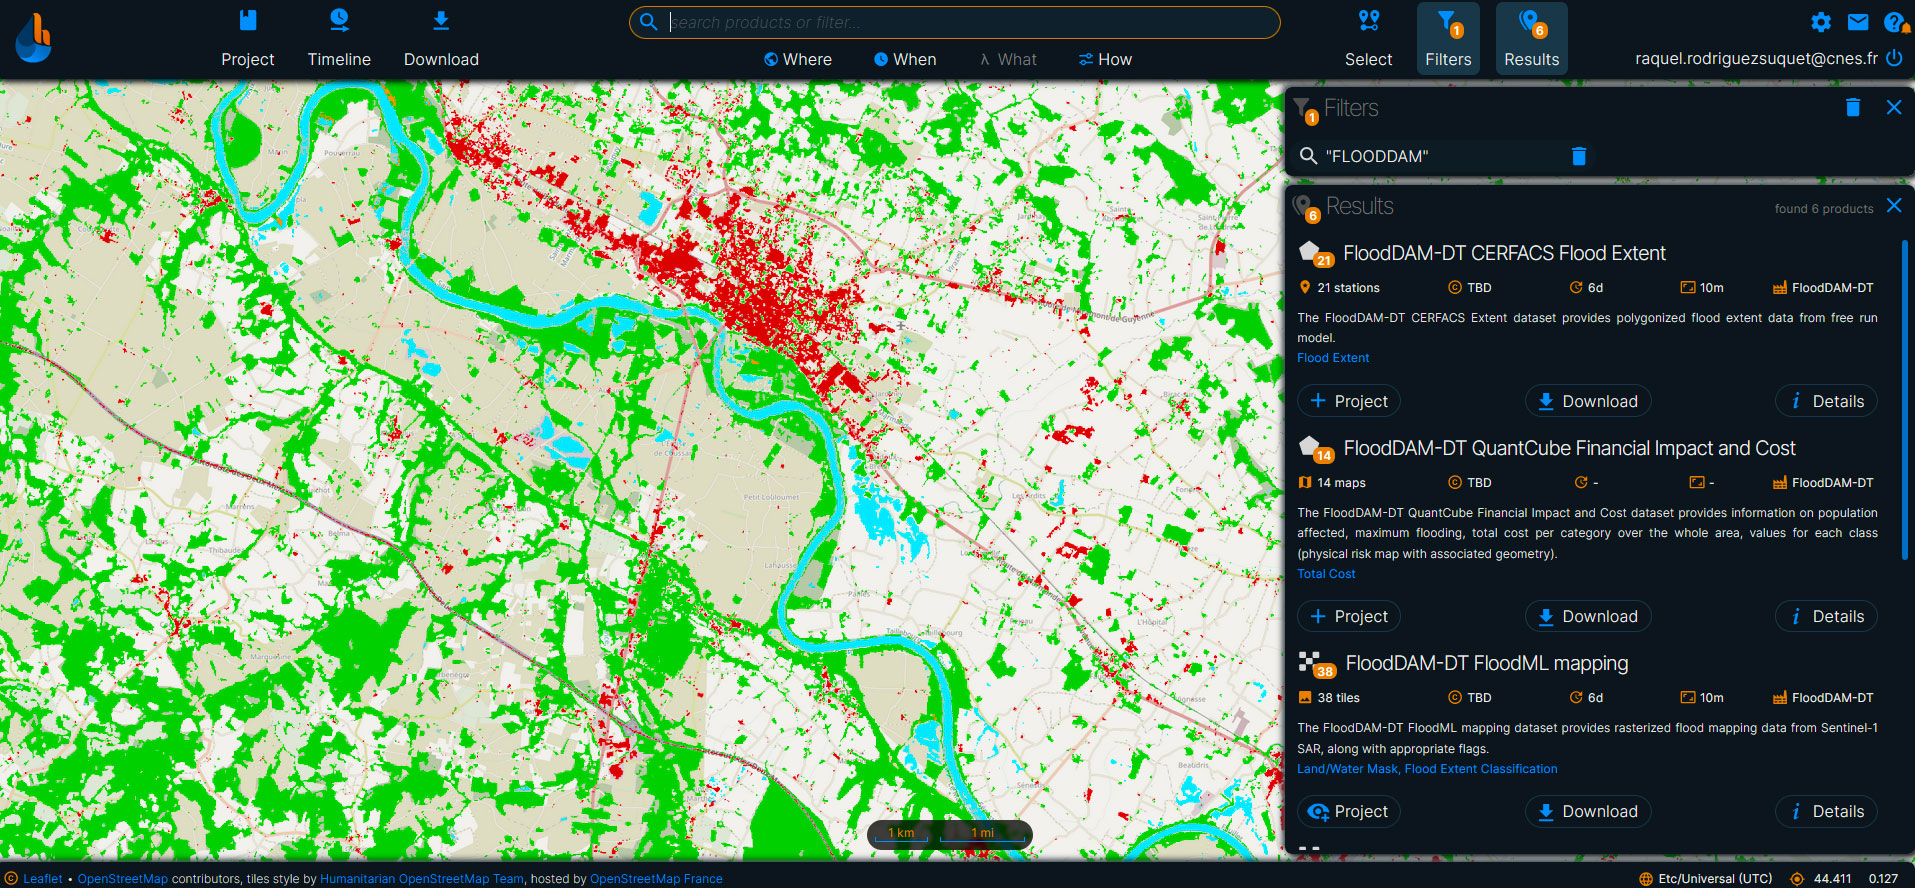
▲ Figure 14. Hydroweb.next hydrological platform showing, on the right, the various hydrological products generated by the project and accessible via the platform and, on the left, a flood map from FloodML with the ESA World Cover land cover map. © CNES
👉Go to Hydroweb.next (enter FloodDAM in search box)
Outlook
In terms of very short-term operability, the project will develop a web interface focused on-demand processing of the rapid flood mapping processing block (FloodML).
In terms of scientific prospects, the project aims to improve the rapid flood mapping section (FloodML) with the integration of new optical/radar sensors at different radar/optical resolutions (Capella, IcEye, Umbra, CosmoSkymed, NiSAR Planet, etc.) as well as the integration of auxiliary meteorological data (humidity, precipitation, temperature).
Finally, an ongoing work on a very high-resolution hydro-compatible digital terrain model (DTM) generation from Pleiades stereoscopic acquisitions, which will enable us to update the topography of the hydrodynamic model regularly.
References
| FloodDAM on GEO Knowledge Hub, a long lasting digital repository created by the Group on Earth Observations: https://doi.org/10.60566/a2gv9-95910 |
- Nguyen, T. H., Ricci, S., Fatras, C., Piacentini, A., Delmotte, A., Lavergne, E., & Kettig, P. (2022). Improvement of Flood Extent Representation with Remote Sensing Data and Data Assimilation. IEEE Transactions on Geoscience and Remote Sensing, 60, 1-22, 2022, Art no. 4206022.
https://doi.org/10.1109/TGRS.2022.3147429 - Nguyen, T. H., Ricci, S., Piacentini, A., Fatras, C., Kettig, P., Blanchet, G., Peña Luque, S., & Baillarin, S. (2022). Dual state-parameter assimilation of SAR-derived wet surface ratio for improving fluvial flood reanalysis. Water Resources Research, 58, e2022WR033155.
https://doi.org/10.1029/2022WR033155 - Nguyen, T. H., Ricci, S., Piacentini, A., Simon, E., Suquet, R. R., & Luque, S. P. (2024). Gaussian Anamorphosis for Ensemble Kalman Filter Analysis of SAR-Derived Wet Surface Ratio Observations, IEEE Transactions on Geoscience and Remote Sensing, 62 (1-21).
https://doi.org/10.1109/TGRS.2023.3338296 - Nguyen, T.H., Piacentini A., Ricci, S., Cassan, L., Munier S., Bonassies Q., Rodriguez Suquet R. Remote Sensing Data Assimilation with a Chained Hydrologic-hydraulic Model for Flood Forecasting, arXiv:2405.00567v1, 2024.
https://doi.org/10.48550/arXiv.2405.00567 - Nguyen T.H., Ricci S., Piacentini A., Simon E., Rodriguez Suquet R., Peña Luque S. Dealing with Non-Gaussianity of SAR-Derived Wet Surface Ratio for Flood Extent Representation Improvement, IGARSS 2023.
https://doi.org/10.1109/IGARSS52108.2023.10282744 - Ricci S., Nguyen T.H., Le Gac S., Boy F., Piacentini A., Rodriquez Suquet R, Peña Luque S. Comparisons and water level analyses using Sentinel-6MF satellite altimetry data with 1D Mascaret and 2D Telemac models, EGU-6513, 2023
Related projects
- SCO FloodDAM project
- IDEAS (Integrated Digital Earth Analysis System) project under the ESTO (Earth Science Technology Office) /AIST (Advance information system technology) programme
- Hydroweb.next hydrological platform
- Maelstrom platform from vorteX.io
- "2024 IEEE GRSS Data Fusion Contest" based on rapid flood mapping from satellite data.
- CEOS Working Group Flood Disasters
Project news
- 10/12/2024: FloodDAM-DT completes its flood risk digital twin prototype
- 07/11/2024: presentation of the FloodDAM-DT project at the United Nations Digital Twin Workshop.
- 03/10/2024: FloodDAM-DT project presentation at CEOS Working Group Disasters in Budapest
- 11/07/2024: FloodDAM-DT project presentation at IGARSS 2024
- 16/10/2023: Presentation of the FloodDam-DT project and its progress at the 10th SCO France Quarterly Meeting "Water: between stress and risk".