

SCOFrance
PartnersTHALES Services Numériques, World from Space, CNES
Useful linksMonthly map
KeywordsAir pollution, air quality, PM10, emissions inventories
FLORIA: the map of PM10 pollutants in Europe is online
|
With concentrations varying depending on location, airborne particles (known as PM for Particulate Matter) or aerosols pose a major threat to our health and contribute to the feedback loop associated with climate change (see box). Classified according to size, the FLORIA project monitors PM10, i.e. all particles with a diameter of less than 10 µm (microns), which is 6 to 8 times smaller than the thickness of a hair. Pollen, sand, dust from construction sites, landfills, agriculture, fires, wood heating, road traffic... These particles, emitted by both human activities and nature, are carried by the wind far beyond their source of emission. |
PM feedback loop
|
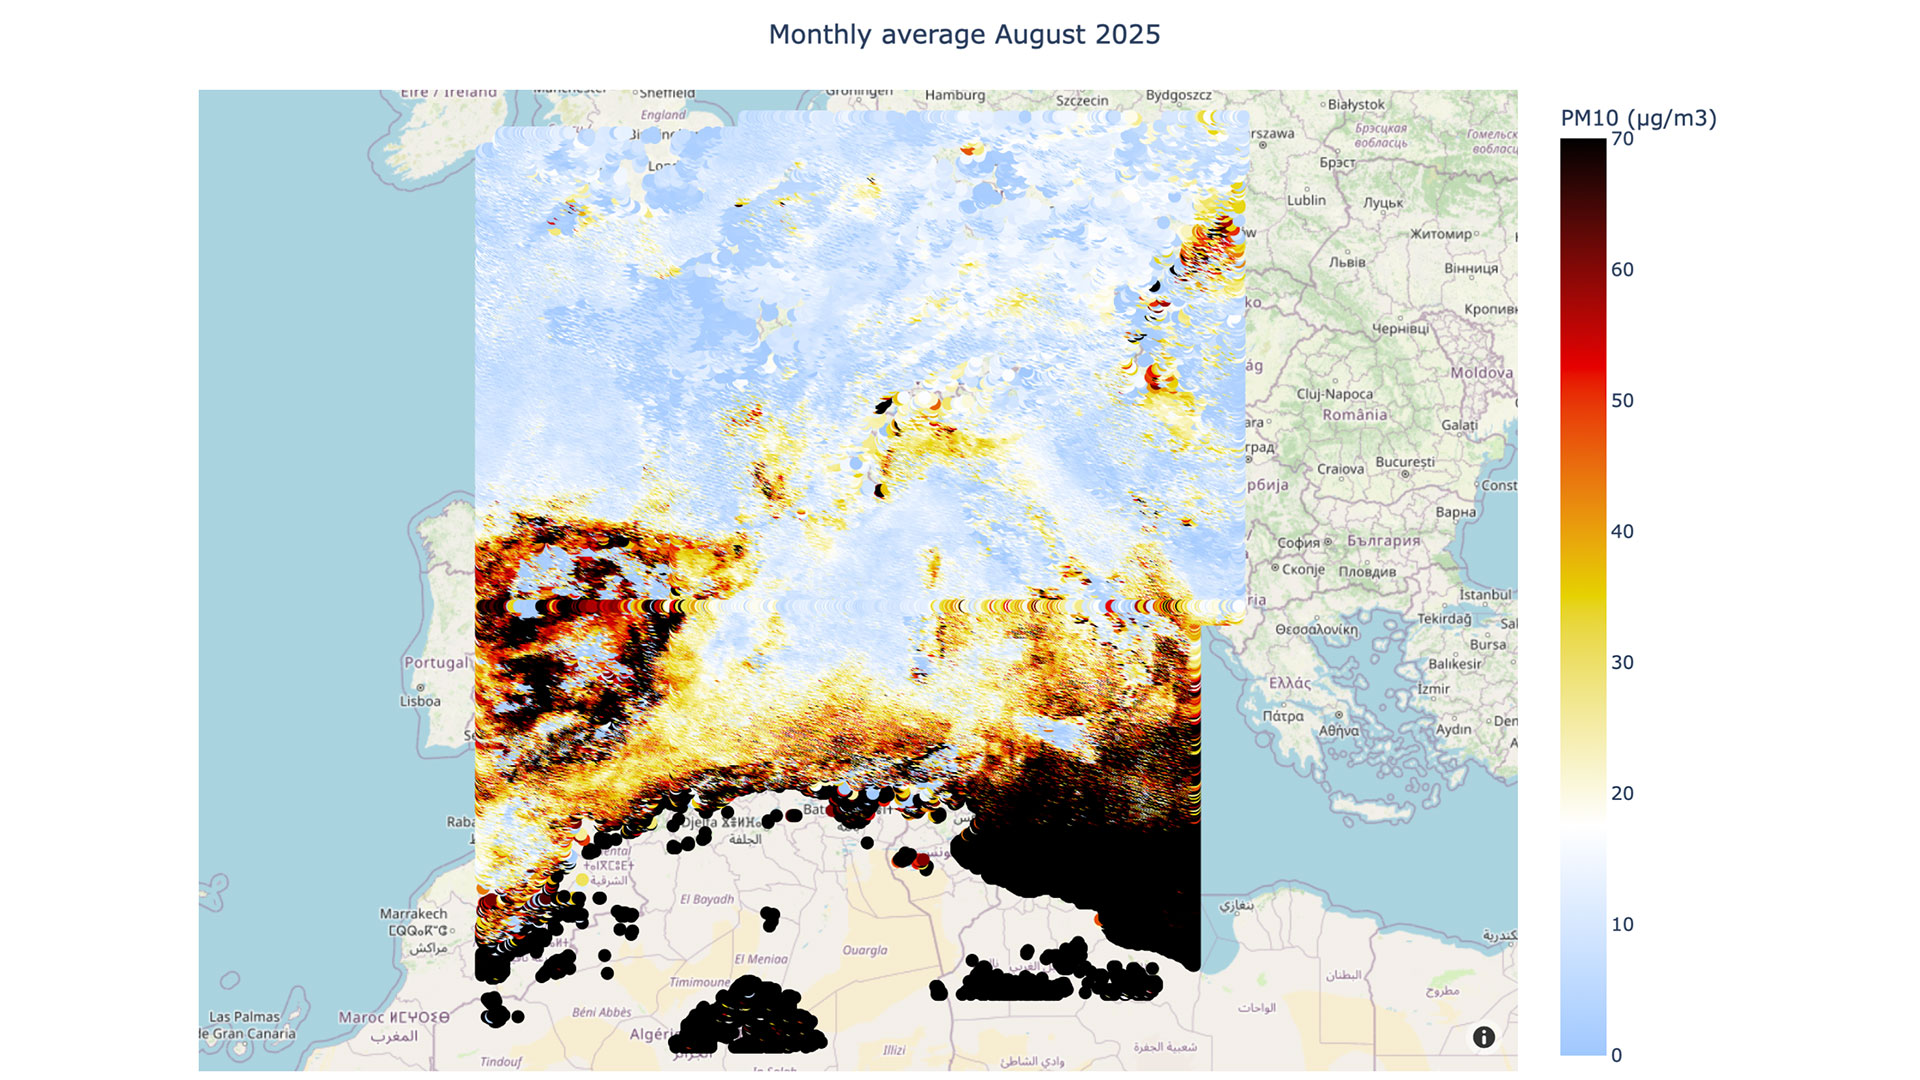
Developed by THALES Digital Services, the FLORIA tool automates the regular production of PM10 pollutant maps for Europe, which the project is making available to the entire community during its SCO label phase. This map shows the average of all daily measurements taken by satellite (Sentinel-3) over a month.
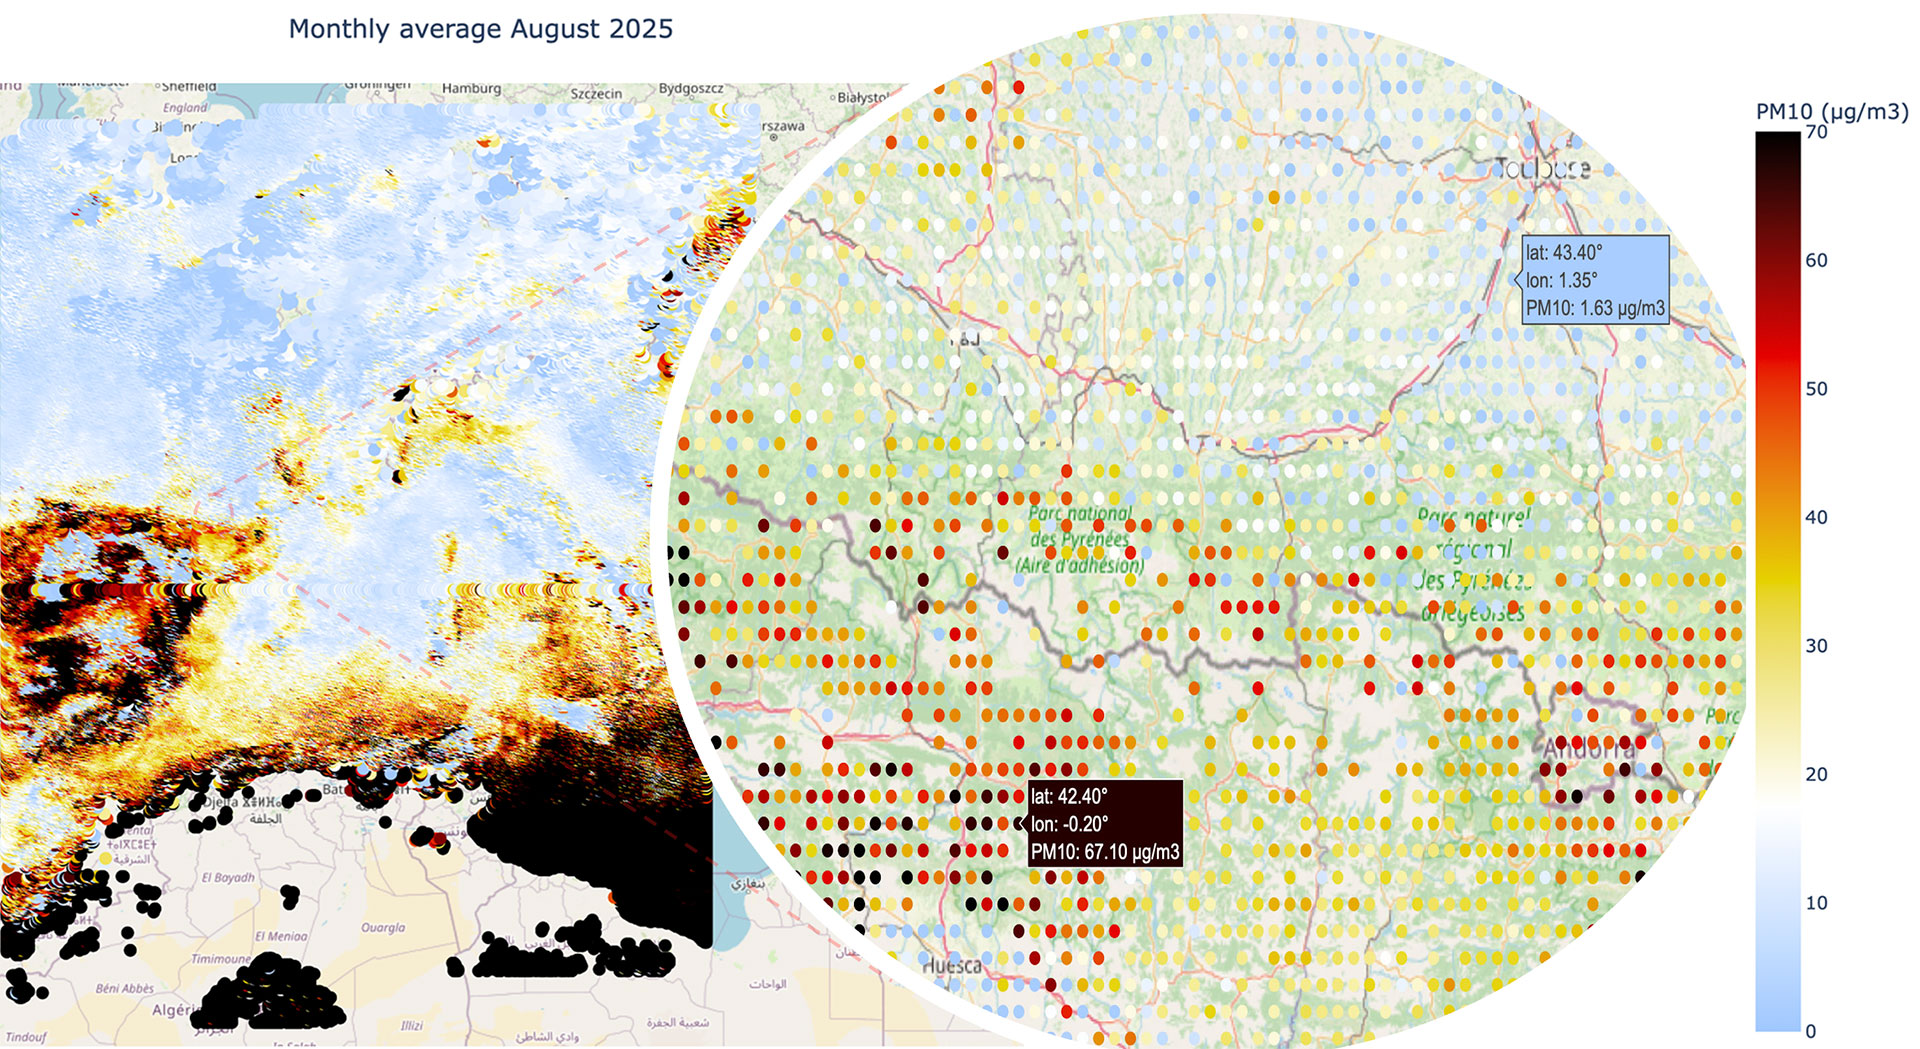
Zoom in/out, each point hovered over by the mouse displays the PM10 concentration on a color scale ranging from light blue (little or no particles) to black (high pollution). Example at the French-Spanish border in the Pyrenees. © THALES
🖱️ View the map (and save it to my Favorites)
💡 To see the map every month, subscribe to our newsletter!
Coming soon: stage 2 – climate-focused use cases
The THALES Digital Services team has already provided five years of Sentinel data, from 2019 to 2024, to its Czech partner World from Space. The aim is to validate this satellite data with measurements from their ground stations and analyze, through use cases, how this daily PM10 information can be used to monitor the impact of measures taken by local authorities in terms of land use planning, particularly urban planning, road traffic, etc. But that's another story, which we'll tell you about in a few months!