

SCOFrance
Useful linksPresentation of the project
Key wordsVegetation, ecosystem services, cities, machine learning
GUS mid-term review
On 11 April 2023, Cerema brought together the Green Urban Sat (GUS) team in Toulouse to take stock of the mid-term results of this project, which aims to produce a fine-tuned observatory of urban vegetation, with indicators useful for evaluating various ecosystem services. The spatial component of the “Men and trees” ("Des hommes et des arbres") initiative, GUS is based on Pleiades satellite imagery at very high spatial resolution (50 cm) to propose a series of reproducible indicators as well as a geovisualization of these through a cartographic demonstrator. Although the project is being implemented in the city of Nancy, in eastern France, the consortium is national in scope (see last paragraph "Who does what").
Vegetation to mitigate the impacts of climate change in cities
While vegetation is a source of well-being with undeniable socio-cultural and landscape benefits, it also provides many other services: cooling of the urban climate, carbon storage, regulation of air quality, reduction of soil erosion, refuge for biodiversity, etc.
By evaluating the ecosystem services provided by each type of vegetation, the objective of the GUS system is to help local authorities, developers and managers of vegetated areas in their choice of planning and/or development strategies for an urban area or a neighbourhood.
A 6-step methodology
- Identifying and mapping vegetated areas -> Achieved
To observe vegetation, and in particular trees, it is best to choose the period when they are at their peak growth! The team therefore retrieved a Pleiades image of Nancy at the beginning of the summer, which they processed using a supervised learning method to map five classes of soil: vegetation, water, buildings, roads and bare soil.
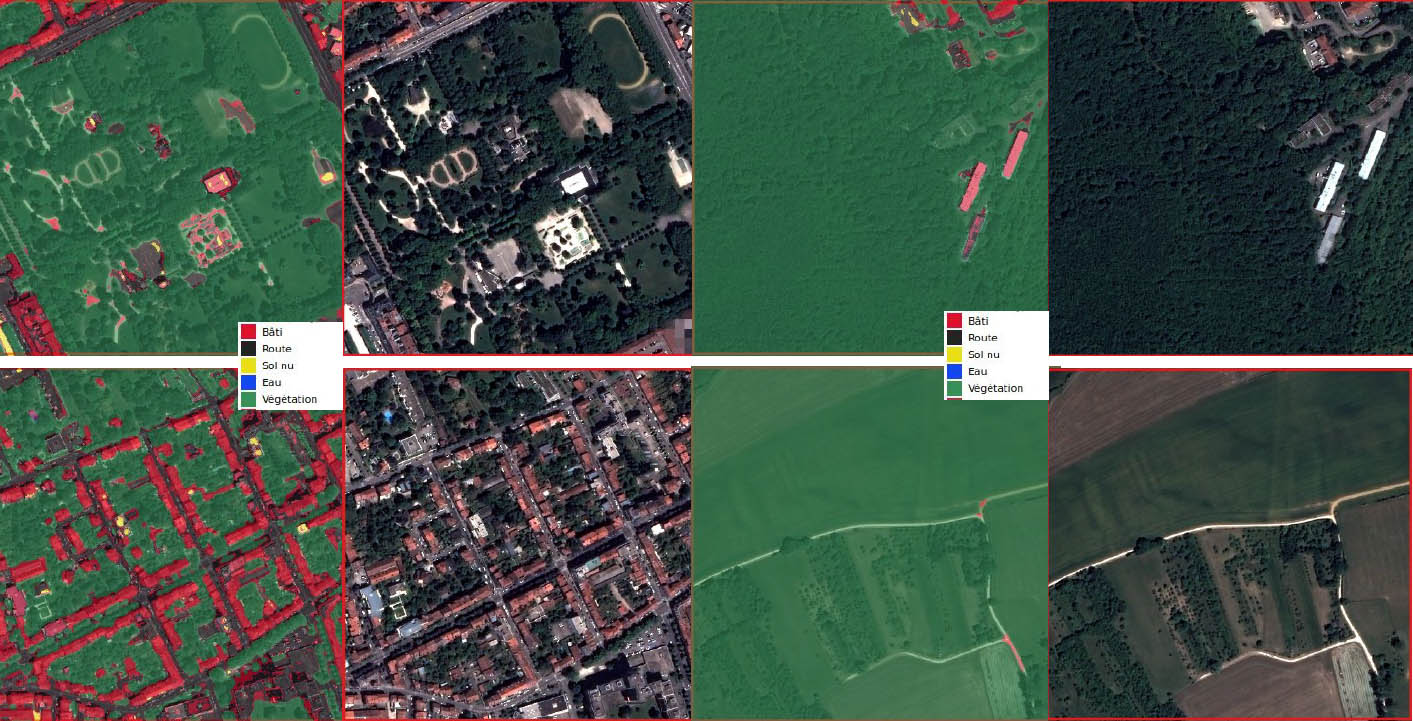
5-class land use map based on Pleiades images in urban (left) and rural (right) areas. © Cerema/Airbus DS
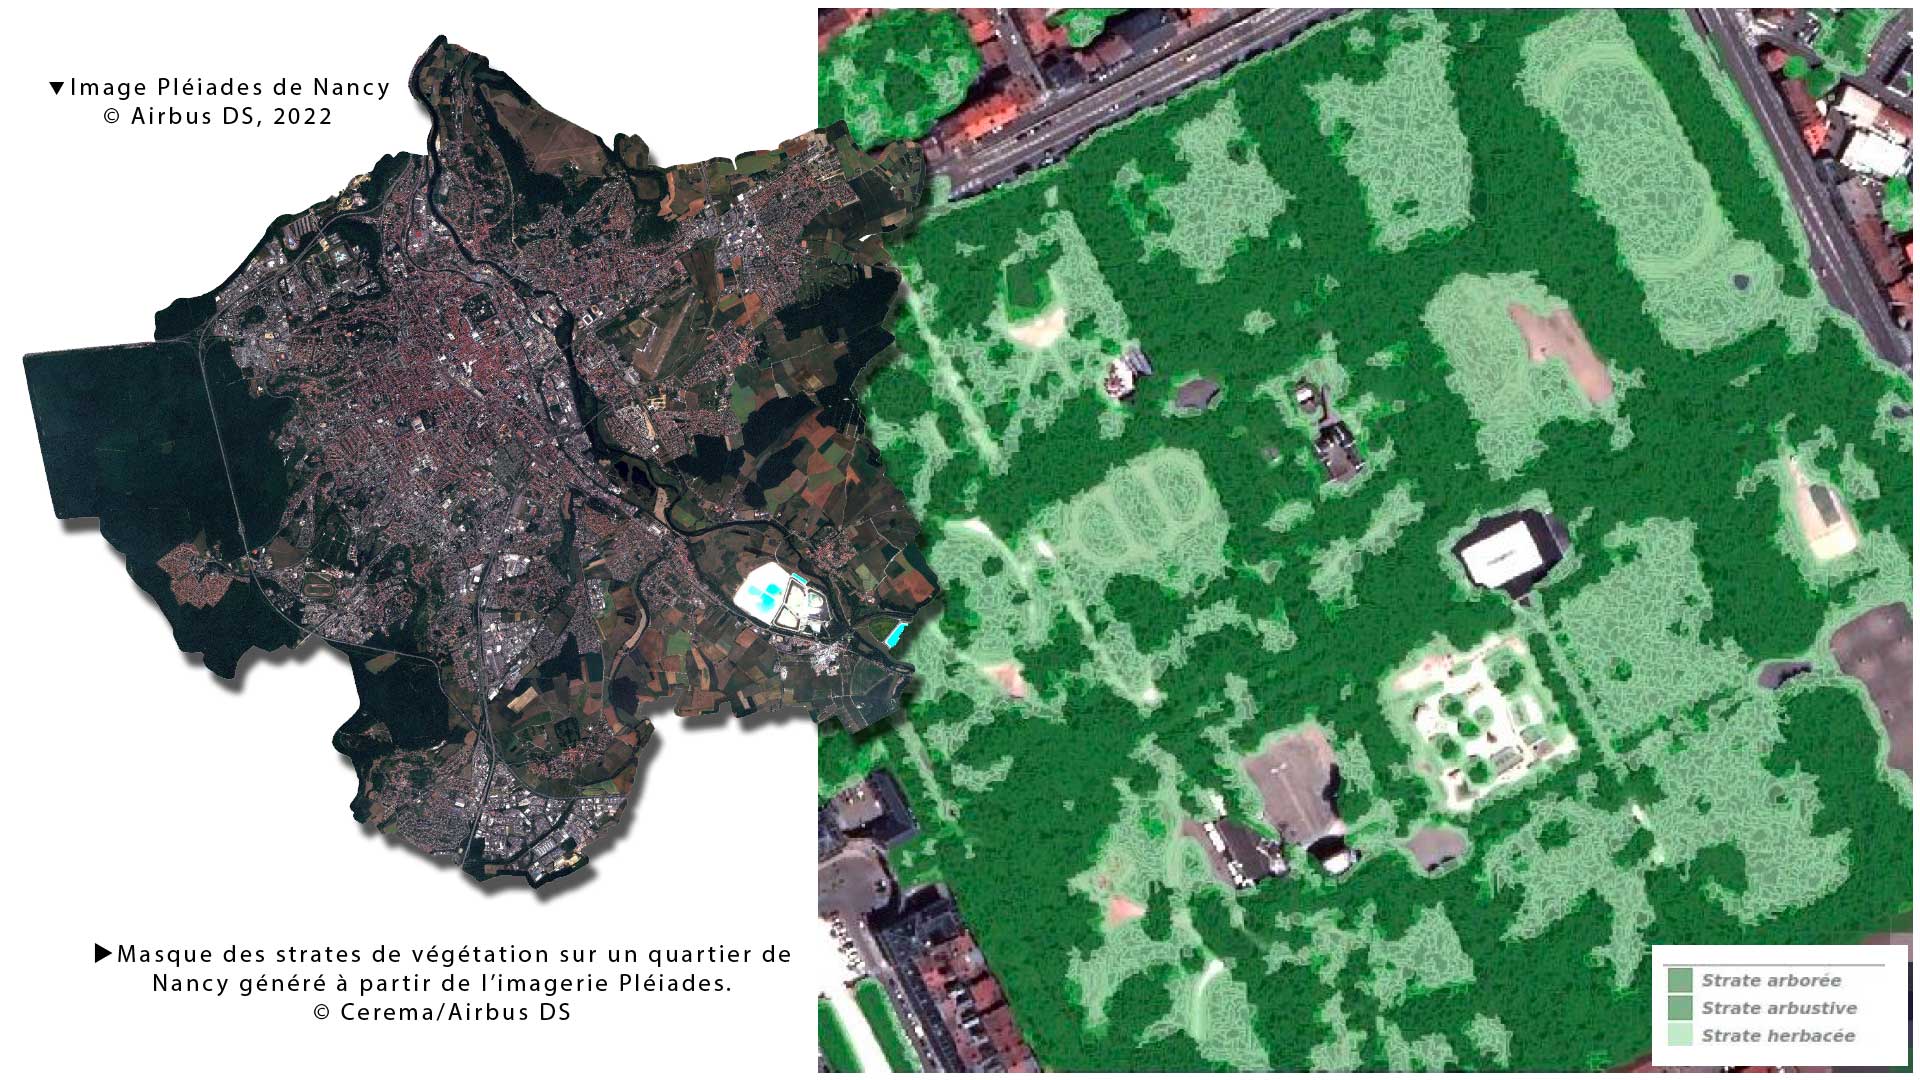
- Distinguishing vertical vegetation layers -> Achieved
Since Pleiades has the ability to produce tri-stereoscopic images (the same location viewed at a few moments' interval from three different angles), the team produced Digital Height Models (DHMs) of the city which, when crossed with the vegetation mask, made it possible to distinguish three vegetation layers: trees (> 3 m), shrubs (between 1m and 3m), and grass (< 1 m) (see the opening image of the article). As the distinction of the shrub layer is not always obvious, a texture criterion was added in addition to height.
- Distinguishing between horizontal vegetation forms -> Ongoing
To refine the automatic classification of tall vegetation, the team used various indices (shape, compactness, elongation). To extract the herbaceous stratum as exhaustively as possible, it used multi-temporal Pleiades images and analyzed the evolution of a vegetation index. Indeed, the vegetation cover of grassy areas (lawns, meadows, etc.) evolves in a very different way from that of a cultivated field.
- Defining the surrounding landscape -> Ongoing
The ecosystem services provided by vegetation vary according to their environment: is such a plant structure near water, does it border a road, etc.? To characterize the environment of vegetation as automatically as possible, the GUS team is developing a methodology that will use other national databases as input.
- Calculation of indicators -> In progress
To complete the description of the vegetation, the team will propose indicators that take into account descriptive attributes such as morphology, soil support (permeable or not), etc.
- Developing a visualization platform -> Ongoing
All the data produced ("vegetation" data and indicators) will be integrated into an online platform allowing the visualization and analysis of the different data sets. Developed by TerraNIS, this platform will be able to integrate their current offer concerning vegetation/vegetation in urban areas, Greencity.
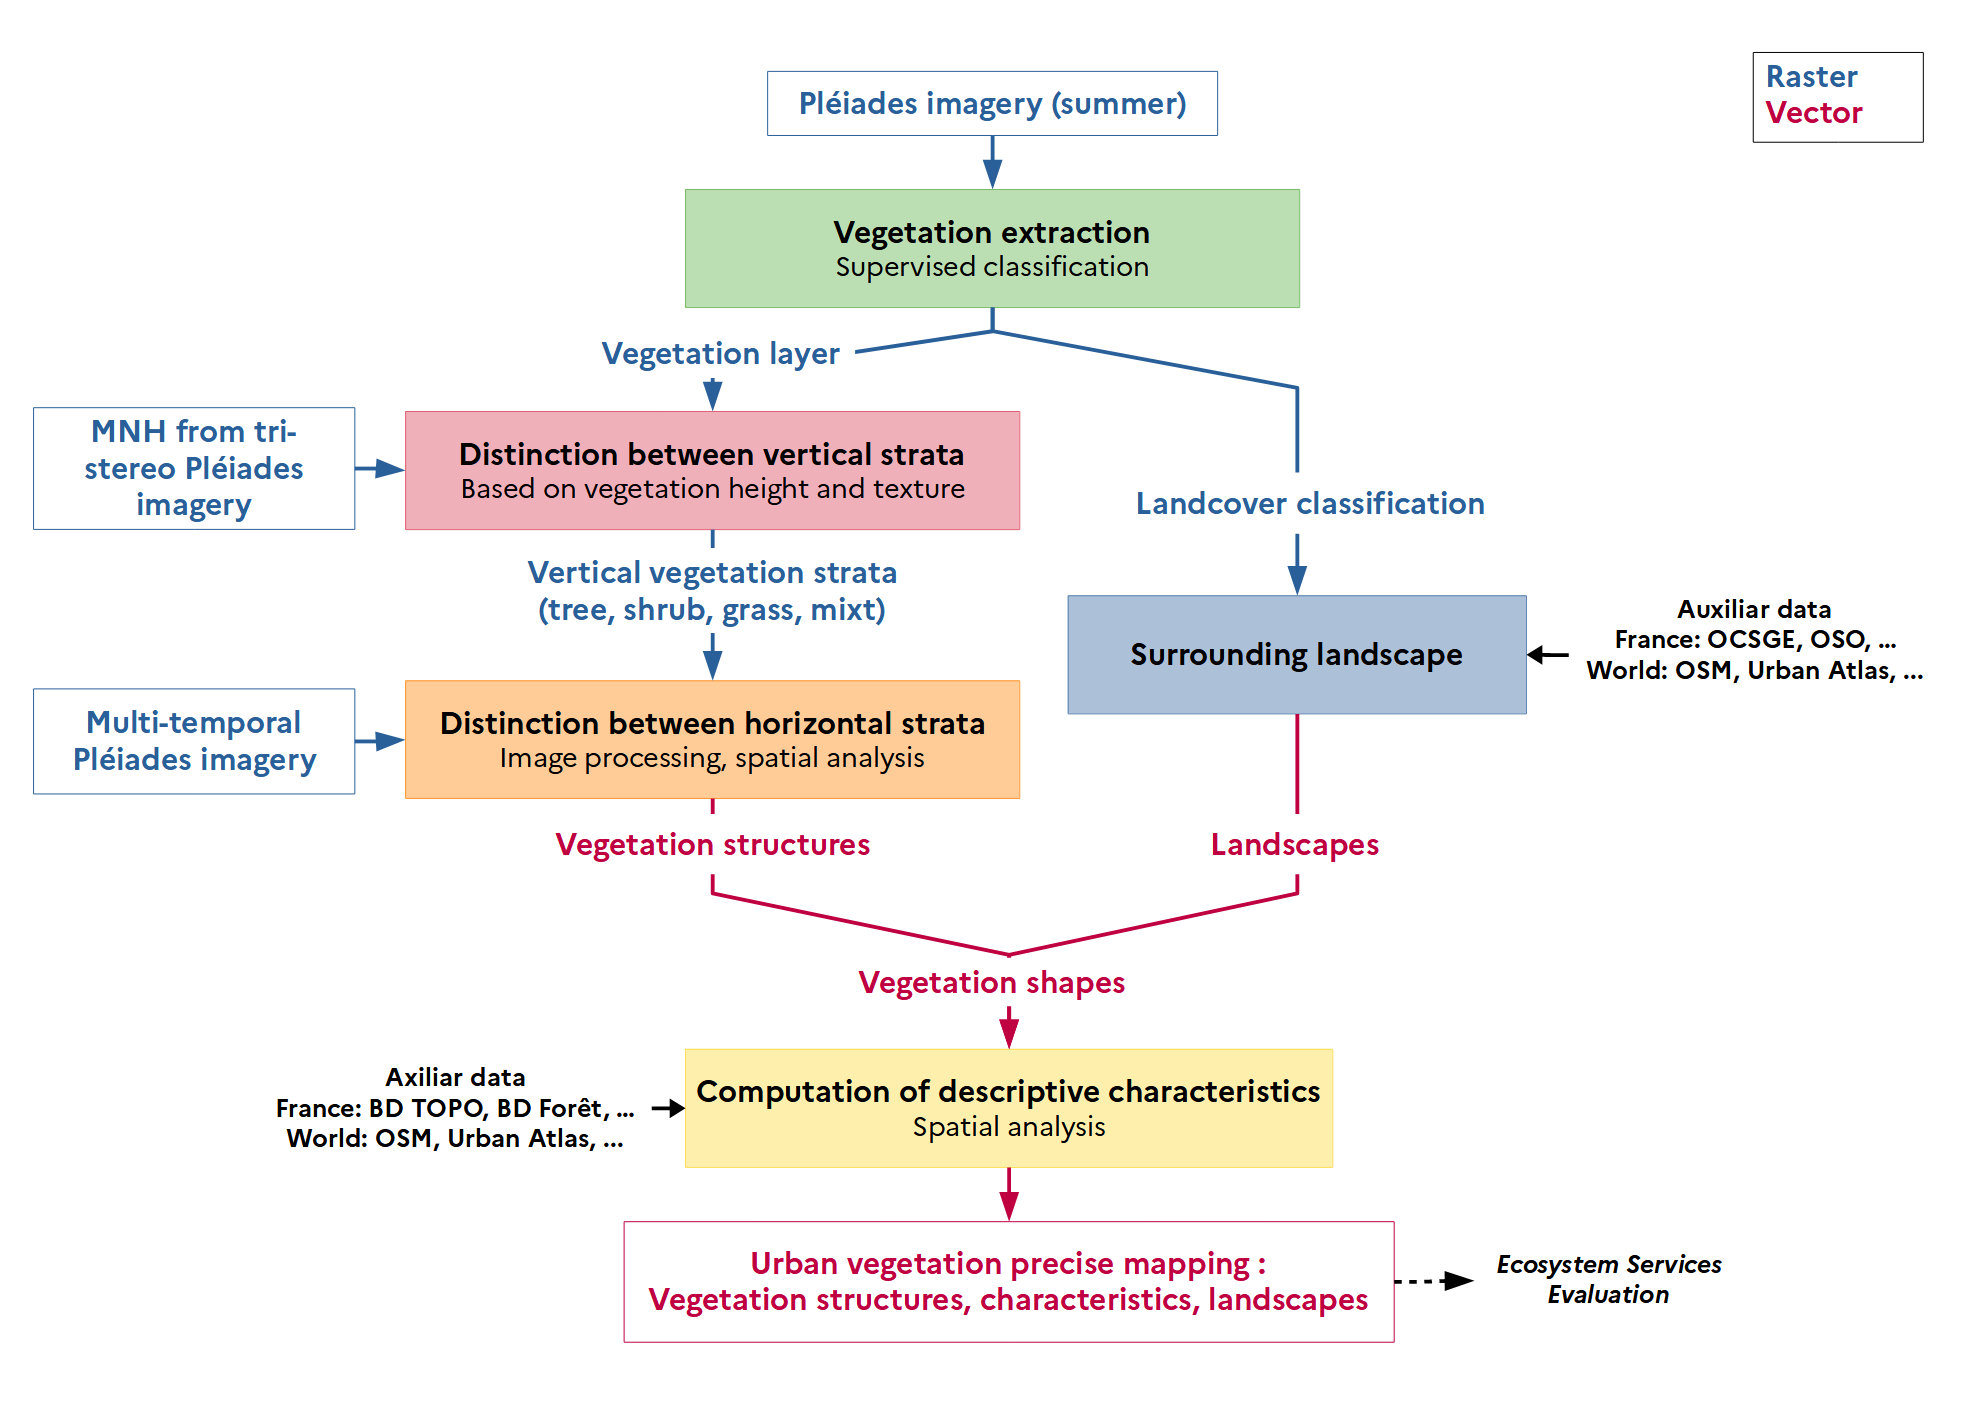
Diagram of the Green Urban Sat system development methodology © Cerema
Who does what?
As requested by the SCO, the GUS project consortium brings together several families of complementary actors:
- Cerema Eastern and Occitania: project management, definition of the vegetation typology reference system and construction of remote sensing methods and indicators associated with the evaluation of ecosystem services
- Metropole of Grand Nancy: definition of the need as an end user
- LIVE-A2S Laboratory of the University of Strasbourg: Scientific imaging, indicator development and methodology
- TerraNIS Company: Production of the demonstrator, commercial development
- CNES: support for the SCO project, funding, space expertise