

SCOFrance
Useful linkProject page
Key wordsWater, irrigation, rational management, evapotranspiration, water balance
IRRISAT: satellite data for water strategy
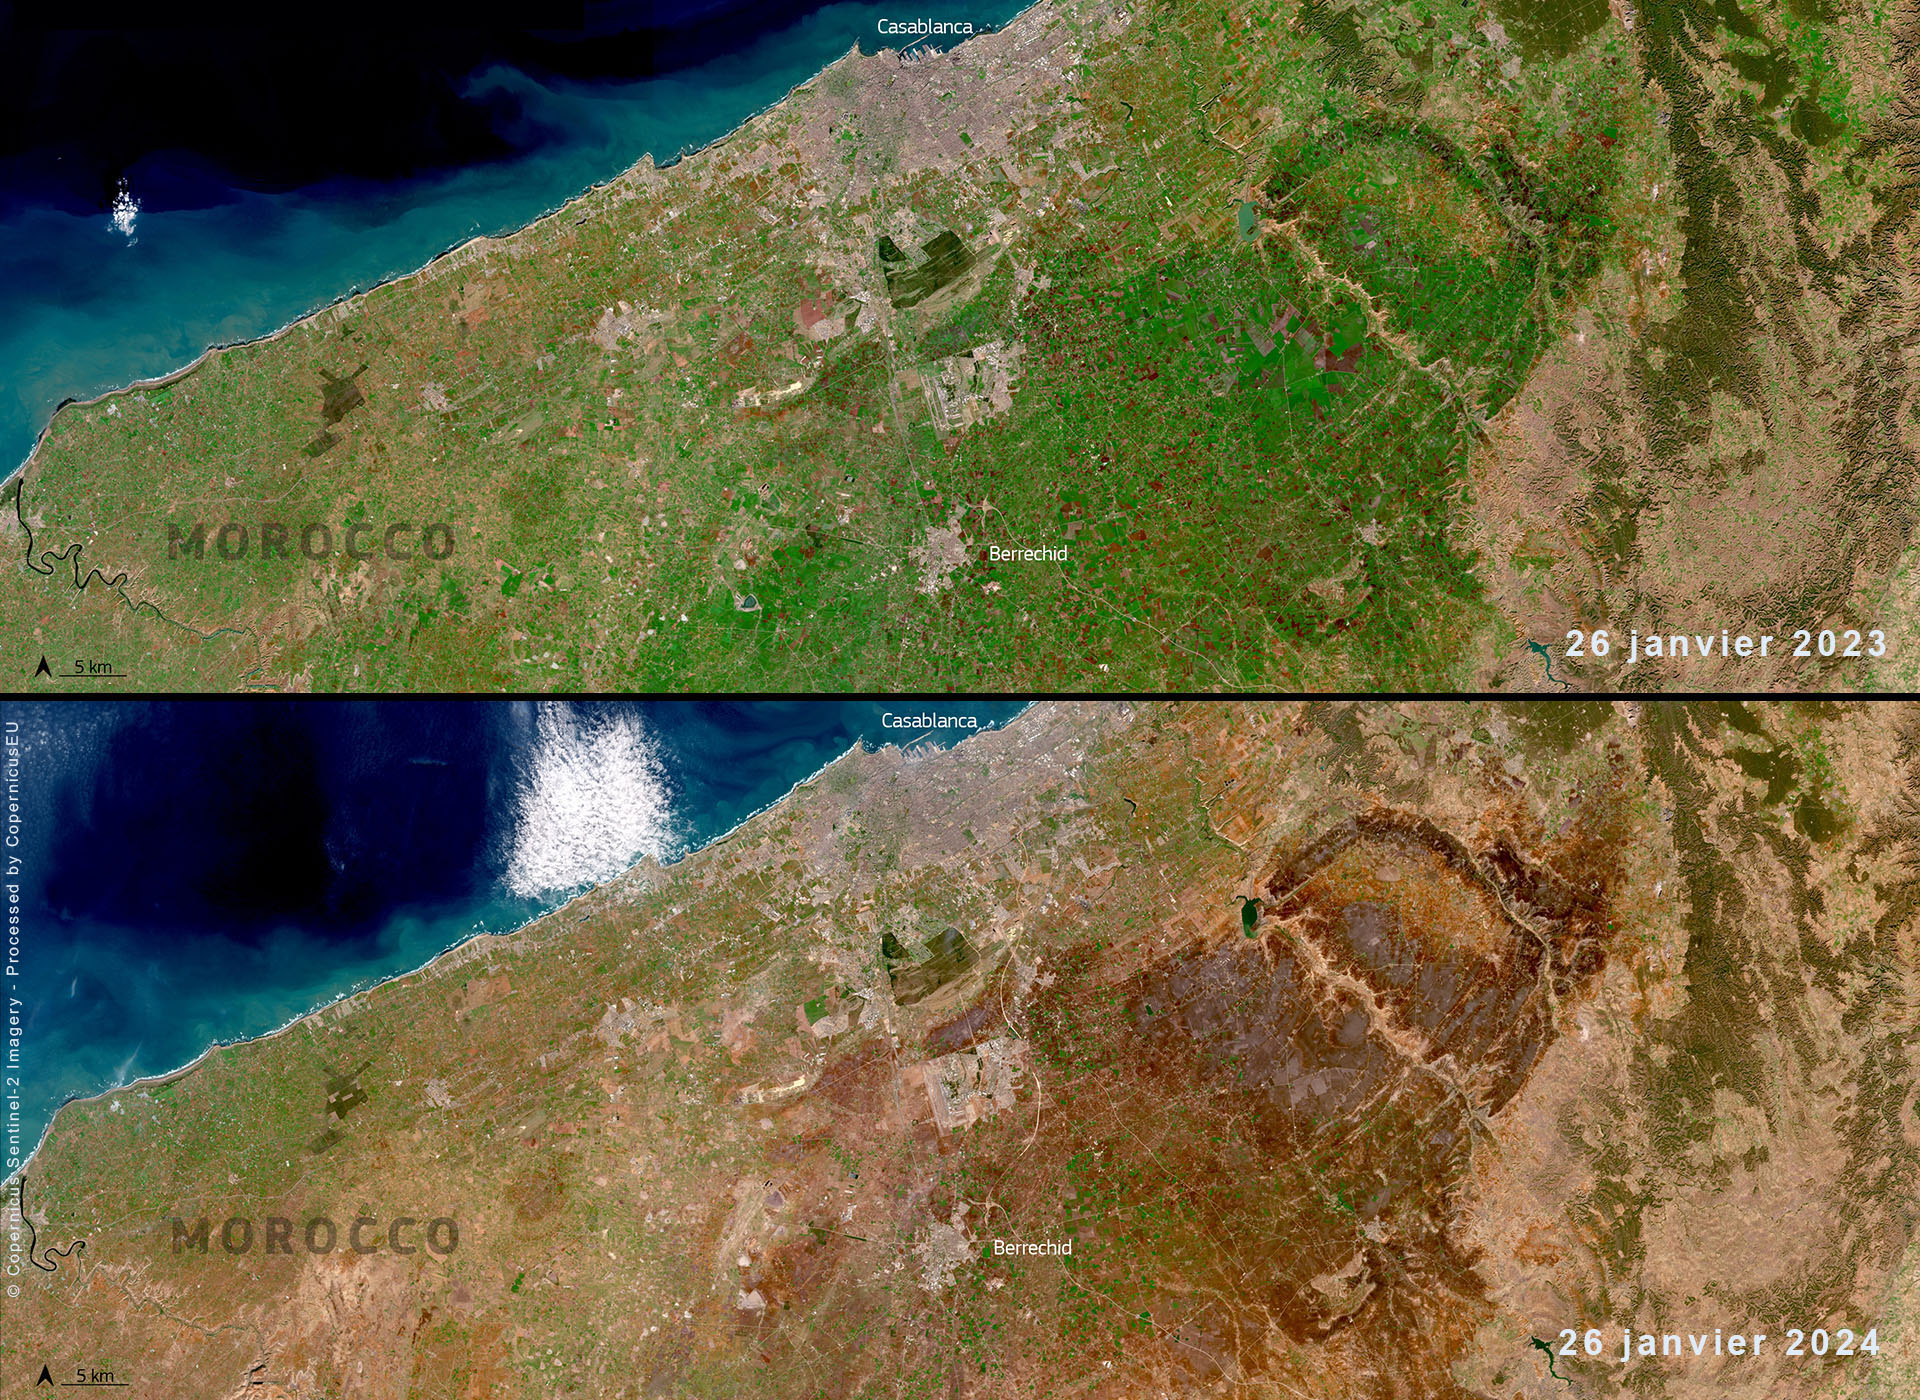
In Morocco, where climate change is weakening the hydrological context, the Department of Agriculture has drawn up a strategy for the supply of drinking water and irrigation. With regard to the latter, the aim is to better manage and rationalize the use of surface and groundwater, and to encourage localized irrigation (drip irrigation).
To support this approach, the Royal Centre for Remote Sensing in Morocco CRTS (Centre Royal de Télédétection Spatiale) has designed IRRISAT, an irrigation monitoring system for diagnosing water consumption, use (efficient or inefficient) and productivity. "Unfortunately, the project stalled for a number of reasons. But when CNES presented us with the SCO, we saw an opportunity to revive and improve this work by combining it with other approaches, particularly that developed by CESBIO, in order to put in place an operational system for producing reliable decision-support indicators", explains Mohammed Faouzi Smiej, Head of the Acquisition and Restitution Department in the CRTS Data Management Division. Two years later, thanks to the SCO label, the SAT'IRR tool has been transferred to CRTS, and greatly improved.
Two complementary systems
"At CRTS, we have developed IRRISAT, a global approach based on an energy balance using thermal infrared data. The system generates four products: estimates of evapotranspiration, biomass, soil moisture and advice on irrigation watering. The IRD's SAT'IRR platform is developing a local approach based on water balance, using Sentinel-2 and Landsat imagery. Creating a synergy between these two platforms will enable us to produce virtually real-time information on water consumption on a daily basis, both locally and globally," explains Mohammed Faouzi Smiej.
This is confirmed by Michel Le Page, IRD research engineer and irrigation specialist at CESBIO: "On a regional scale [Irrisat], monitoring water resources is important for water basin managers who need global indicators on the resource and its impact in terms of productivity. On the other hand, on a local scale [SAT'IRR], it is very difficult to calculate the water balance: we know the rainfall but that's about it. We therefore focus on water inputs and plant evapotranspiration, an important part of the water balance that also enables us to identify trends".
|
Spatial indicators can be used to objectively assess available resources and optimize their use at every level of need and decision-making:
|
Irrigation control, a market that's still in its infancy |
Project achievements
- IRRISAT
👉Creation of an interface for producing and analyzing products on water consumption and productivity.
The CRTS now has a back-office tool that facilitates the generation, in real time or for an entire agricultural season, of various products and indicators on water consumption and productivity, at different spatial and temporal scales, based on VIIRS, Landsat and meteorological satellite data.
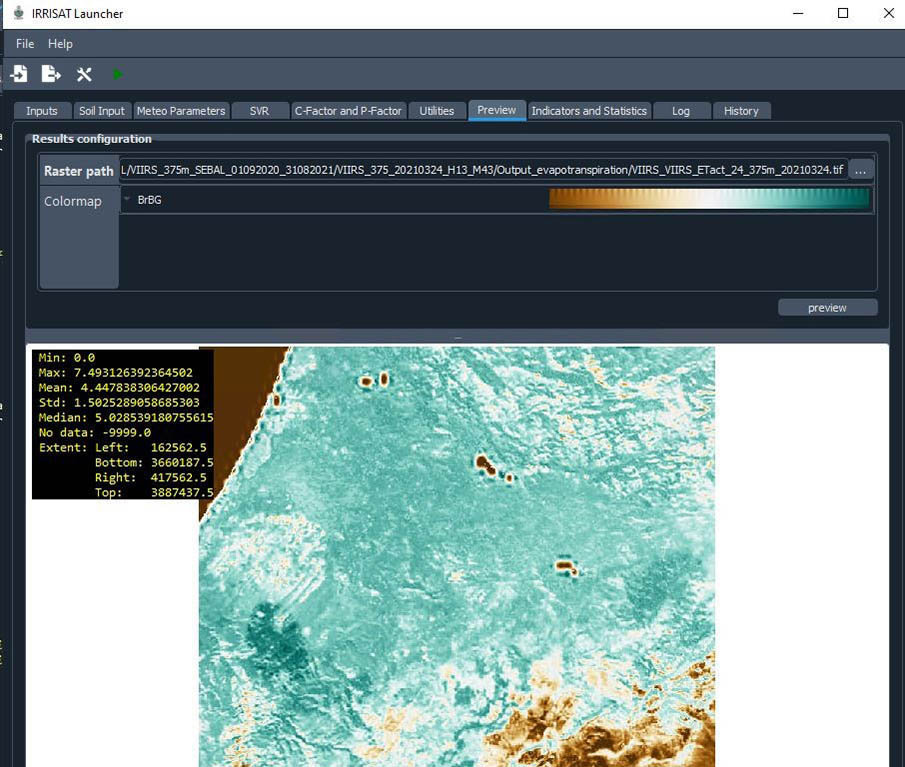
▲ Back-office interface for production and analysis of products and indicators on water consumption and productivity (display of daily ET). © CRTS |
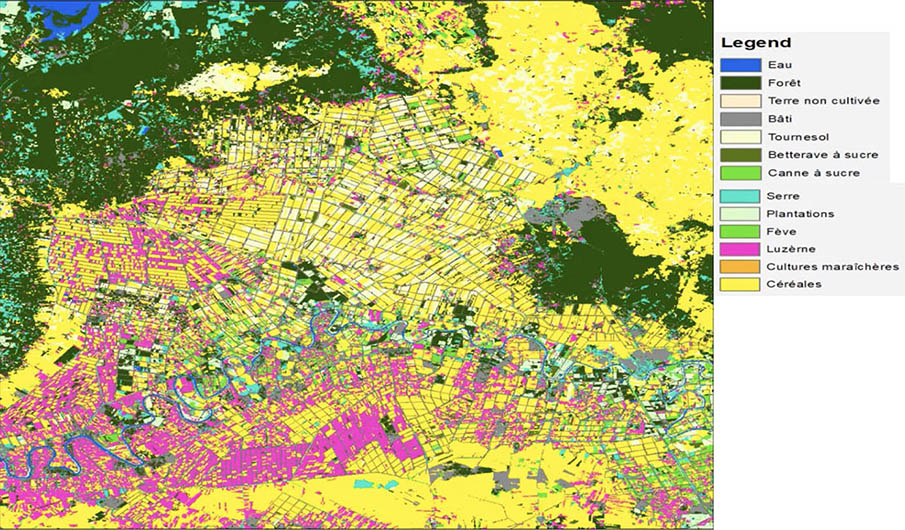
▲ Plot map of winter crops in the Gharb irrigated perimeter generated by IRRISAT from a time series of Sentinel-2 images between October 2022 and the end of May 2023. © CRTS |
|
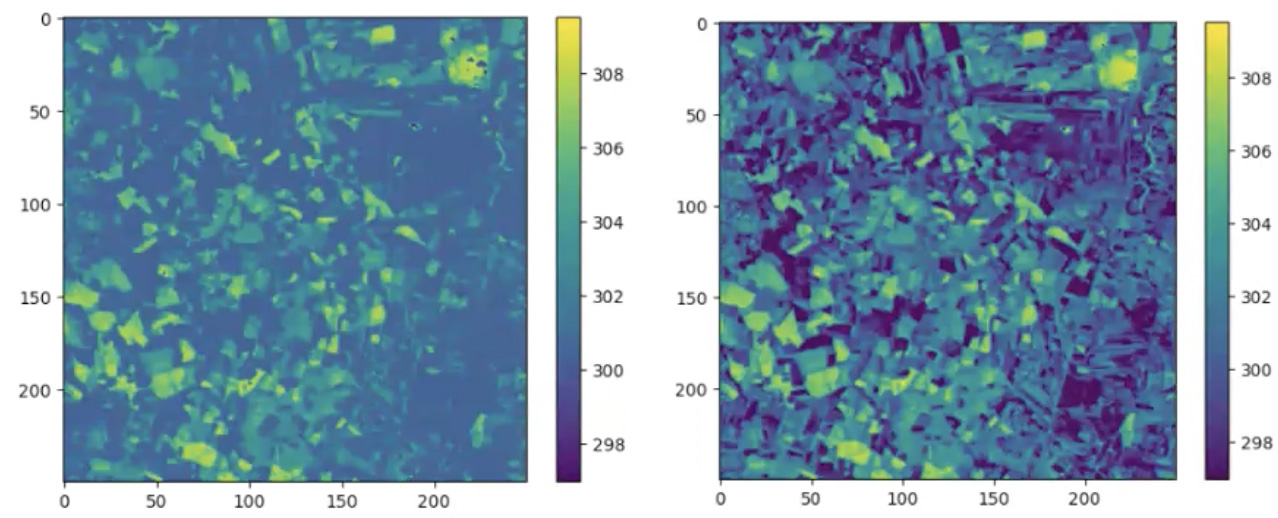
👉Produced on a regional scale from thermal infrared Under the SCO label, the CRTS teams have worked to improve the reliability of IRRISAT products, in particular to improve the definition of thermal data. |
Surface temperatures: enhancement of VIIRS low-resolution thermal data (375 m, left) with Sentinel-2 and Landsat8 data (30 m, right). © CRTS |
- SAT’IRR
|
👉 Plot-scale products based on optical imagery For their part, the CESBIO teams restructured the SAT'IRR software and its platform so that it could be transferred to CRTS. To enable local players to familiarize themselves with the software, a training course was organized at CRTS, followed by another with farmers. As SAT'IRR operates at plot level, CESBIO has also set up a system for monitoring four pilot plots on different representative crops (olives, watermelons, oranges and vines). Designed to validate the model but also to iterate with farmers, these plots have been equipped with instruments for automatically measuring water input and soil moisture. |
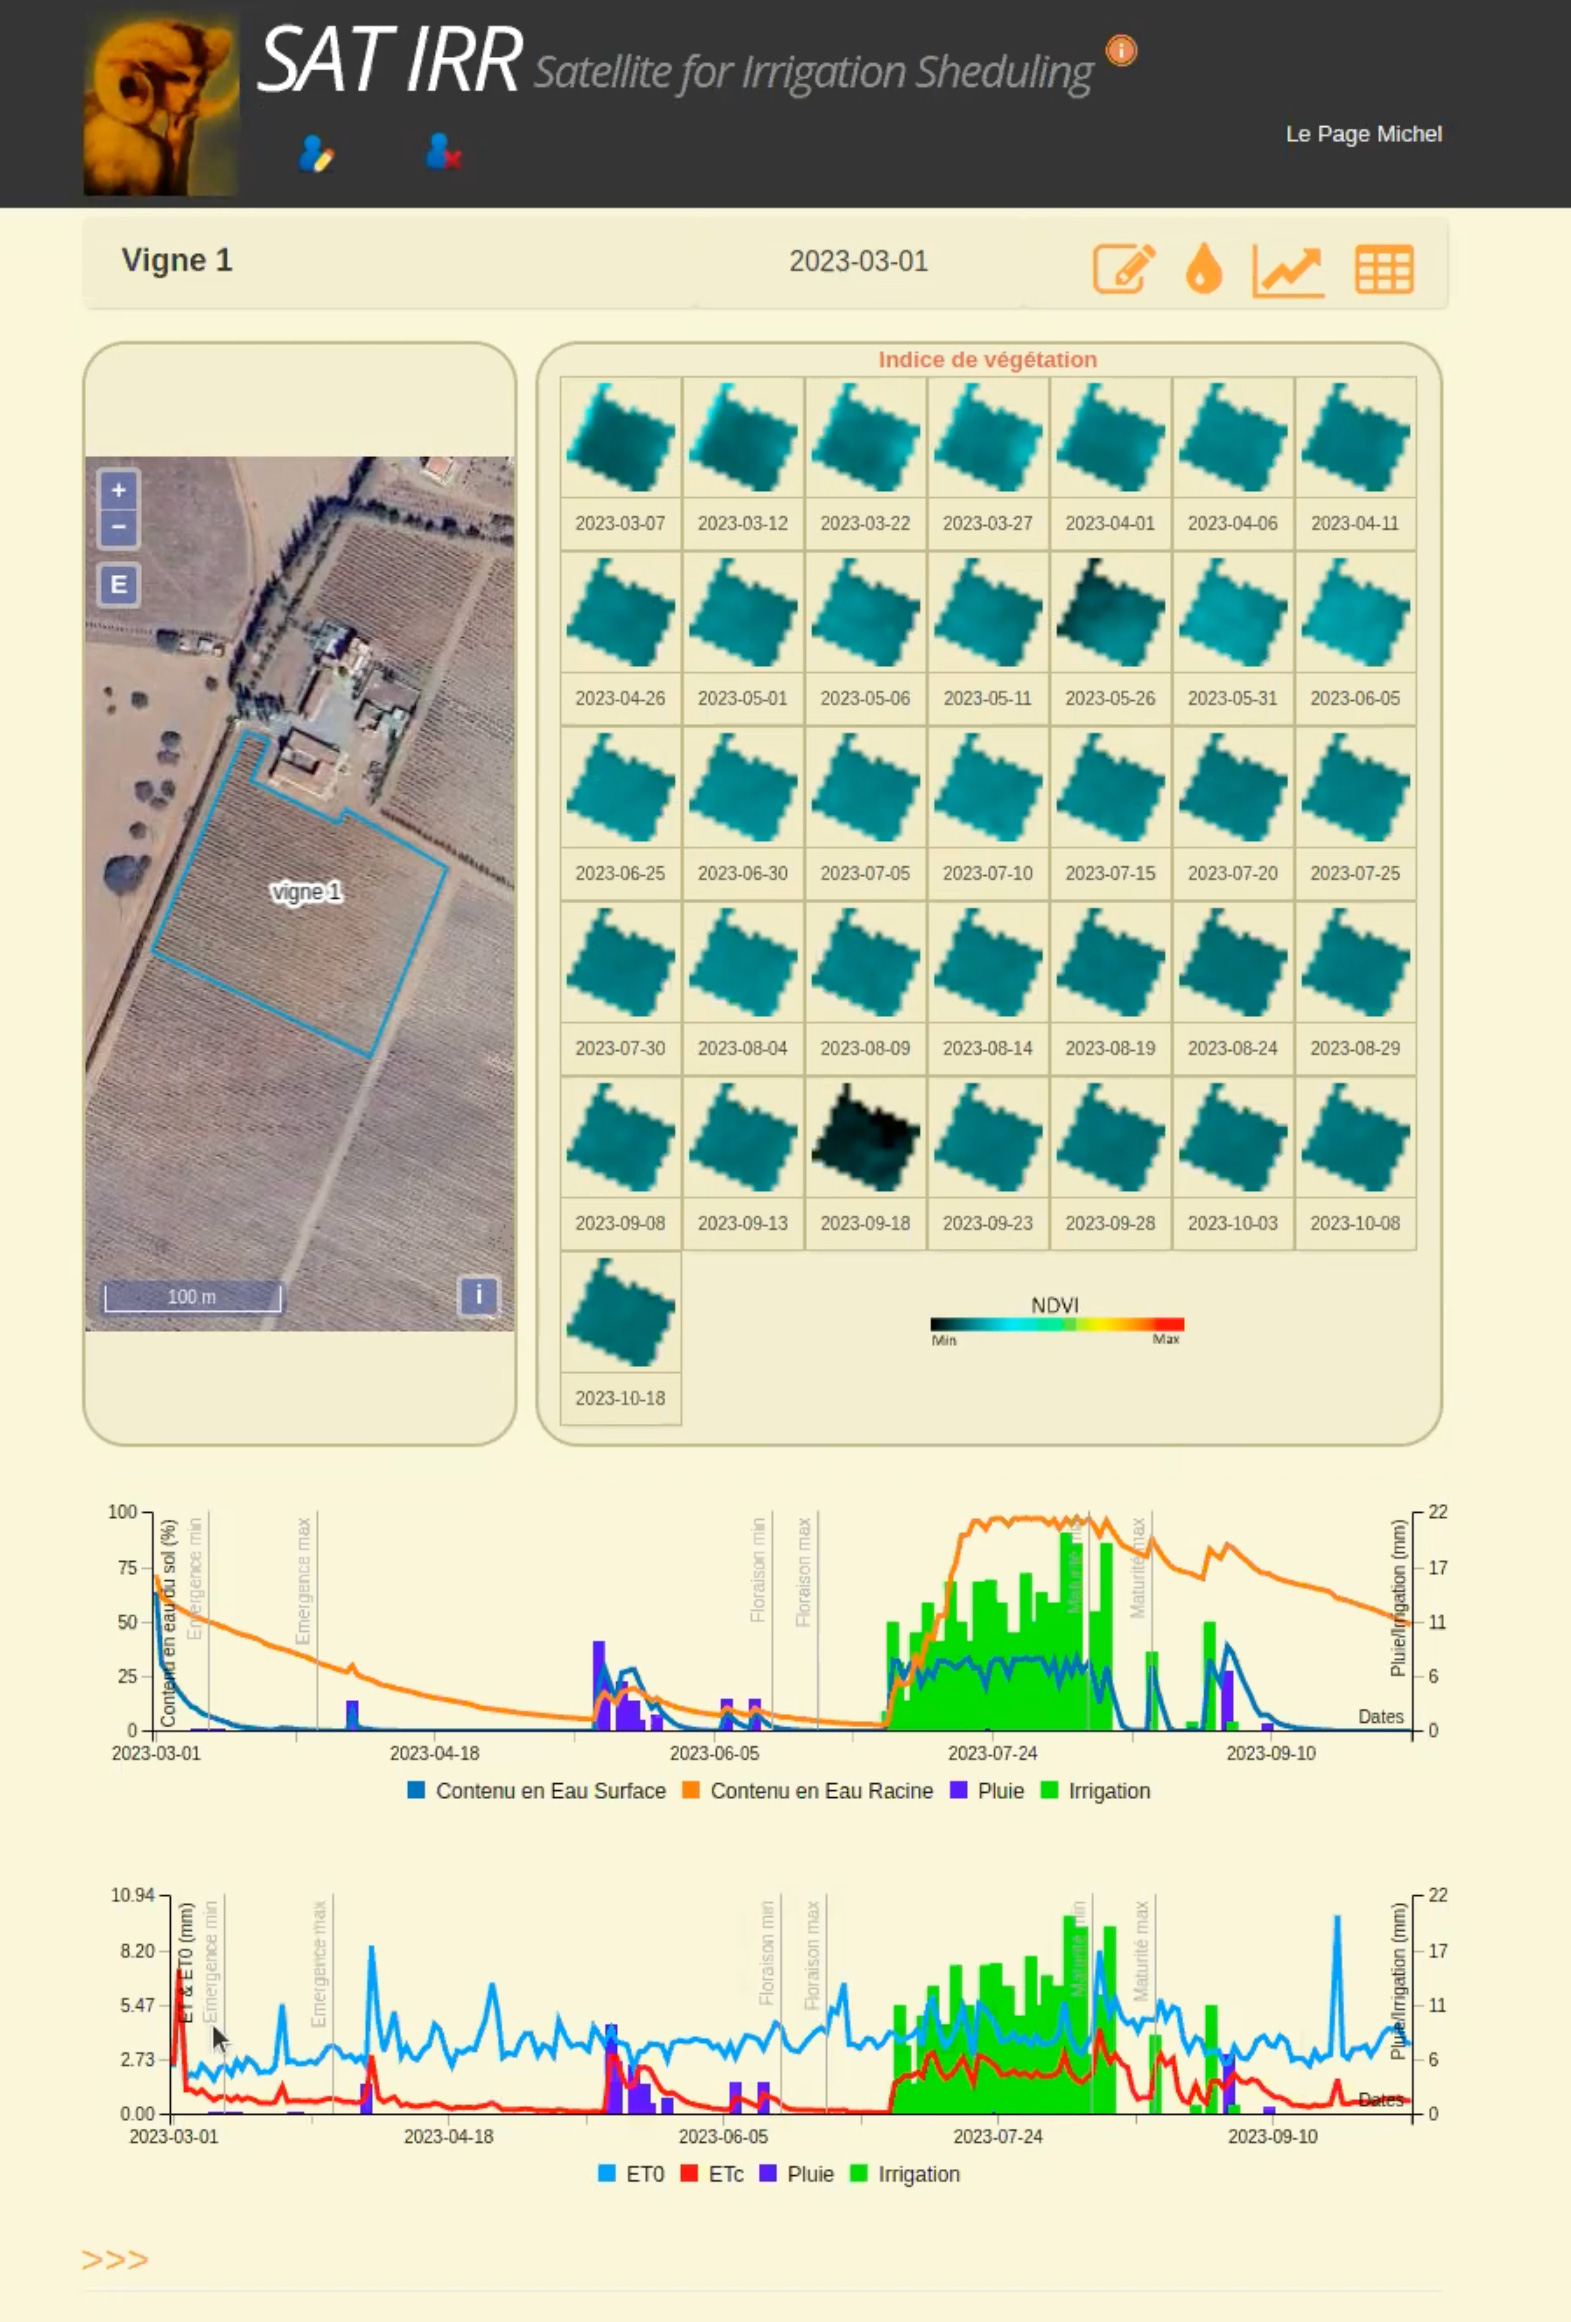
SAT'IRR interface: the plot is identified on a Sentinel-2 image in the top left-hand corner. To its right, the system retrieves the weather data. Below, the first graph shows the evolution of the various water inputs, the second that of evapotranspiration. |
👉See details of the methodology, survey and results on the project page
Outlook
CRTS and IRD are now working to harmonize the input data (weather and satellite imagery) from the two platforms so that they work together. Eventually, a geoweb platform will be used to distribute these products.