

SCOFrance
Useful linksPresentation of the project
Key wordsCoastline, coastal habitat, intertidal zones, tides, shallows, turbidity, change detection
Littosat: 2 demonstrators online
In order to protect coastal habitats, and in particular the part of the coastline periodically covered by the tide, the managers of these areas need a dashboard for monitoring the spatial evolution of vegetation.
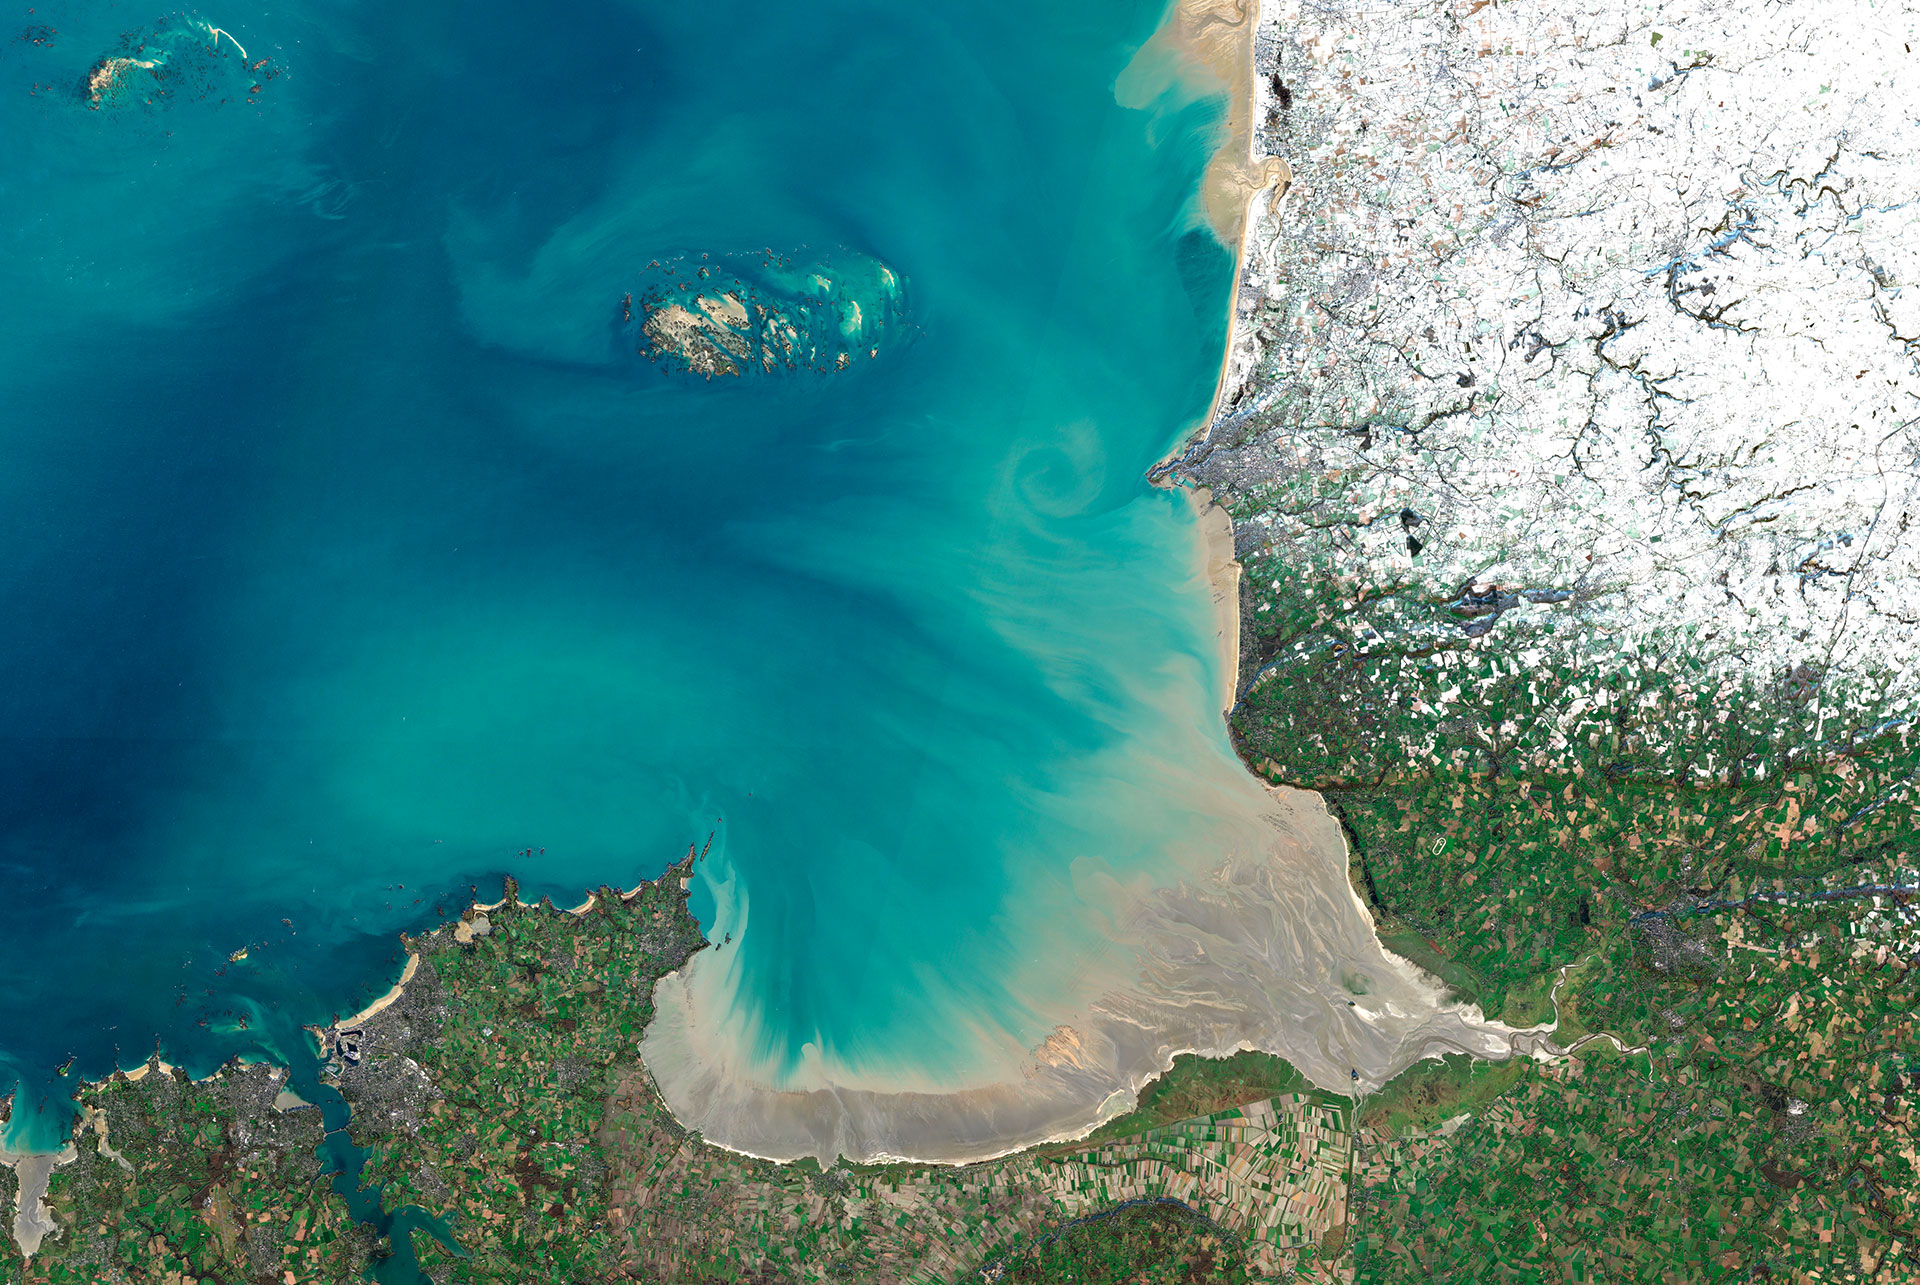
Using satellite data, the Littosat project is designing an interface that will enable mosaics of high and low tide images tobe displayed systematically at high spatial resolution (10 m). From these same data, it is generating high added-value products on the nature of the seabed, the depth of shallow waters and turbidity, thereby feeding functions for detecting seasonal changes on a regional scale.
After 12 months' work, two interfaces are ready for operational testing in the project's two pilot French areas, Brittany and Normandy.
|
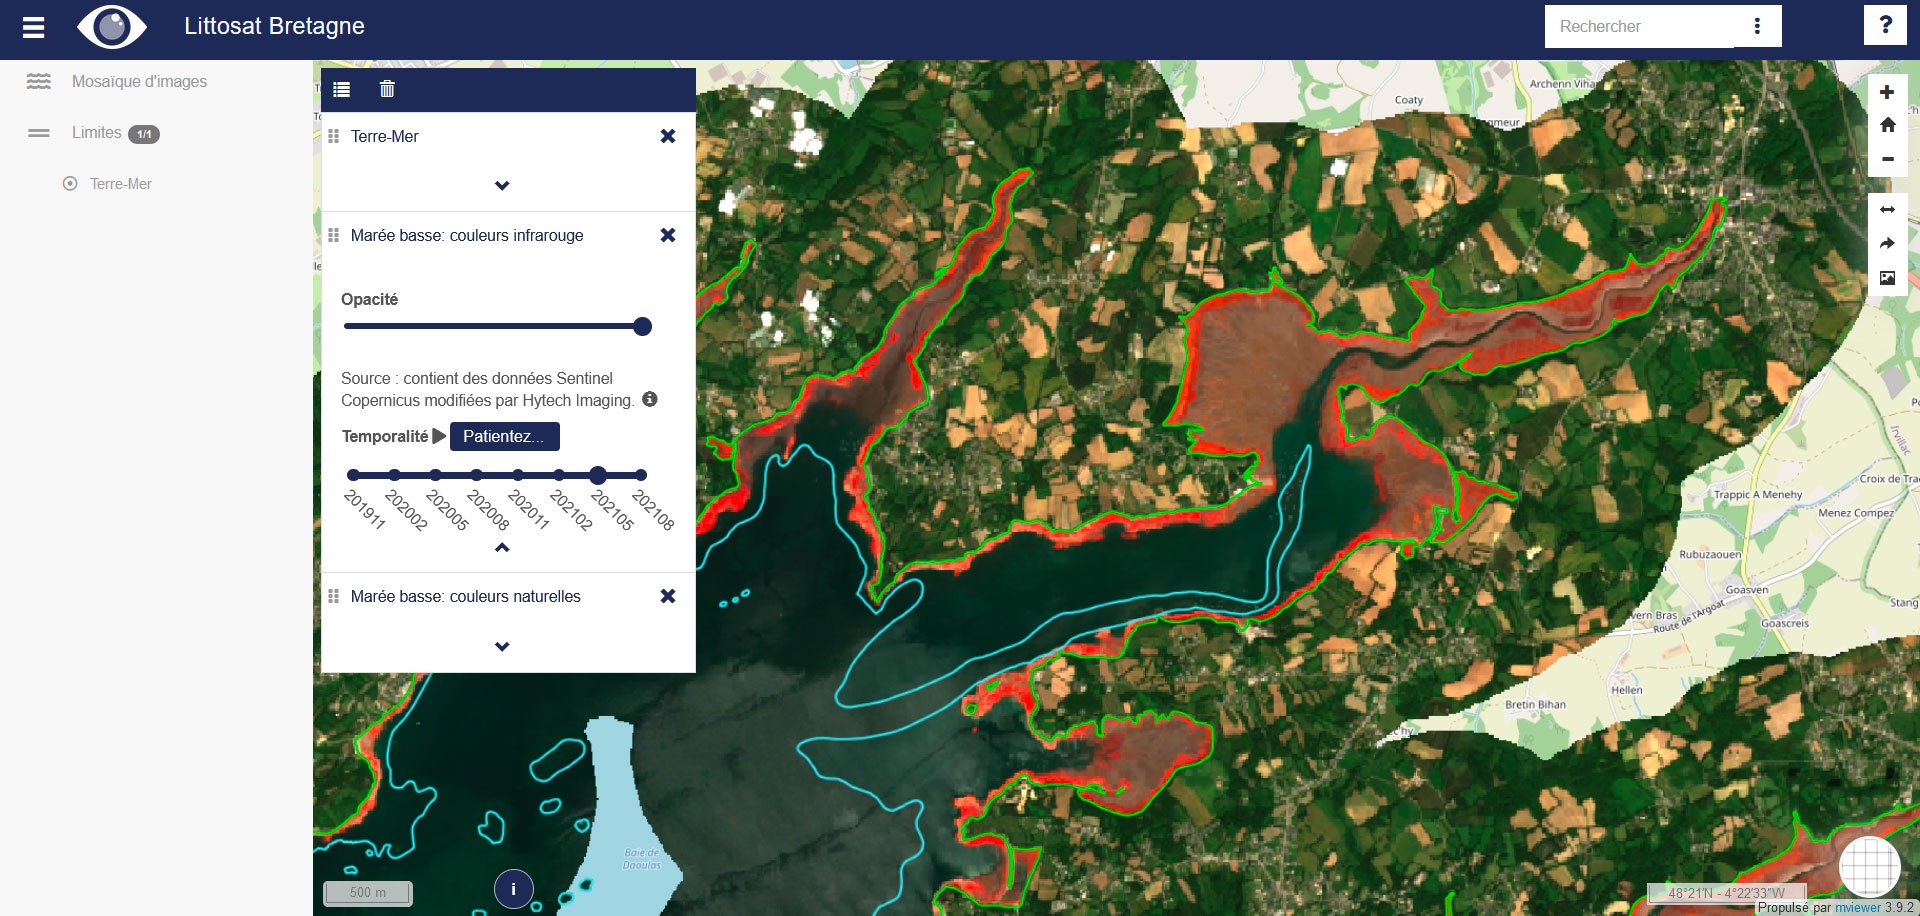
▲ Littosat Bretagne interface on the Daoulas river (Finistère): mosaic of images at low tide in spring 2021, displayed in infrared, highlighting the vegetation of mudflats and salt marshes. © Littosat 👉 Testing the Littosat Bretagne platform |
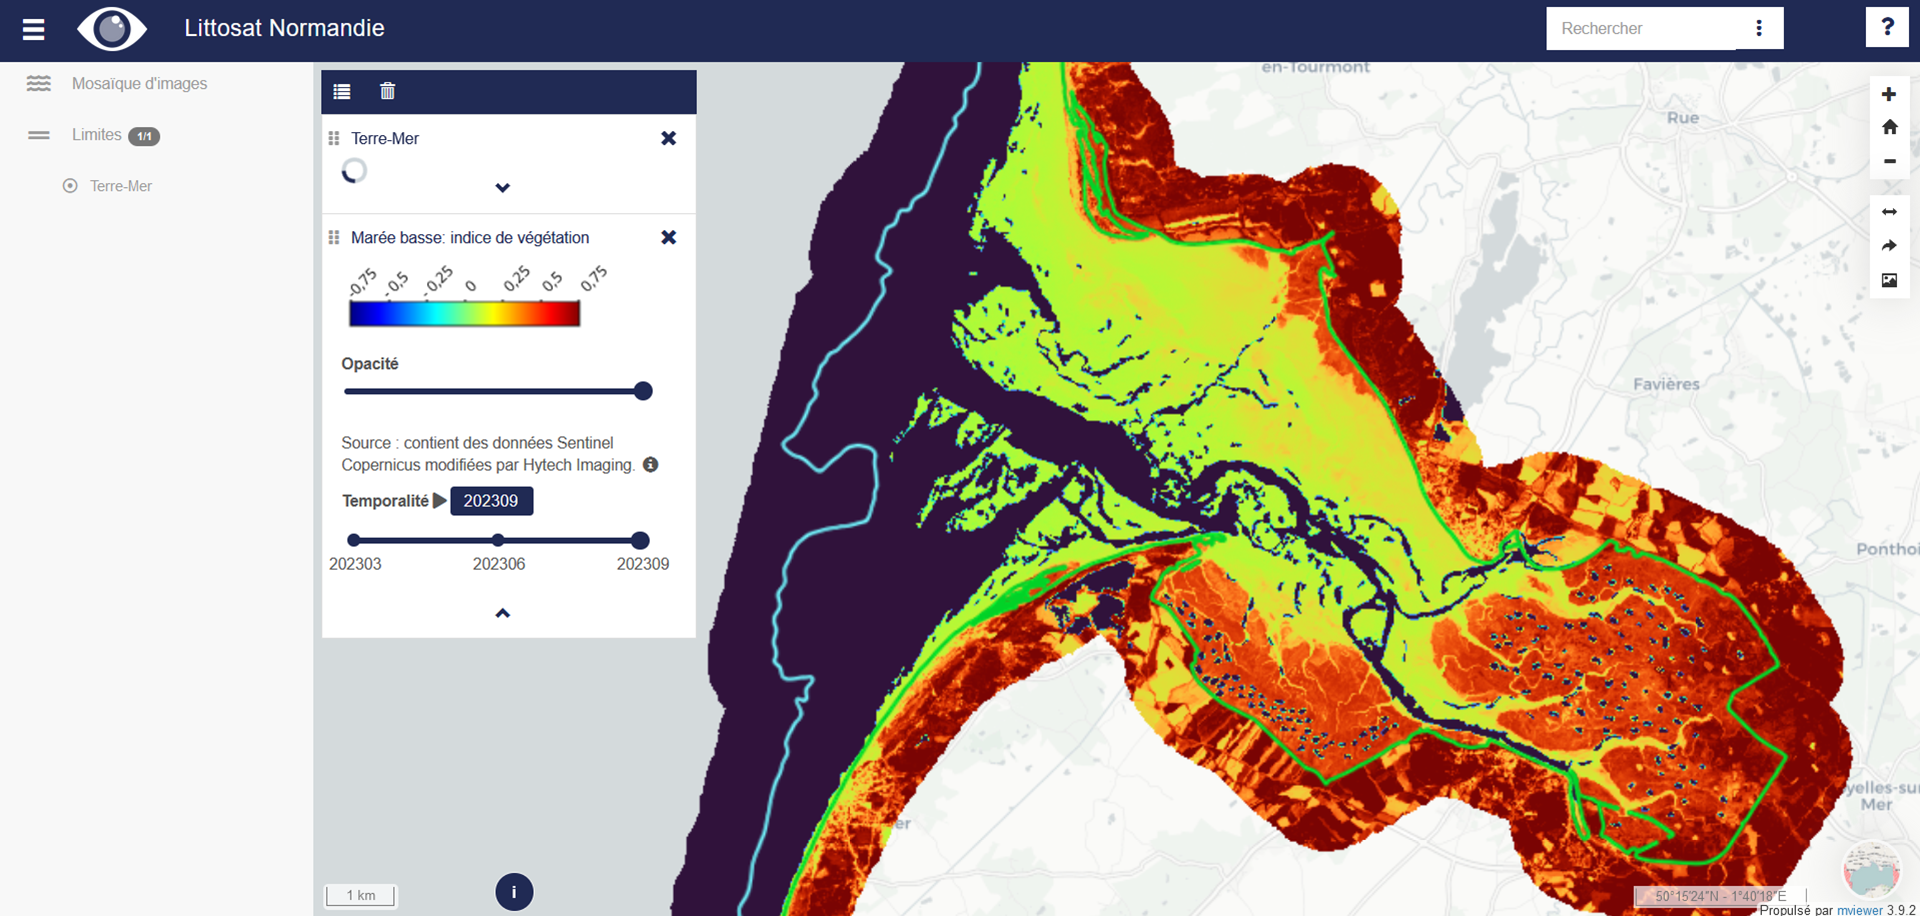
▲ With Littosat Normandie, here over the Baie de Somme, it is possible to visualize changes in vegetation over the seasons. In this example, based on the vegetation index derived from the image mosaic at low tide in the summer of 2023, active vegetation appears in red and orange. © Littosat 👉 Testing the Littosat Normandie platform
|
The project will devote the next few months to producing satellite products on bathymetry and submerged vegetation.