

SCOFrance
40%of the world's population lives within 100 km of the coast
Useful linkProject page
Key wordsCoastline, coastal areas, intertidal areas, multi-sensors, flooding, storms, bathymetry, simulation
OSS Saint Louis takes stock in 2021
Coastal ecosystems are under threat: from unsustainable infrastructure development, poor management of natural resources and habitats, pollution, but also from the impacts of climate change including sea level rise, storm surges and coastal river flooding. These factors increase the vulnerability of the region and its population through increased flooding and coastal erosion.
4 objectives with a multi-sensor approach
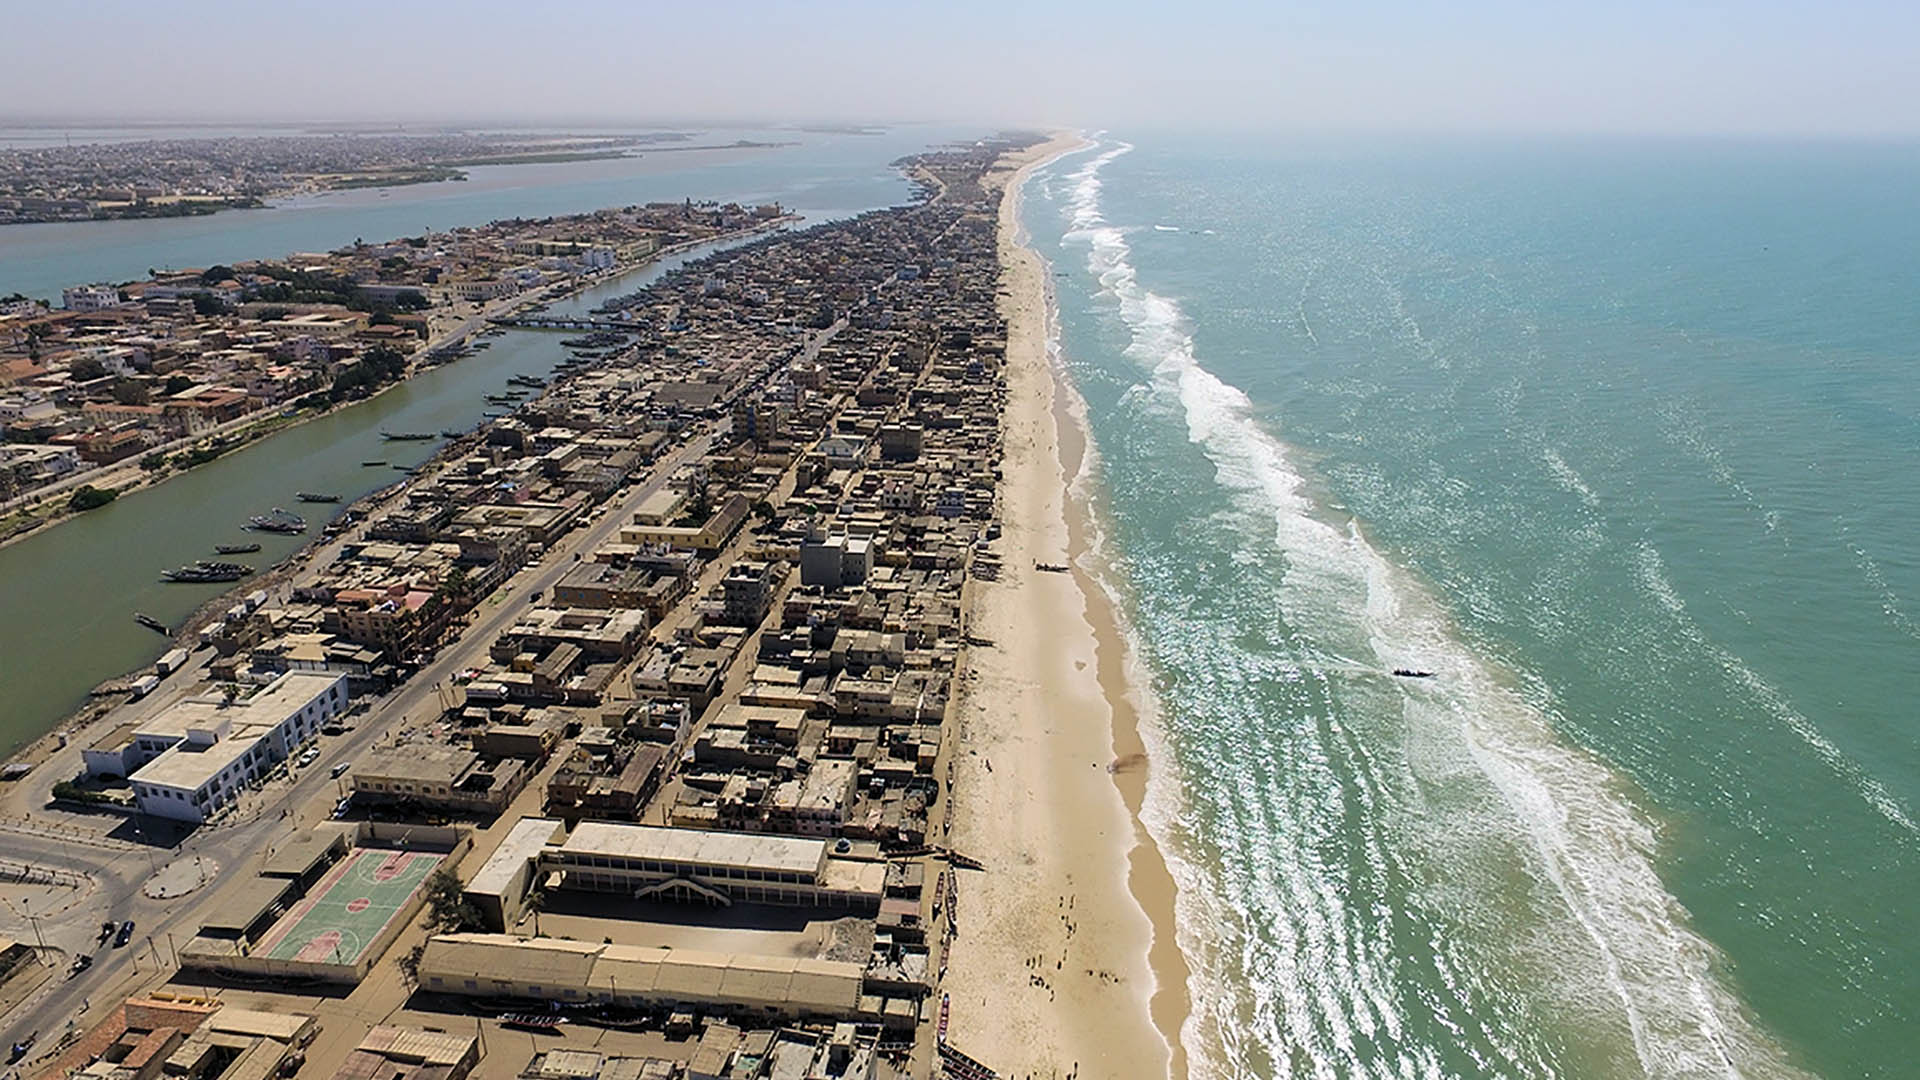
As its name indicates, the project is being tested on the Saint Louis coastline in Senegal, which is representative of the West African coastline. It has four complementary objectives with a multi-sensor approach: existing in-situ data, multi-sensor satellite data, surveys of the population, statistical processing and cartographic simulations.
- To improve our knowledge of multiple hazards and associated risks;
- To define current and future risk hotspots;
- To propose tools and indicators of vulnerability of populations, economic activities and infrastructures;
- To raise awareness of the stakeholders towards a multi-risk vision to respond to the different challenges of coastal areas and co-construct the coastline of tomorrow.
The project is structured in work packages or WPs, of which the following are the 2021 advances.
WP1: Definition of extreme events
- The sea level rise is based on the latest IPCC scenarios, which predict an increase of 60-110 cm in West Africa by 2100.
- Statistical analyses of storm events have highlighted the occurrence of extreme phenomena, characterised by a significant height of 3 metres for at least 24 hours. The Senegalese teams are currently working to build a solid database to understand the intensity and extent of flooding and to quantify the impacts on infrastructure during these storms. As a first step, the team has chosen to develop this approach on two storms in 2018.
WP2: Multi-sensor approach to coastal zone evolution
The first technical step towards the tool consists of producing digital terrain models (including the submerged part) and elevation models, and a land use map. Different methods have enabled the project to define the rates of change of the sea level and the coastline as well as a regional elevation model. The beach slopes are currently being validated. The project also commissioned a series of drone shots to validate the quality of the Digital Terrain Model deduced from Pleiades satellite information.
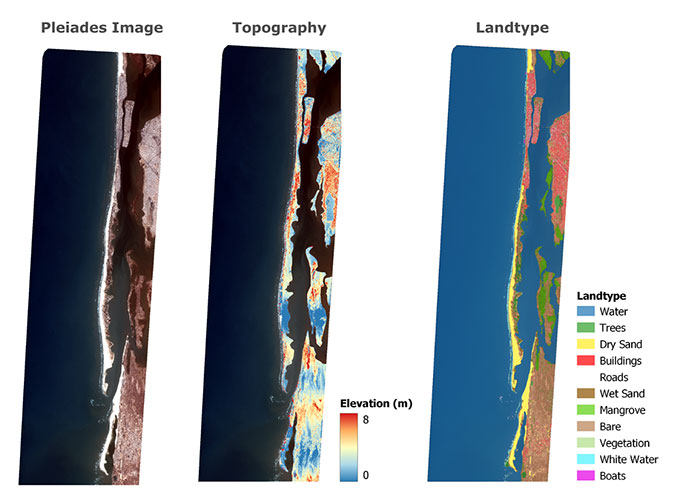
In the centre, the Digital Elevation Model is obtained using two stereoscopic Pleiades images. On the right, the land cover was generated using object-oriented classification from the Pleiades images. © OSS St Louis
WP3: Flood mapping simulation in the context of climate change
For this hydrodynamic modelling stage, it is essential to have precise bathymetry information. The team worked with radar images and wave characteristics for the 10 to 70 m depth range. For the part between 0 and 10 m depth, work is progressing thanks to in-situ bathymetry data, while tests are underway with Sentinel-2 images. Thanks to digital terrain models, it is possible to predict the impact of sea level rise on the area concerned.
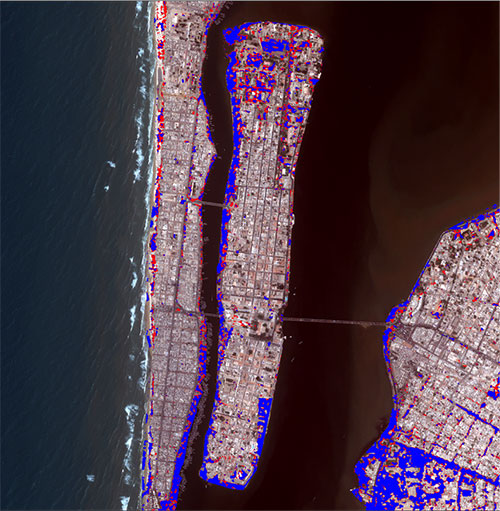
Simulation of flooded areas for a scenario with a mean sea level rise of +60 cm (blue) and +110 cm (red). © OSS St Louis
However, this phenomenon is amplified by a number of other factors that must be taken into account. An index of vulnerability in the coastal zone has thus been determined from the available data. This index is based on morphology, altitude, tide, storms, sea level rise, beach slopes and rates of change. For each of these parameters, the team used a combination of methods: existing data (database), field data acquisition, algorithmic processing of satellite images. Work is underway to improve the consideration of storm impacts, and in particular wave-related overtopping.
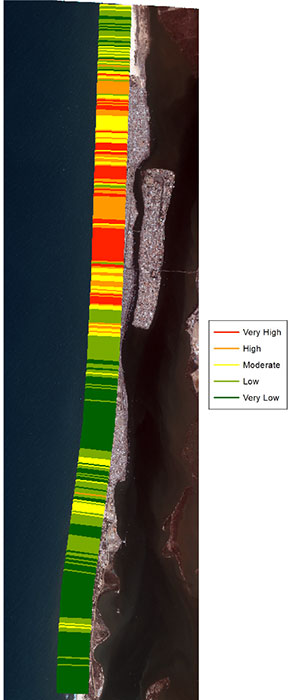
Results of the calculation of the coastal vulnerability index on the Langue de Barbarie. It is clear that the southern part is much less vulnerable, which could be used in the event of the need to move people. © OSS St Louis
Activities planned in 2022
In the continuity of the actions undertaken, the year 2022 will be dedicated to finalize the WP1, 2, 3 and actively start the WP4, Operability and transposability, and 5, Awareness raising of actors & decision makers. For the latter, contacts have already been made with national and local actors in order to transform the scientific results of the project into actions on the ground.
Bonus!
Some coastlines have intertidal zones, which may or may not be exposed depending on the tides. Covering 127,921 km2 worldwide, these areas constitute a unique habitat, generating resources and ecosystem services. To understand the challenges of satellite monitoring of these intertidal zones, the project team produced a short video for the Science festival, which can be viewed here (in French).