

Pléiades4UrbanFlood
 on October 20, 2018.")
Pléiades' contribution to adapting the urban fabric to flood risk
Project completedEight monoscopic Pléiades/Pléiades Neo images were used to map land use (LULC) at the Grabels study site over the period 2012-2024. These LULC maps were used to create a meta-model of the area to estimate flood risk and characterize its evolution in a context of increasing urbanization, taking into account climatic events such as droughts and fires. The project thus illustrated how changes in land use, such as the transformation of vegetation strata into bare soil following the 2017 fires and recent urban densification, influence runoff dynamics for a rainfall event such as the one that occurred in Grabels in 2014.
The main results are freely available on the Greencity visualization platform, developed as part of the SCO GreenUrbanSat project.
OVERVIEW
Flooding has increased significantly over the past several decades, particularly during exceptional flooding events that have affected several European countries, including France. Intense rainfall, linked to climate change, poses a greater risk to urban and heavily anthropised environments. As a result, climate change is becoming an increasingly important factor in land management, particularly in terms of resilient planning in the face of increased flood risk. To this end, this project reports on the topography of artificial and natural objects in this urban network through meta-modelling composed of two numerical parameters: friction (Strickler coefficient - Ks) and infiltration capacity (Curve Number - CN), which are essential for realistic flood modelling.
In this context, responses have been provided to the two major challenges identified:
- Producing morphological data on the artificial and natural elements of a territory without using stereo but using monoscopic images*, based on texture analysis and cast shadows;
- Using only satellite land cover information as input data for hydraulic modelling of flood risk.
Methodology
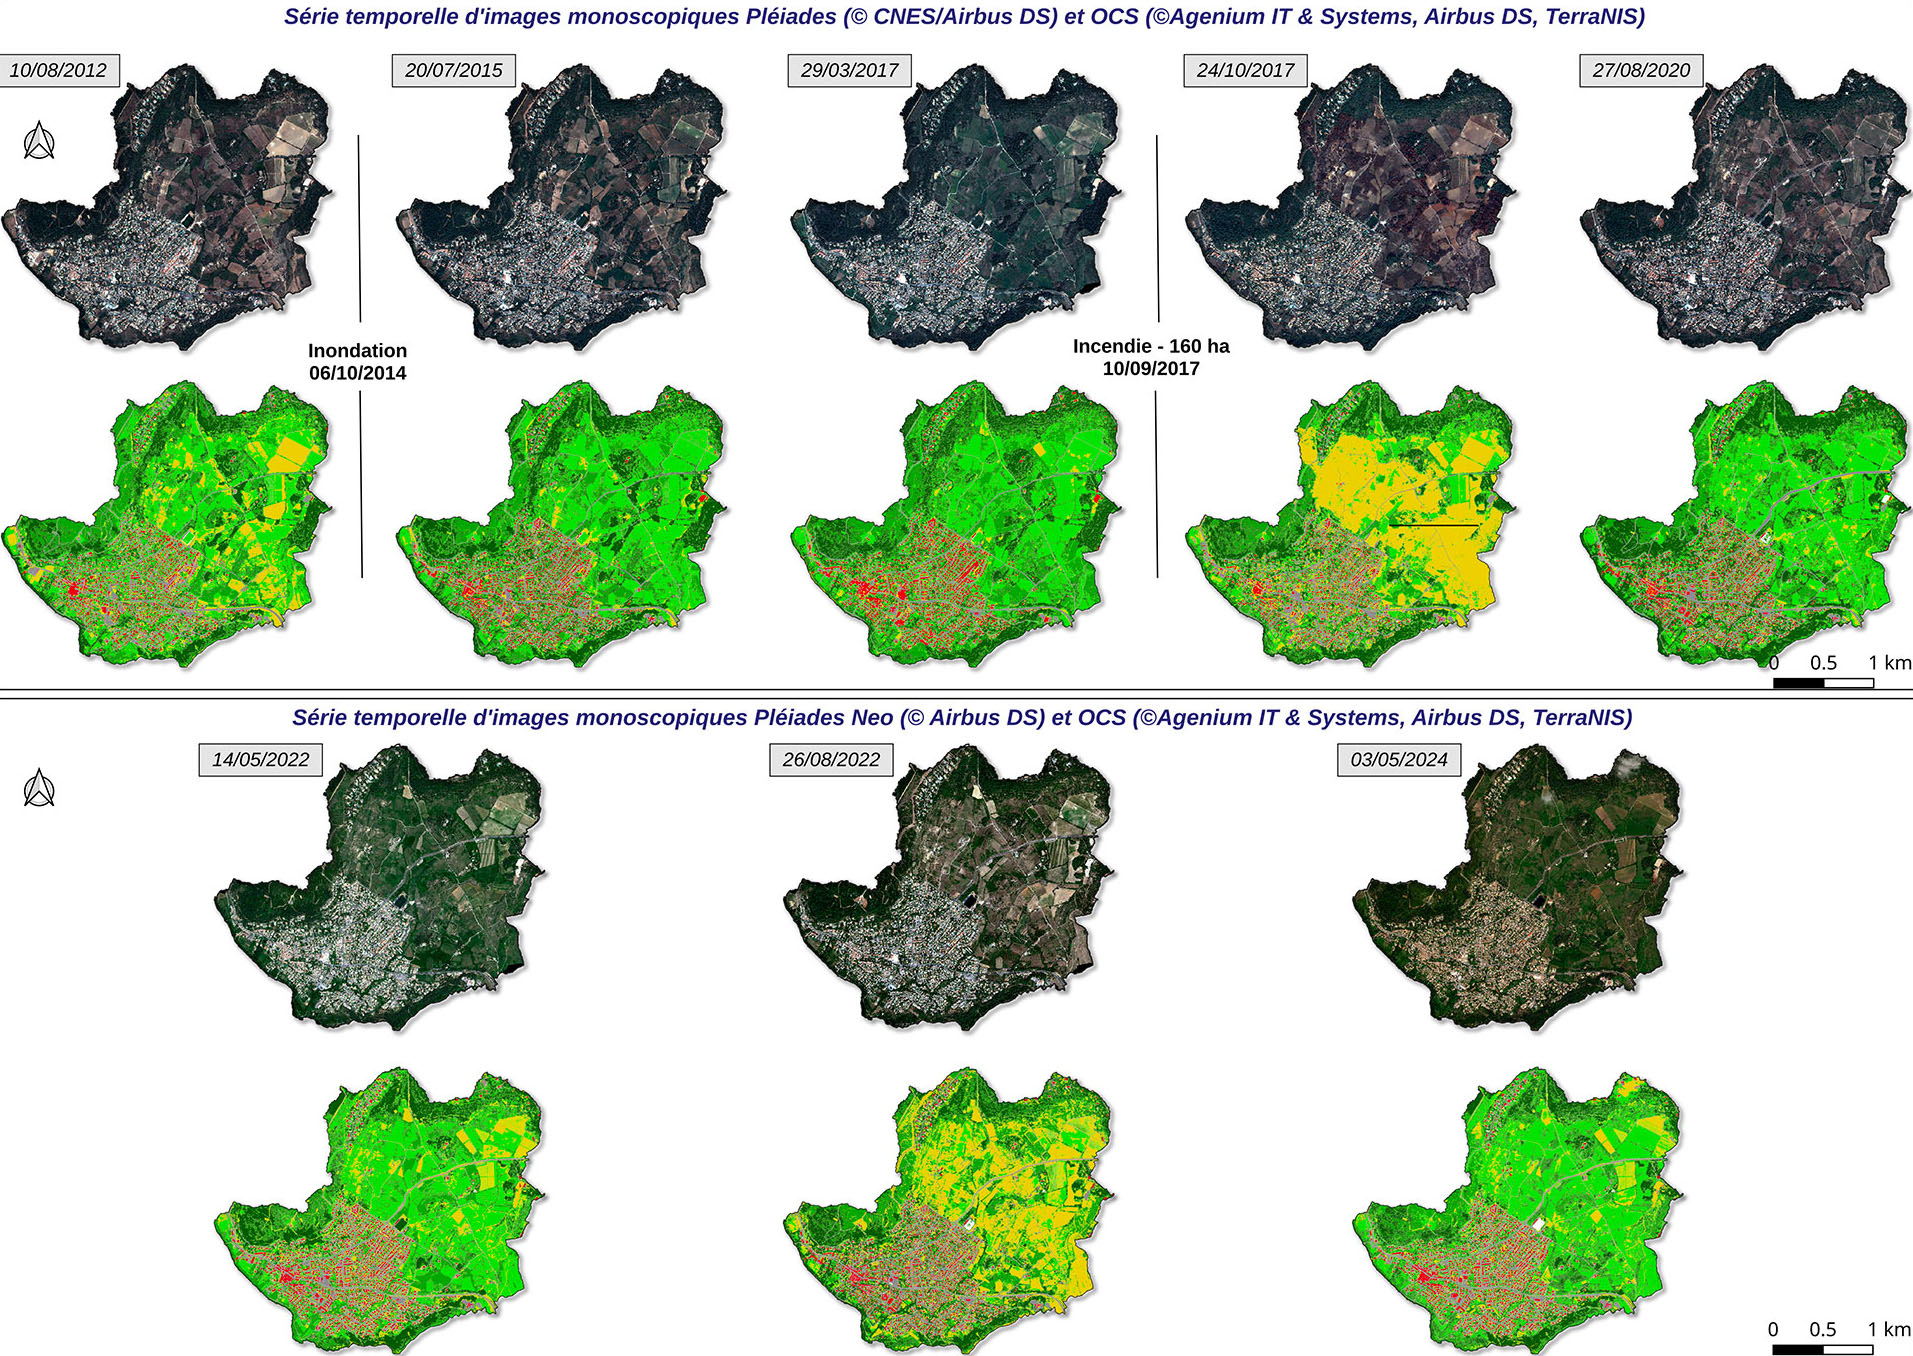
Initially, the project produced eight land cover layers obtained from monoscopic images* Pléiades and Pléiades Neo in order to reduce production costs and be able to use the large existing image archive databases. The detection and estimation of building and vegetation height was based on the characterization of building shadows and image texture using a hybrid approach to environmental classification through deep learning from these eight images.
In a second step, this land cover layer (LULC) was used for an initial characterization of each type of urban structure (e.g. road, dirt track) or vegetation (forest, field, etc.) in terms of infiltration coefficient (CN) and friction coefficient (𝐾𝑠) for each of the eight images. This meta-modelling feeds into the two-dimensional hydraulic runoff model and makes it possible to assess the impact of changes in land cover potentially linked to climate change (e.g. fires) on flood risk (maximum water speeds and heights reached) using the characteristics of the 2014 event (example of maximum water height in Fig. 4) and considering more intense precipitation episodes, developed in accordance with IPCC projections.
* Monoscopic imaging provides a single shot of a given landscape, while stereoscopic imaging consists of generating two images of the same landscape taken from different angles in order to reconstruct the third dimension (height).
Application site(s)
Grabels, France (in the Montpellier Méditerranée Métropole intermunicipal area)
DATA
Satellite
- Pléiades
- Pléiades Neo
RESULTS – FINAL PRODUCTS
The main results are freely available on the Greencity visualisation platform (developed as part of the SCO GreenUrbanSat project).
The visualization tool allows you to display:
|
Fig1. Pléiades and Pléiades Neo images and their associated LULC maps. © Cerema/TerraNIS |
- the share and evolution between 2012 and 2024 of:
|
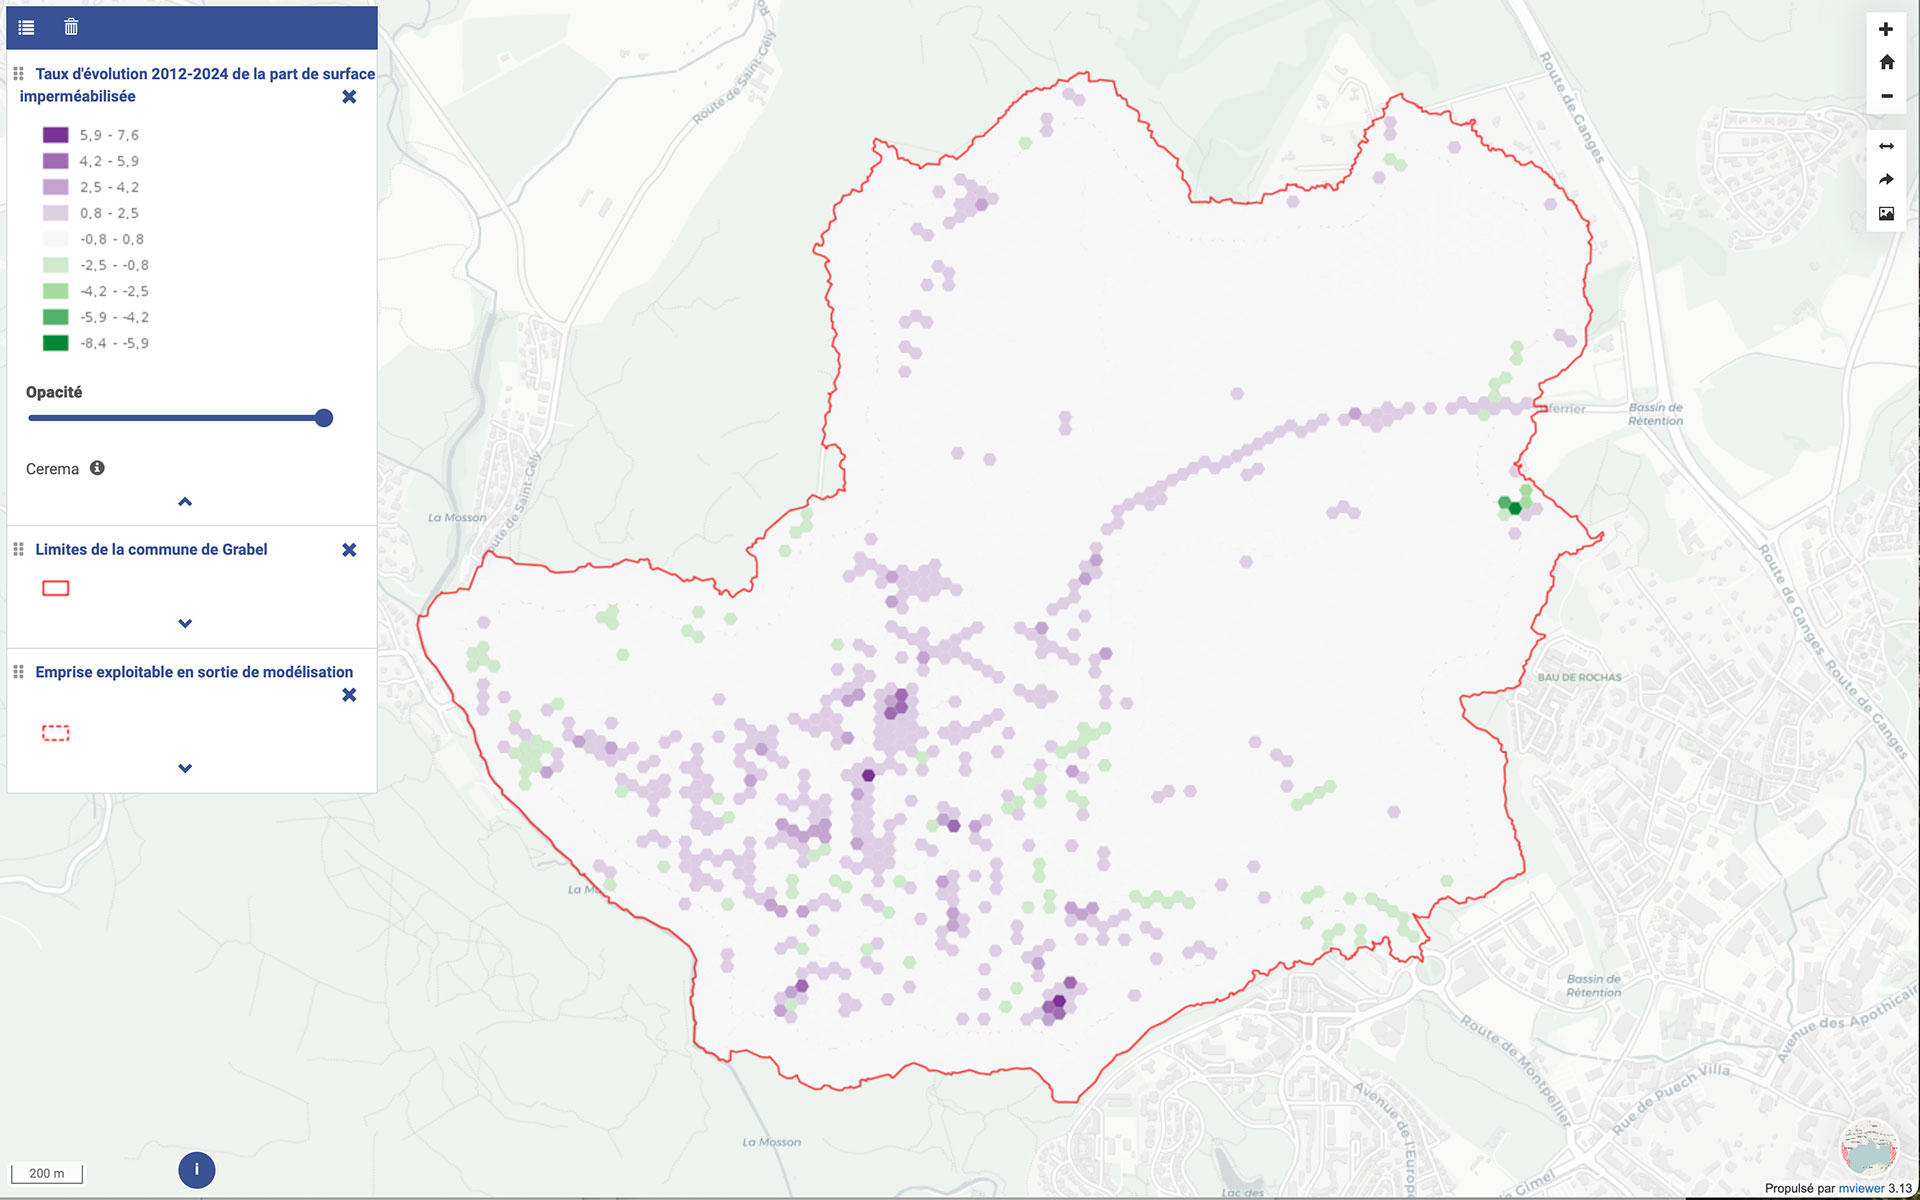
👉 the waterproofed surface
Fig. 2 Map showing the evolution of impervious surfaces between 2012 and 2024. © Cerema/TerraNIS |
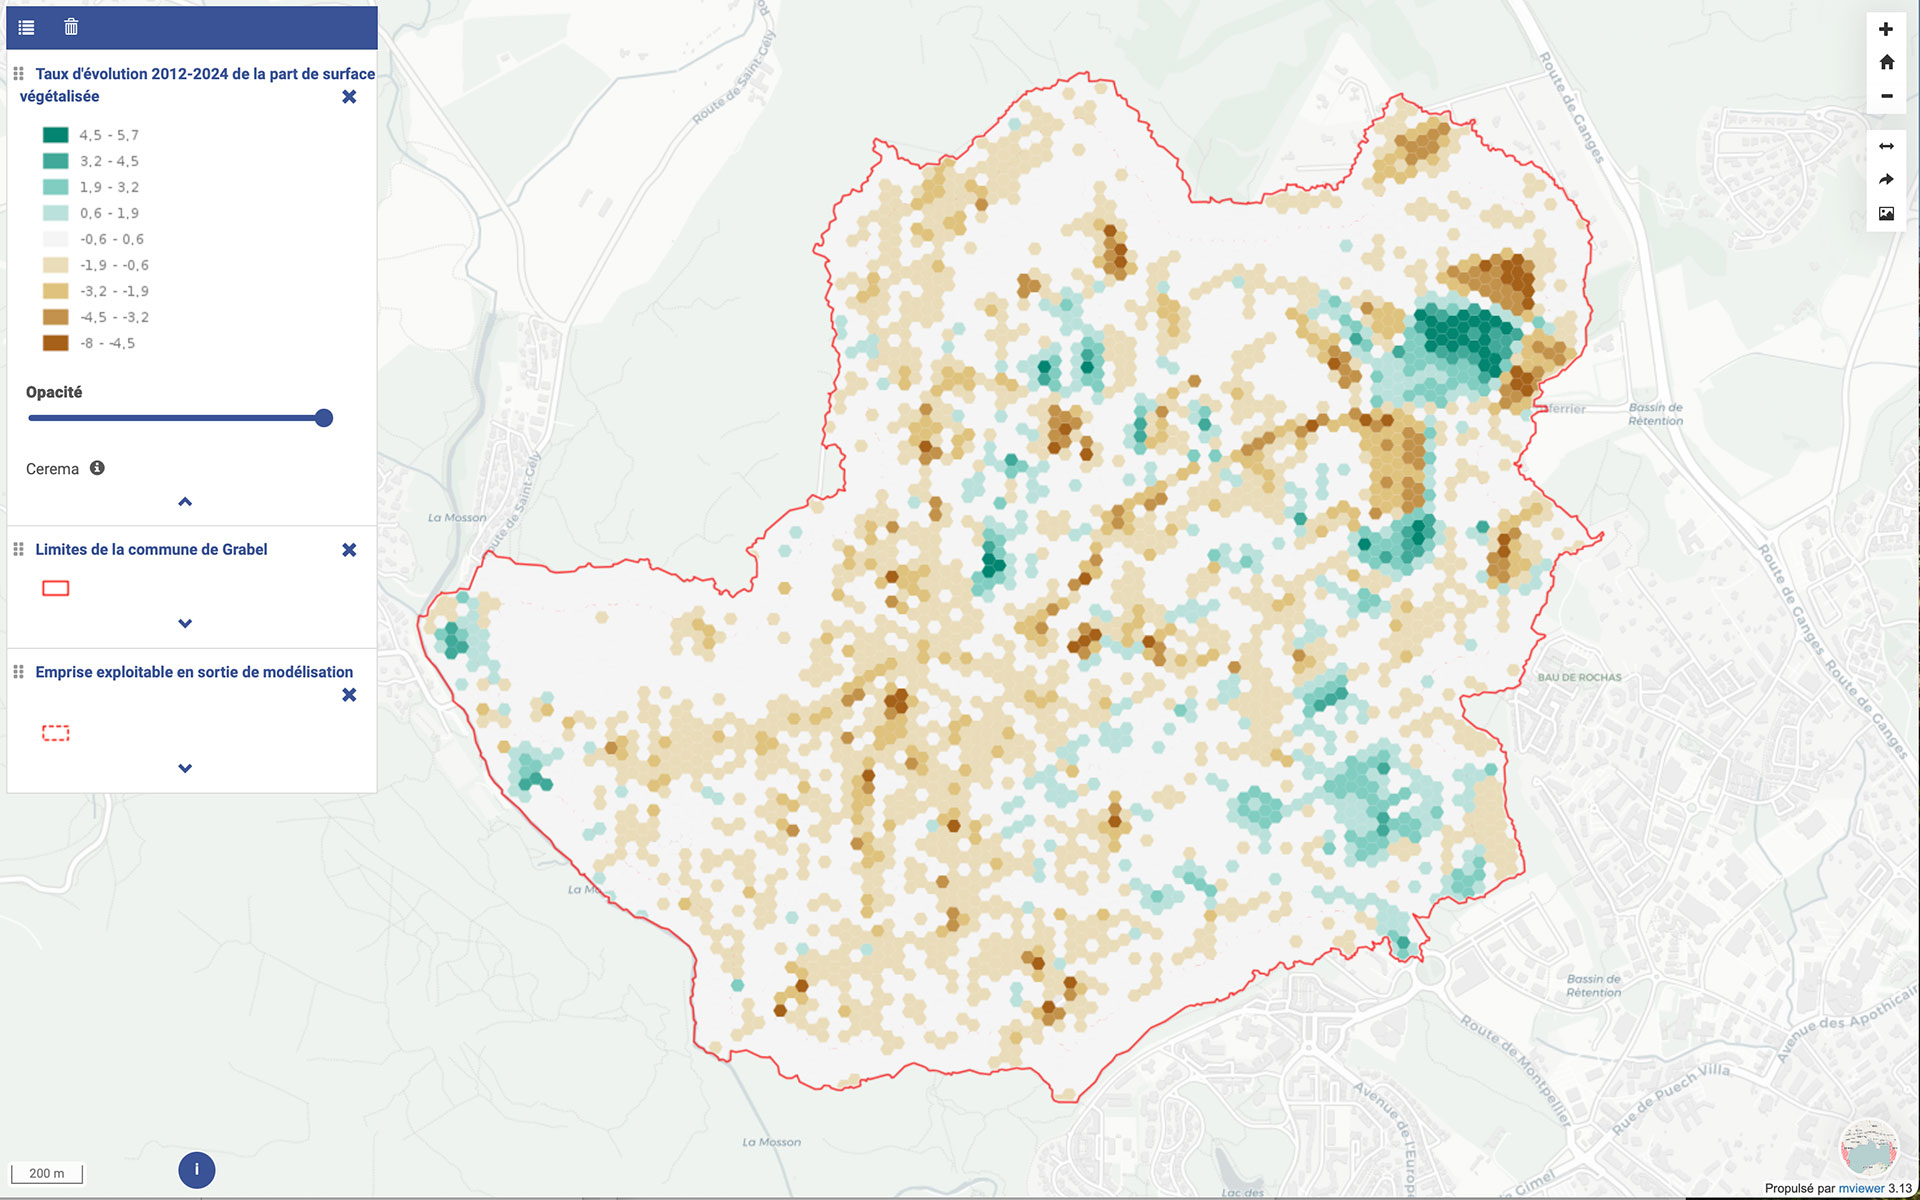
👉 the vegetated surface area
Fig. 3 Map showing changes in vegetated surface area between 2012 and 2024. © Cerema/TerraNIS |
- the impact of changes in land use on:
|
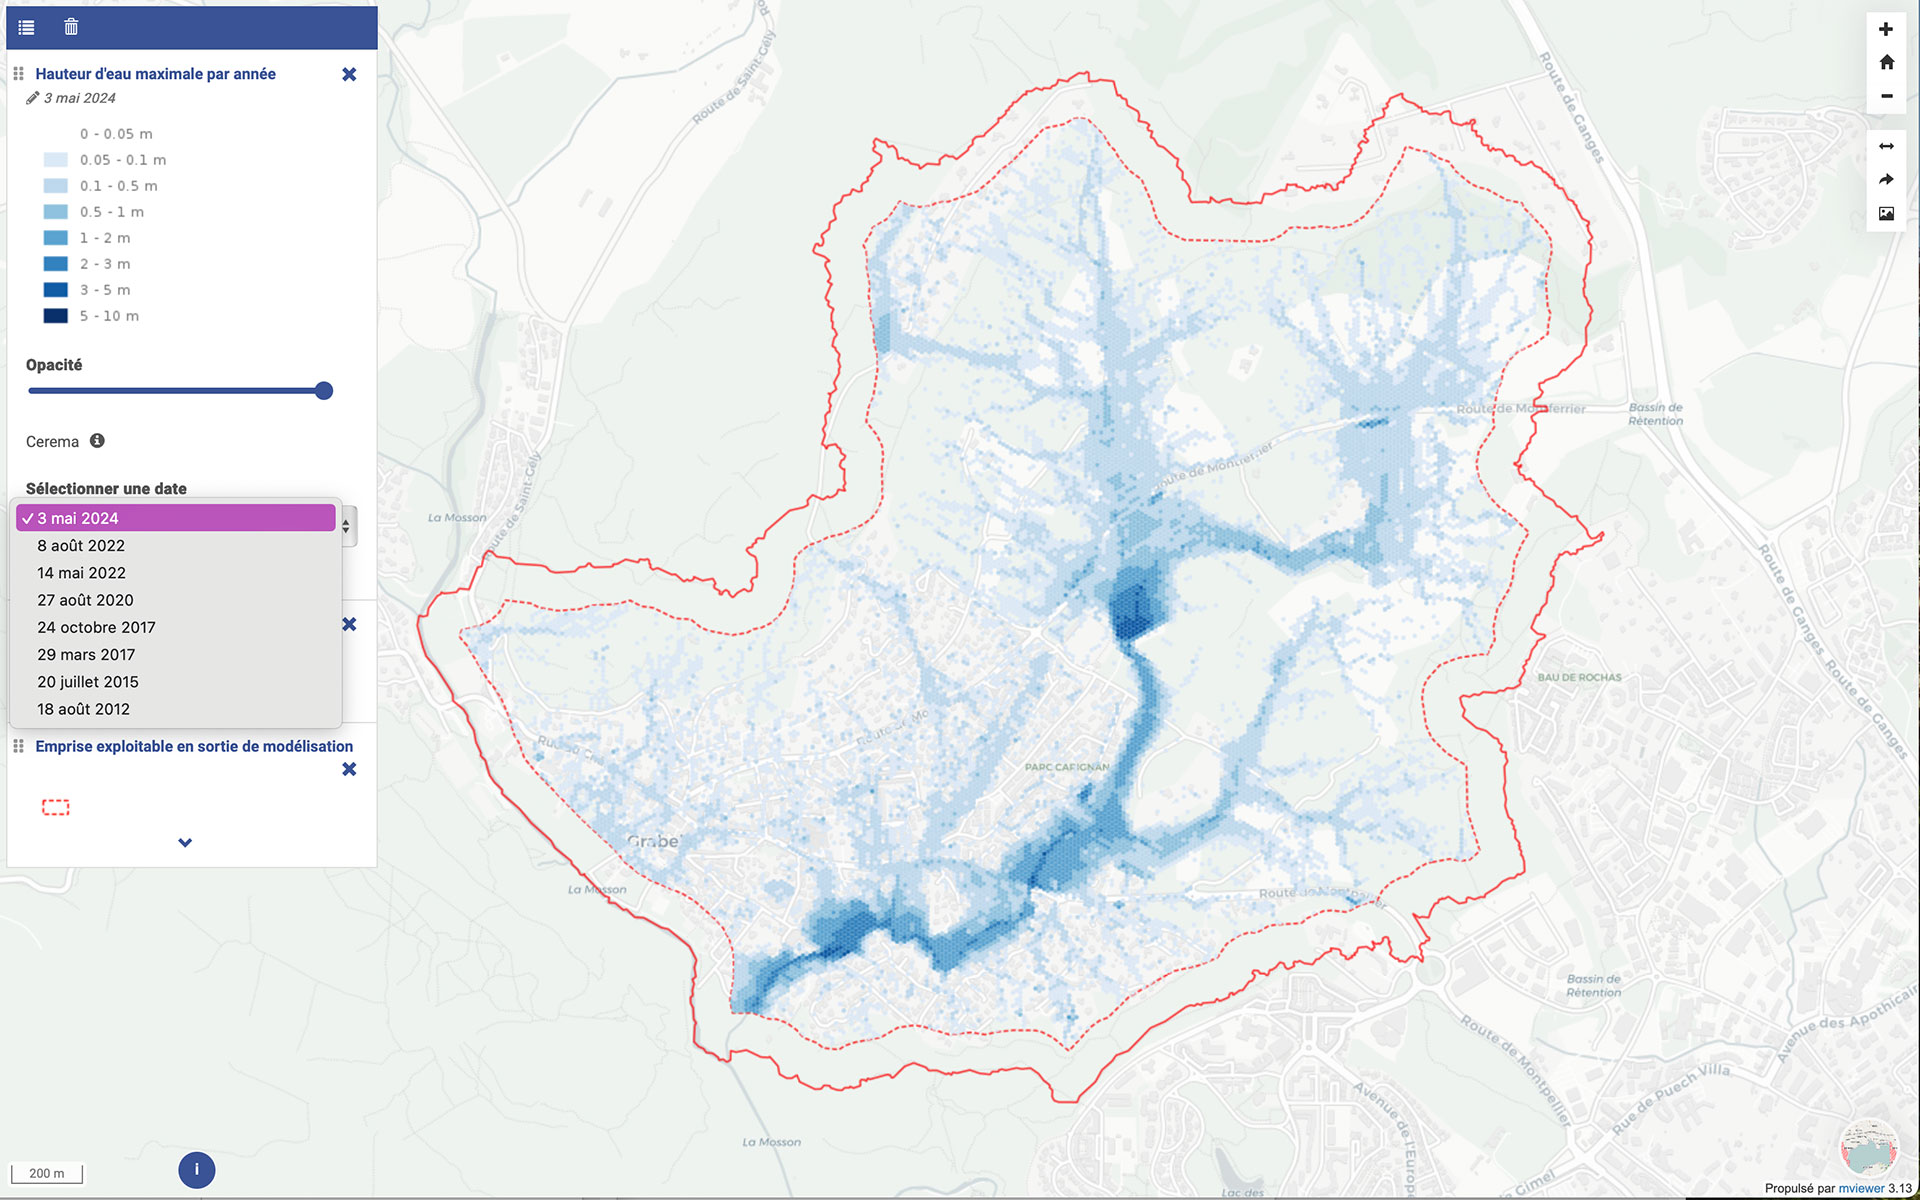
👉 maximum water level (for an event similar to the 2014 episode)
Fig. 4 Map of maximum water levels obtained for a 2014-type event on a 2024 LULC layer. The solid line delimits the area of interest used to produce the LULC, and the dotted line delimits the spatial boundary of the hydraulic modelling. These water level values were averaged over 20 m polygons. © Cerema/TErraNIS |
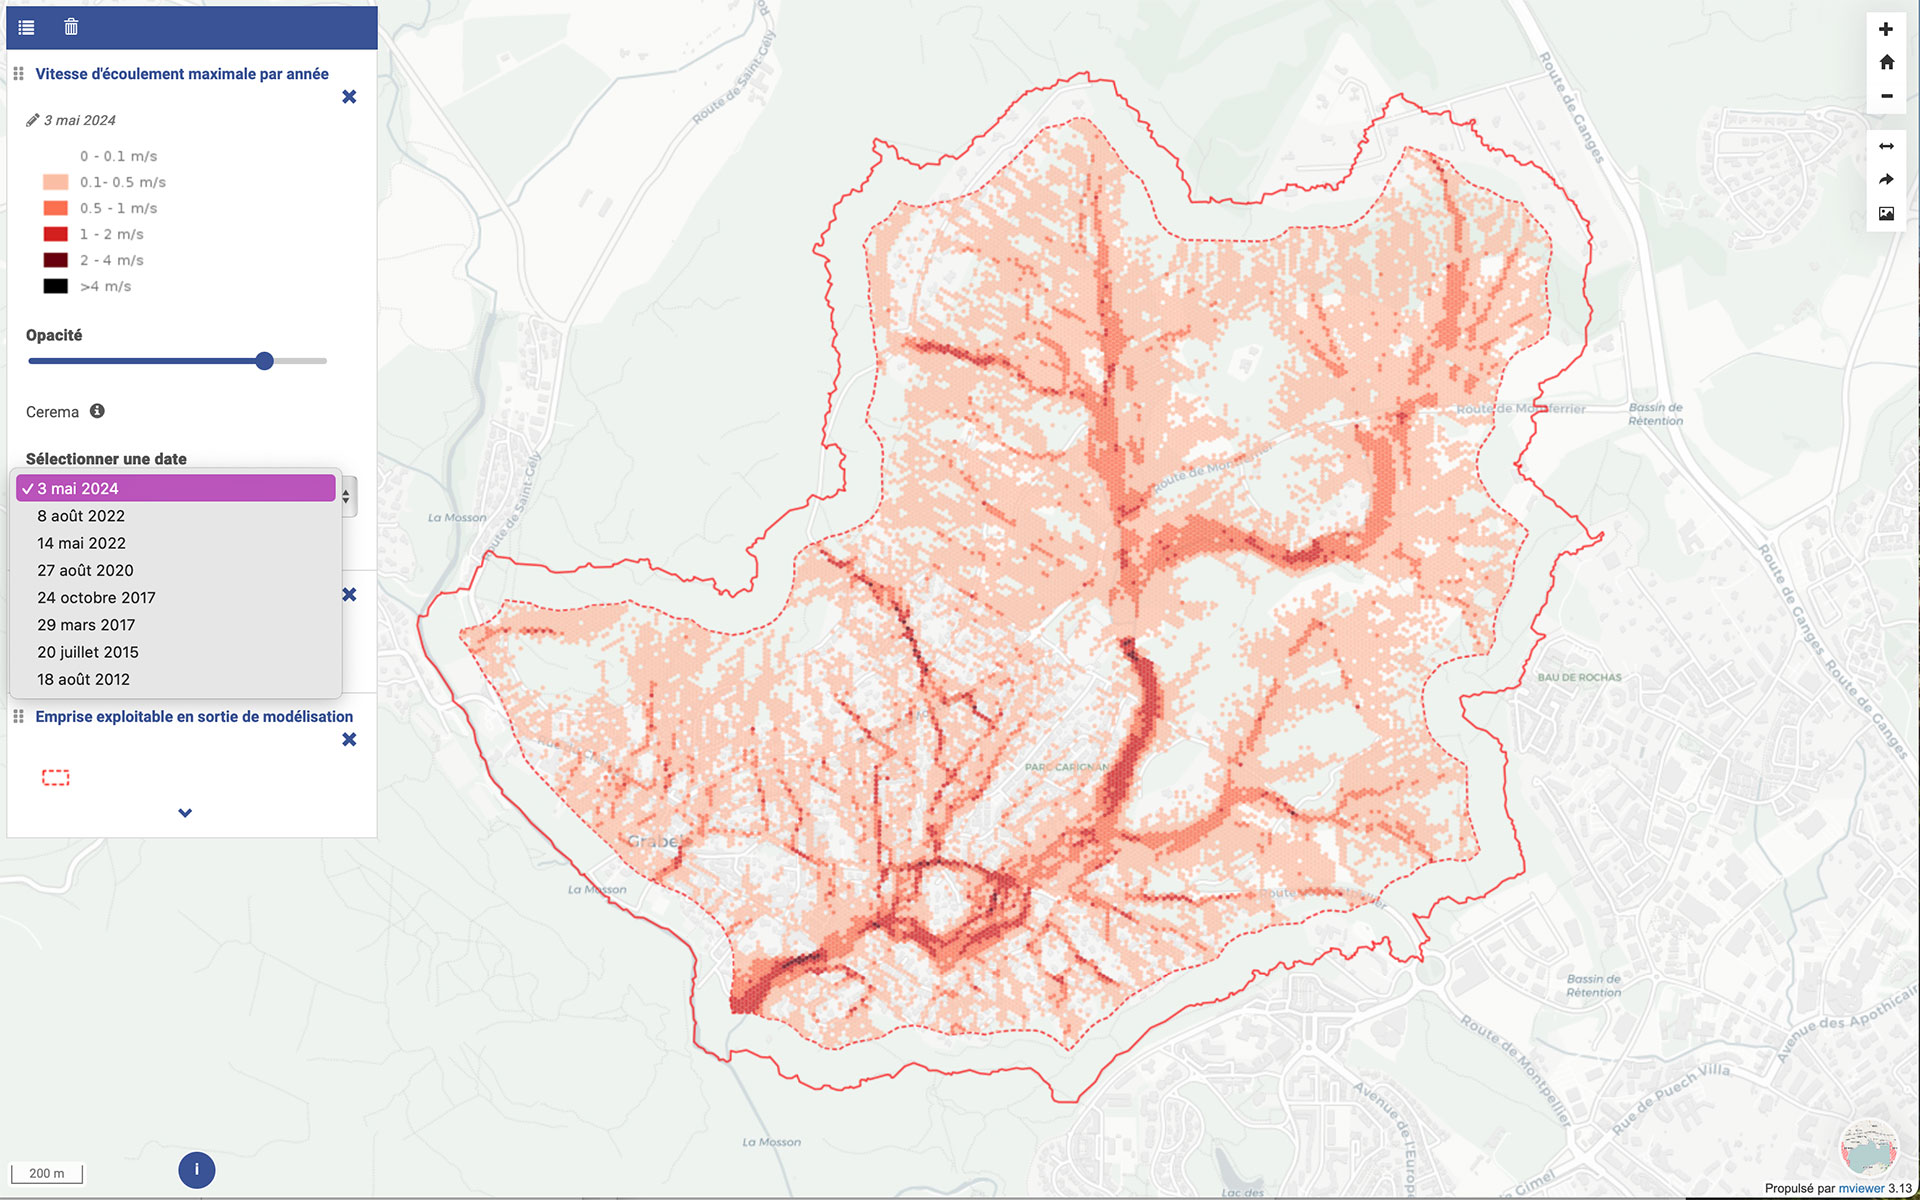
👉 maximum flow velocity (for an event similar to the 2014 episode)
Fig. 5 Map showing changes in maximum flow velocity for a 2014-type event on a 2024 LULC layer. © Cerema/TerraNIS |
References
| Pléiades4UrbanFlood on GEO Knowledge Hub, a long lasting digital repository created by the Group on Earth Observations: https://doi.org/10.60566/gxa8d-t6t06 |
- Bertola, M. et al. 2020. Flood trends in Europe: are changes in small and big floods different? Hydrology and Earth System Sciences 24, 1805–1822.
- Bevacqua, E. et al. 2019. Higher probability of compound flooding from precipitation and storm surge in Europe under anthropogenic climate change. Science Advances 5.
- Nair, V. et al. 2019. Shadow detection and removal from images using machine learning and morphological operations. The Journal of Engineering 1, 11-18.
- Robinson, C. et al. 2020. Large scale high-resolution land cover mapping with multi-resolution data. Proceedings of the IEEE/CVF Conference on Computer Vision and Pattern Recognition.
- Sameen, M. I. et al. 2018. Classification of Very High Resolution Aerial Photos Using Spectral-Spatial Convolutional Neural Networks. Journal of Sensors 2018.
- Tabari, H. 2020. Climate change impact on flood and extreme precipitation increases with water availability. Scientific Reports 10, 13768.
- Wang, Y et al. 2018. An integrated framework for high-resolution urban flood modelling considering multiple information sources and urban features. Environmental Modelling & Software 107, 85-95.
Project news
-
January 20, 2025: P4UF has automated satellite-based hydraulic modeling (demonstrator presentation)
-
15 to 17 October 2025: Presentation at the 31st edition of the TELEMAC User Conference
-
23 to 27 June 2025: Presentation at the Living Planet Symposium 2025 conference
-
2 to 4 June 2025: Presentation at the SimHydro 2025 conference
-
19/05/2025: P4UF, a pioneering flood risk assessment project (first results)
-
April 1st and 2nd, 2025: Presentation at the 5th edition of the TEMU (Remote Sensing for Urban Environment Studies) scientific workshop organised by Data Terra
-
19/12/2024: Presentation of the P4UF project and its progress at the 15th SCO France Quarterly Meeting "Making the most of high-resolution imaging in the city: flooding and heat islands"
-
11/03/2024: Pléiades 4 Urban Flood: start-up in situ
-