

SCOFrance
PartnersCEREMA, AIRBUS DS, CNES
Useful linksCartagene LCZ portal
KeywordsUrban climate, heat vulnerability, urban overheating, urban heat islands, adaptation, app
SatLCZ has given rise to the Local Climate Zone Mapping portal in France
|
This is the kind of story we love: a project that delivers a relevant, easy-to-use and freely accessible tool. Three years after the end of the SCO SatLCZ project, CEREMA, the French Agency for Ecological Transition,informs us that the algorithms developed have made it possible to generate a map of local climate zones (LCZ) for 88 urban areas with more than 50,000 inhabitants in mainland France. This production was co-financed by the Ministry of Ecological Transition (Directorate-General for Planning, Housing and Nature). |
88 urban areas = 12,000 municipalities = 44 million inhabitants = 67% of the population of mainland France |
Freely accessible on CEREMA's Cartagene portal, the app allows users to view the sensitivity of different neighborhoods to high temperatures and thus support the adaptation strategies to be implemented. For citizens, it is also a practical tool for finding out whether their current or future home is located in a neighborhood that is vulnerable to heat.
Let us remember
SatLCZ is one of those projects we call "pioneering" because they develop methods and algorithms that enable satellite data to be used for a specific purpose and then make it available to the community.
|
For its part, SatLCZ, one of the very first projects to receive SCO accreditation in 2020, has developed a methodology for automatically classifying Local Climate Zones (or LCZs) based exclusively on very high-resolution satellite images. Developed and tested in two very different cities – Lille in France and Rayong in Thailand – to ensure its reproducibility, the SatLCZ method makes it possible to estimate the degree of exposure to the heat island phenomenon in urban neighborhoods. |
LCZs in brief Local climate zones (LCZ) are an international reference system for urban climatology. Identifying LCZs requires the production of geographical layers describing urban morphology (average height and surface area of buildings, proportion of built-up and impervious surfaces) and land use (bare soil, water surface area, vegetation). |
As Arnaud Ceyte, head of Cerema's satellite division, points out, "SatLCZ built on pioneering work undertaken upstream by Cerema. The SCO co-financing of the project, carried out in partnership with Airbus DS, acted as a catalyst for scaling up by developing a robust and replicable operational methodology for producing LCZ data from satellite data. As a result, Cerema's satellite division has been able to produce LCZ data on a massive scale at the national level, thanks to the strategic and financial support of the DGALN (Directorate-General for Planning, Housing and Nature). This data is now made available free of charge to local authorities to support them in their climate change adaptation strategies, particularly in the areas of urban planning and ICU management.”
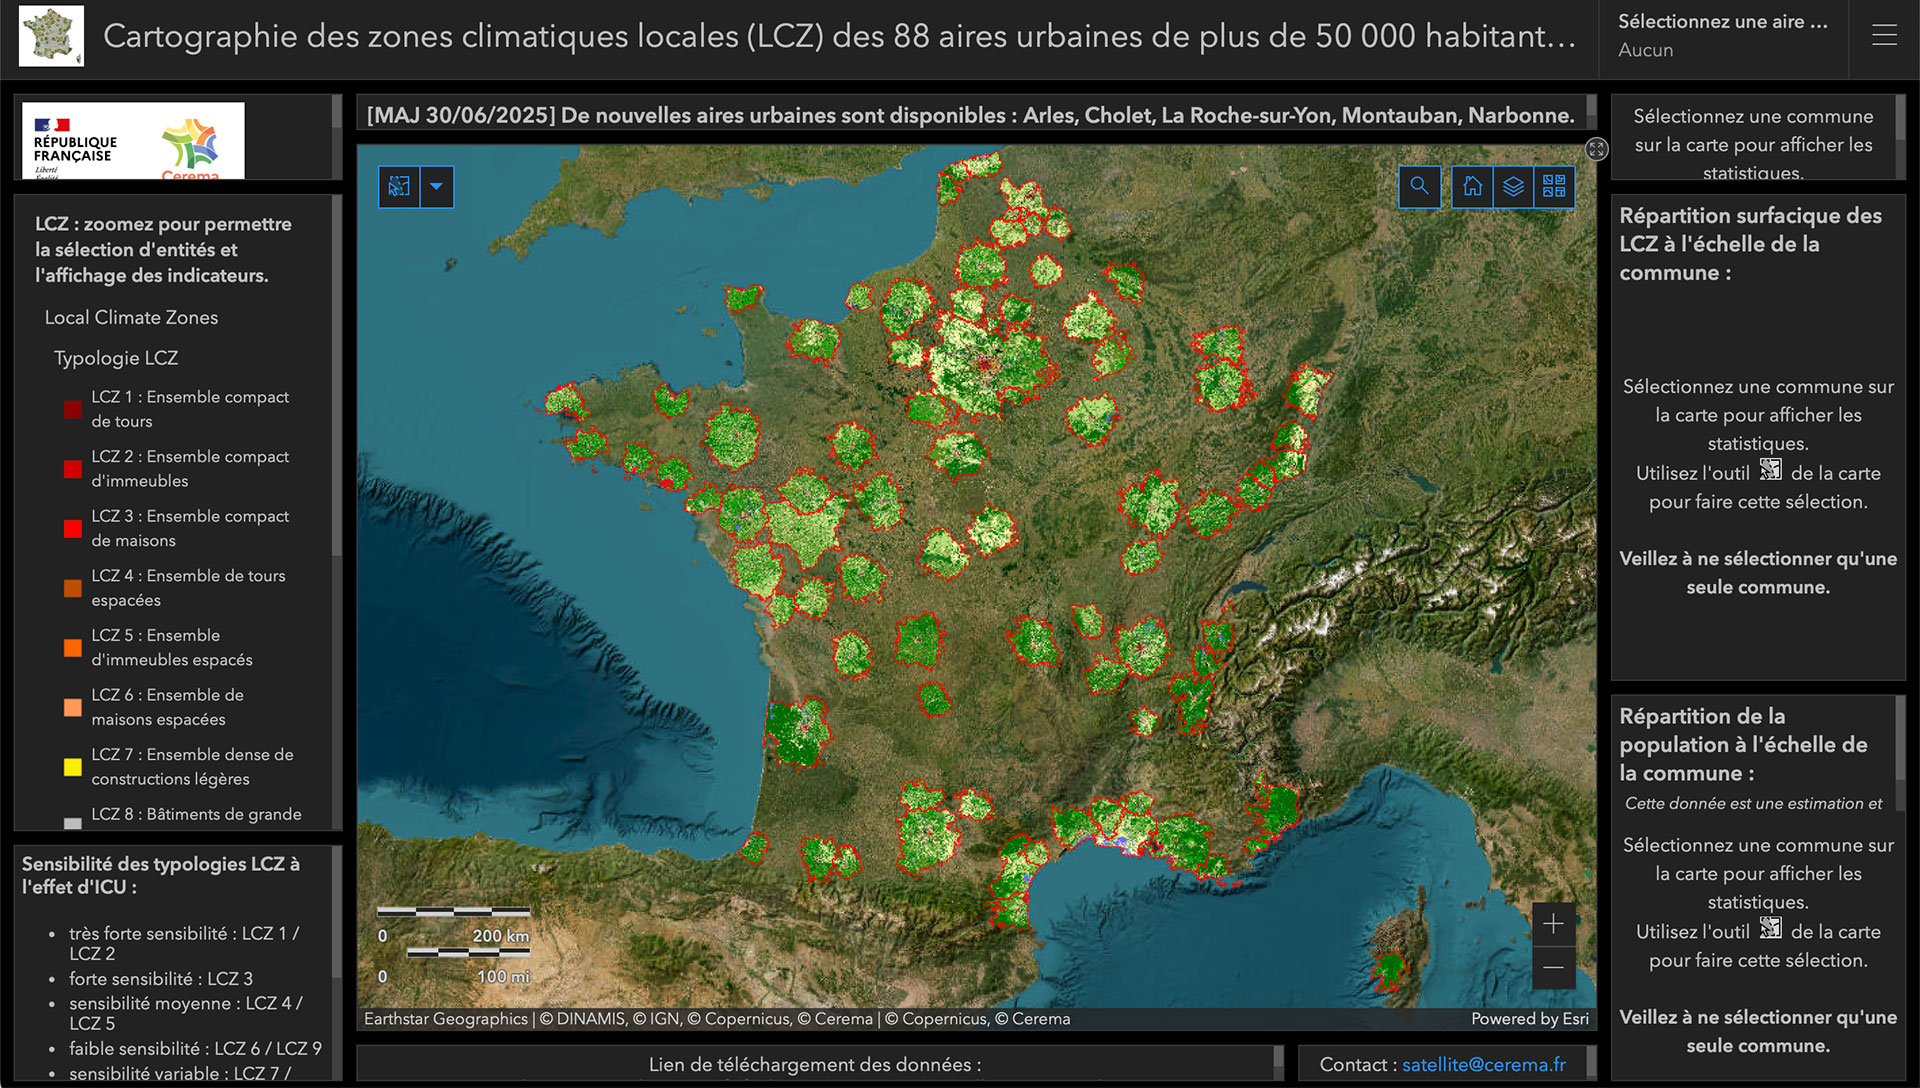
Today, a self-service tool available throughout France
All of France? Yes, because production in the overseas territories is already underway! Cerema has developed a new segmentation methodology to produce LCZs for areas not covered by Urban Atlas data. And the result is simply remarkable: an open interface with hyper-intuitive functionality. The colors and indicators are perfectly clear, even if you know nothing about LCZs.
At the same time, all the data is available as open data on data.gouv, where it is accompanied by a document describing the methodology and a user FAQ.
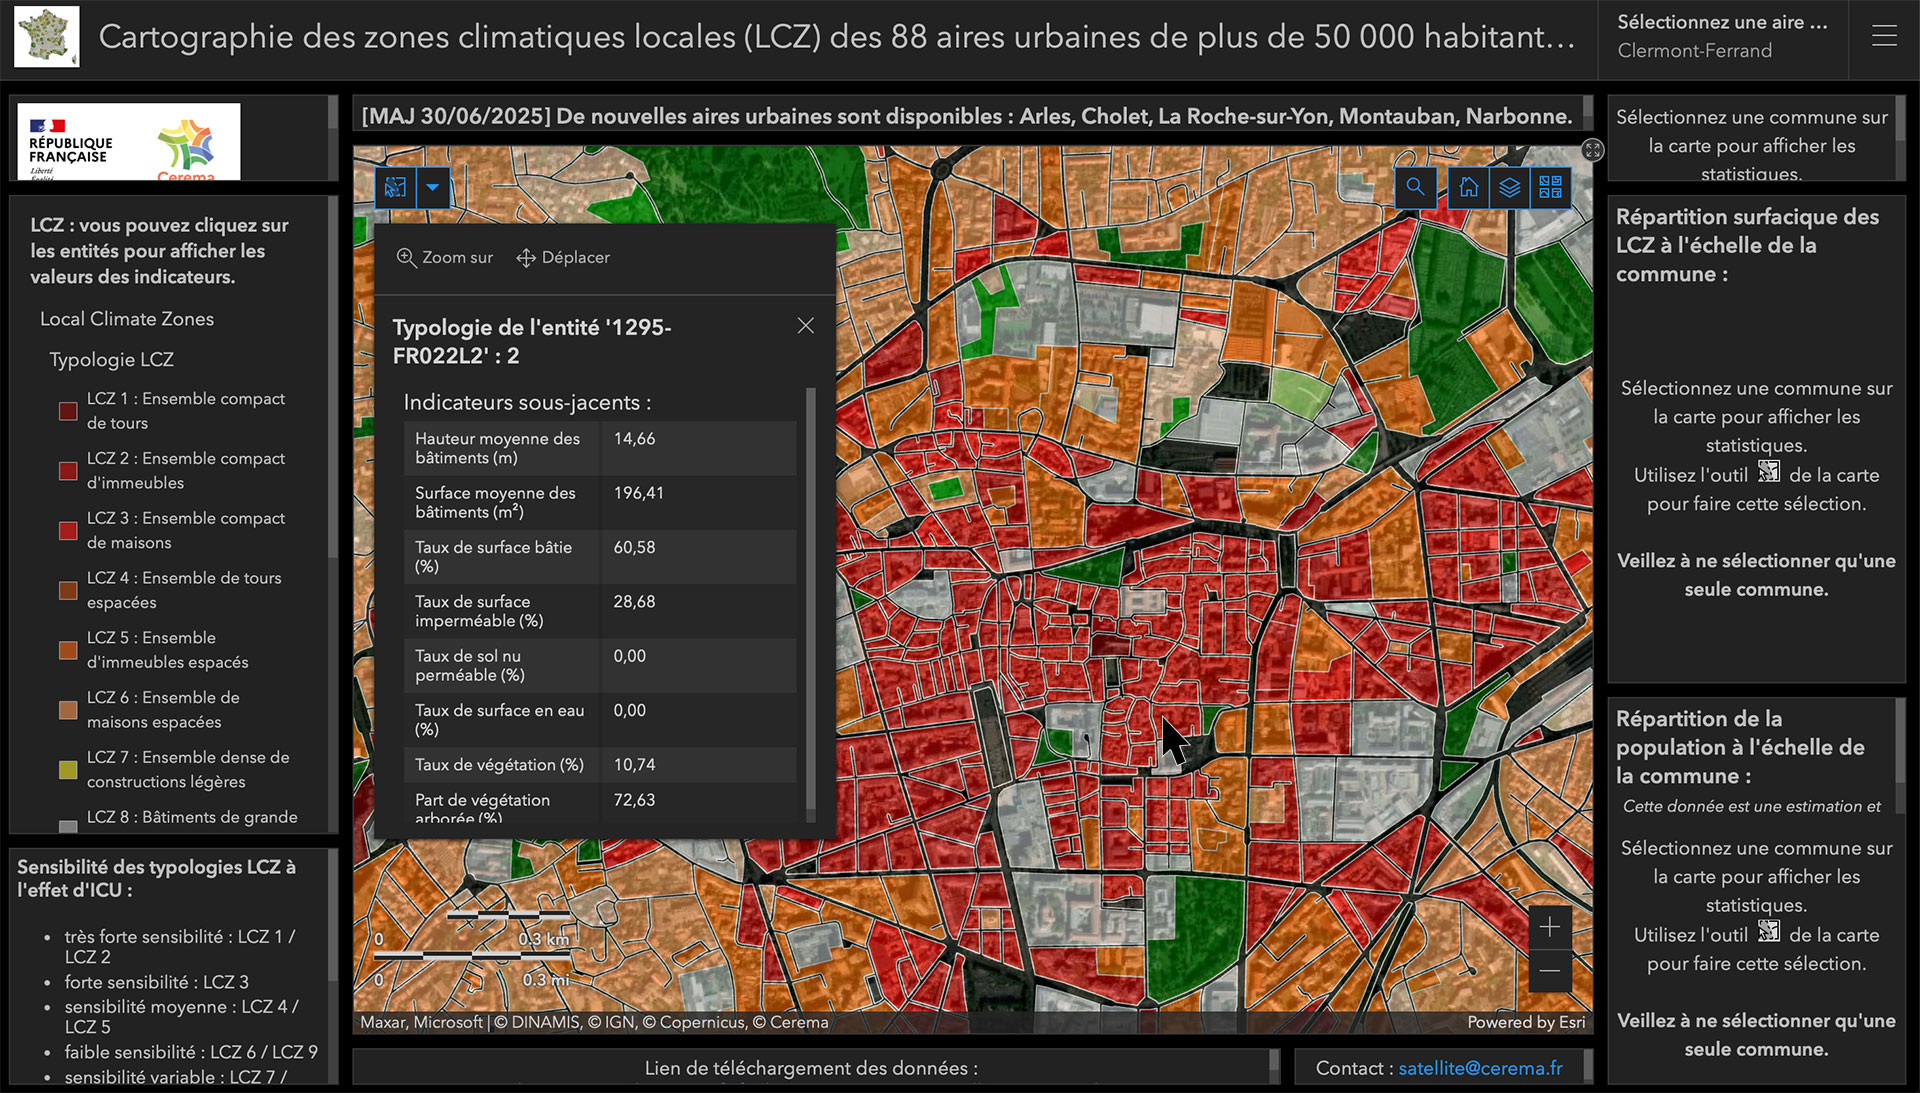
▲ We tested it out: the portal ticks all the boxes for a practical and accessible tool. Simply choose the city, click on the neighborhood you are looking for, and the results are immediate. For example, here is some typical information about a neighborhood in Clermont-Ferrand, in the center of France. © CEREMA
"SatLCZ is a good example of how Cerema's research work can be used to produce data that is relevant to its expertise missions in the regions, but also accessible to other public and private actors," says Julien Bouyer, a researcher in Cerema's TEAM. "This combination of research and expertise is a real leitmotif. This data is also relevant for the scientific community, whether as input for models, to support analysis, or to re-examine the concept of local climate zones in light of physical and geographical observation data."
👉 To learn more about the challenges and potential of the LCZ tool, we invite you to:
- read the CEREMA press release. In particular, you will find an overview of the sensitivity of major urban areas in France to high temperatures, examples of how to use the tool's pre-diagnostic service, and how it complements other major national services provided by Météo-France and ADEME.
- visit the dedicated CEREMA page, which includes a webinar presenting the portal.
SCO synergy
In the "SCO philosophy", we advocate sharing and synergy, of which SatLCZ is a fine example:
👉 For land managers, LCZ information can be supplemented by data from the SCO Sat4BDNB project, which has implemented:
- Automatic production of urban albedo on a national scale, available on the THEIA website.
- 5 indicators related to the urban heat island integrated into the BDNB national building database.
👉 LCZ mapping applied to the Greater Nancy Metropolitan Area has contributed to the SCO Green Urban Sat project and its LANDIA platform. This provides a detailed description of the vegetation in an urban area, together with decision-making indicators based on the ecosystem services provided by vegetation, including regulation of the local climate and air quality.