

SCOFrance
51Thermocity products freely available on Theia
Useful linksThermocity project page
Thermocity collection on Theia
Key wordsThermal data, urban heat island, land artificialisation, thermal sieve, thermal anomaly, thermal building, surface temperature
Thermocity entrusts its data to Theia
Thermocity aims to study urban heat island effects in summer and heat loss in winter through the development of a reliable thermography analysis tool, including the processing of satellite thermal data. To achieve this objective, the project brings together scientists specialising in urban climatology, remote sensing and building materials. It should be noted that Thermocity also aims to prepare for future space missions dedicated to urban studies, such as Trishna or CO3D.
A unique collection available on Theia
Satellite thermal data are relatively recent but full of promise, especially for studying the urban environment and its adaptation to climate change. By measuring the surface temperatures of territories, these data are able to reveal surface heat islands in urban areas, the cooling power of vegetation and waterways, and thermal anomalies emanating from buildings.
Today, Thermocity is making a unique set of satellite thermal data on 5 French cities (Marseille, Montpellier, Paris, Strasbourg and Toulouse) available free of charge on the Theia distribution portal.
To mark the occasion, Theia devoted a nice article to the creation of this Thermocity data collection in its Bulletin No. 16 of February 2022.
4 major thermal products
The collections put online on Theia are the fruits of workshops organised with three French cities to define the most relevant areas of work based on thermal data and to propose derived products. Ensuring a constant involvement of end-users and promoting a synergy between science and applications, these workshops have defined the following production:
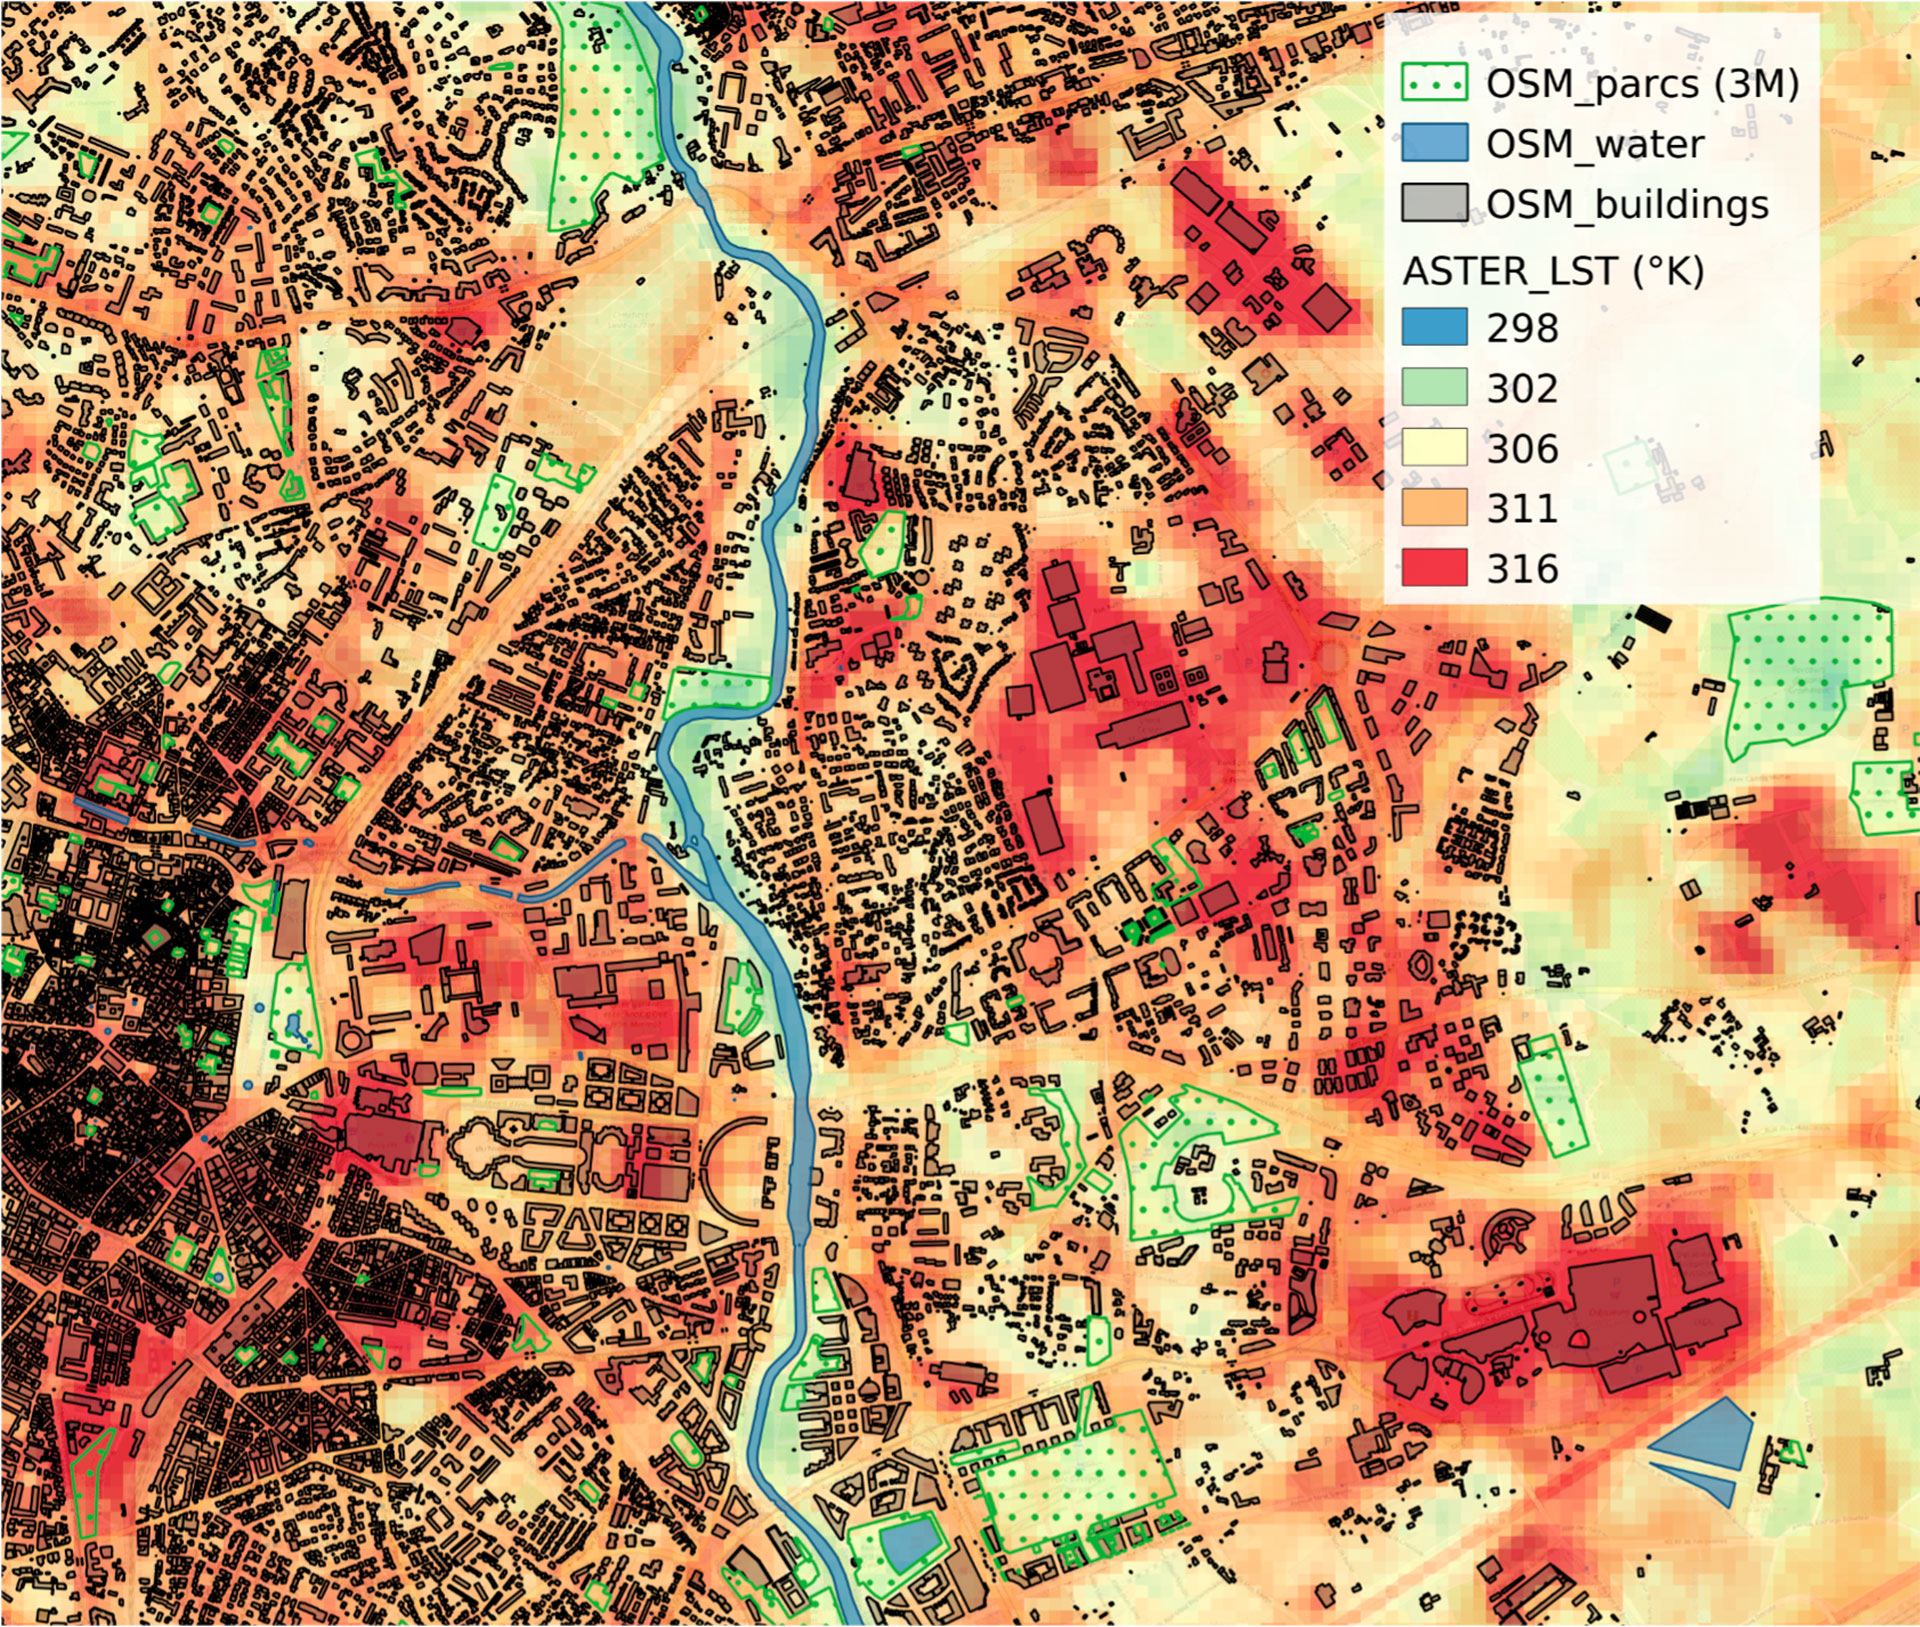
- Urban heat island surface and vegetation thermal performance: cross-referencing surface temperature data with a vegetation inventory. The resulting analysis informs the decision making process to define a coherent mitigation scenario according to the cooling capacity of tree species and watercourses.
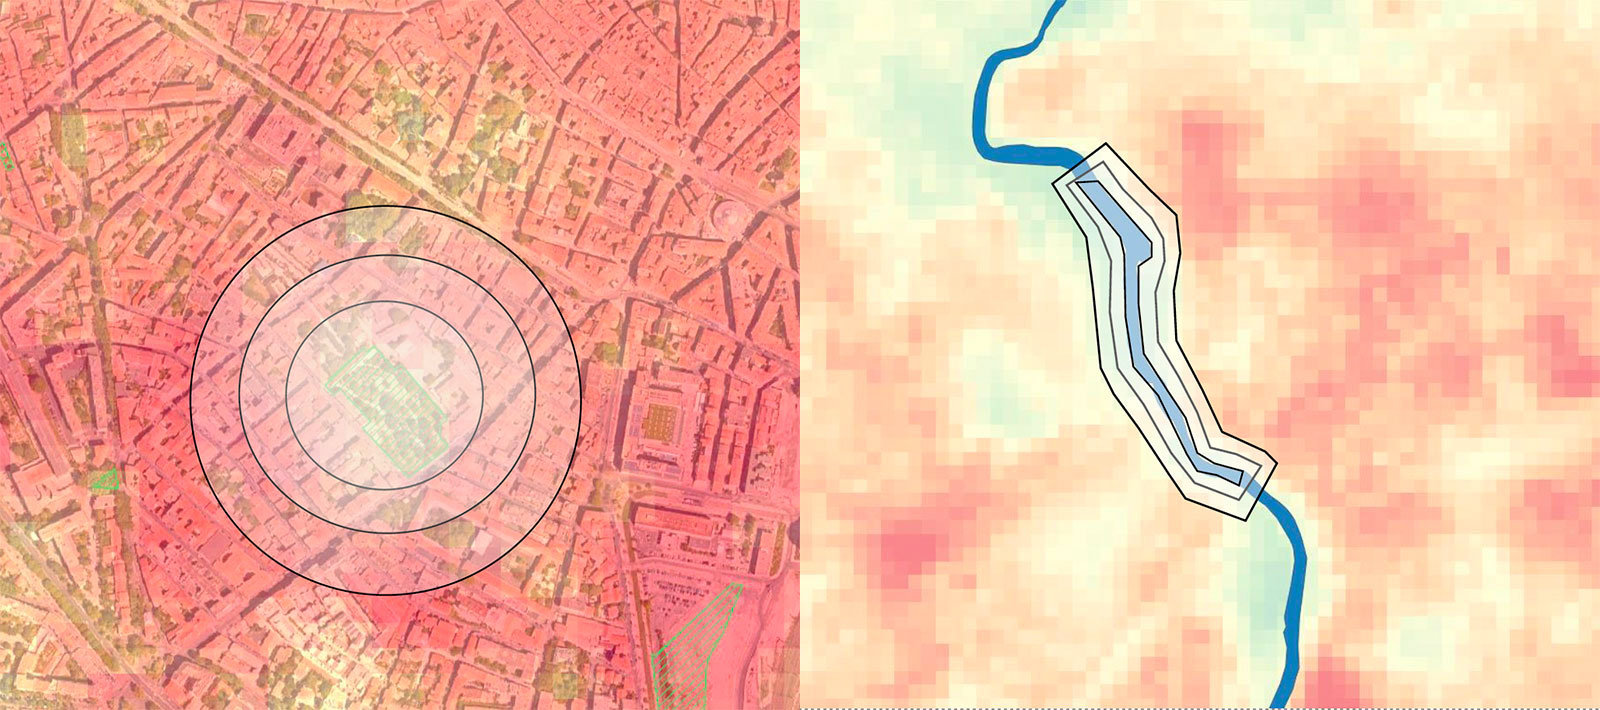
Montpellier. Thermal influence zones of vegetation (left) and a river (right). © Thermocity
- Urban climate modelling: based on the thermal characteristics of various urban developments, Météo-France produces climate simulations based on a digital description of the city. The challenge is to model the air temperature during a heat peak in a future climate, according to the changes predicted in the various IPCC scenarios. While modelling makes it possible to project into the near and distant future, it is also a very complementary approach to the previous one.
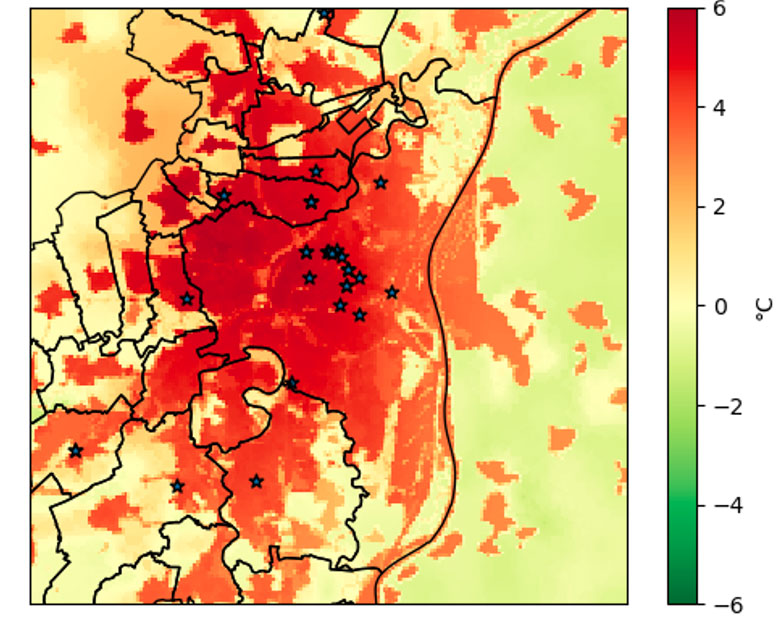
Modelling of the urban heat island in Strasbourg on 1er July 2015 at 01:00. © Météo-France
- Thermal performance of buildings: the aim here is to detect thermal anomalies based on the hottest points measured in winter. This information is particularly useful for guiding renovation plans, especially for buildings. The first results show that the hottest points are home to supermarkets and industrial areas.
- Indicators of the evolution of soil impermeability: there is a direct relationship between soil artificialization and the temperature of the city. With the entry into force of the Zero Net Artificialization Law in 2050 in France, the idea is to provide a dashboard that makes the evolution of artificialization on its territory intelligible to the city. As this is not uniform, the team has chosen to integrate this evolution at different spatial scales. These data are then put into perspective with the nature of the zones (residential, industrial, tertiary). They can also be cross-referenced with socio-economic data, such as the stagnation or permanent arrival of population in a neighbourhood, or the planned destination of certain areas in the Local Urban Plan. These indicators will also be available on Theia once they have stabilised.
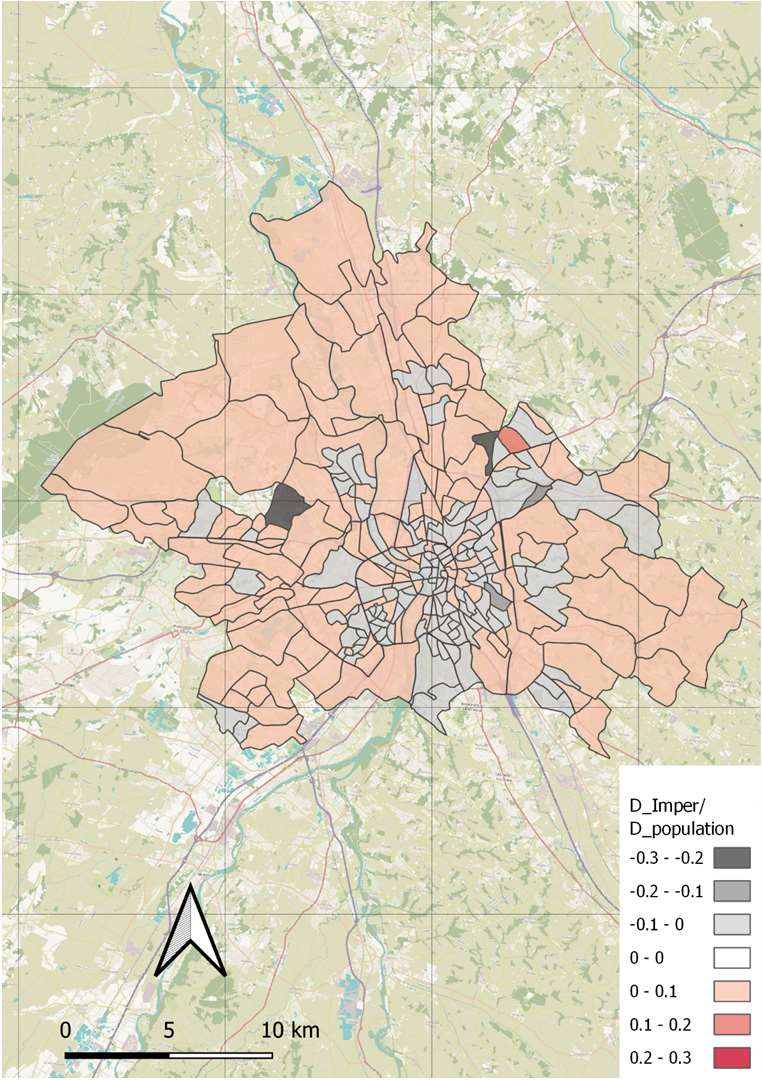
Change in built-up area per capita (in %) in Toulouse from 2015 to 2018. © Thermocity