

THERMOCITY

|
|
Project completed
A pioneering project for learning how to exploit thermal data in the city, Thermocity is inspiring and even fuelling other SCO-labelled projects .
3 areas of work have been defined in collaboration with the cities:
- Monitoring land use/vegetation in the city
- Detection and characterisation of thermal anomalies
- Urban heat islands and heat vulnerability index
The results of all this work include
OVERVIEW
|
Satellite imagery is used to regularly measure the surface temperature of a city or urban area. This project uses two different types of thermal imagery for two purposes: summer thermography to identify heat islands; winter thermography to locate poorly insulated buildings and allocate an energy performance index to each district or city. |
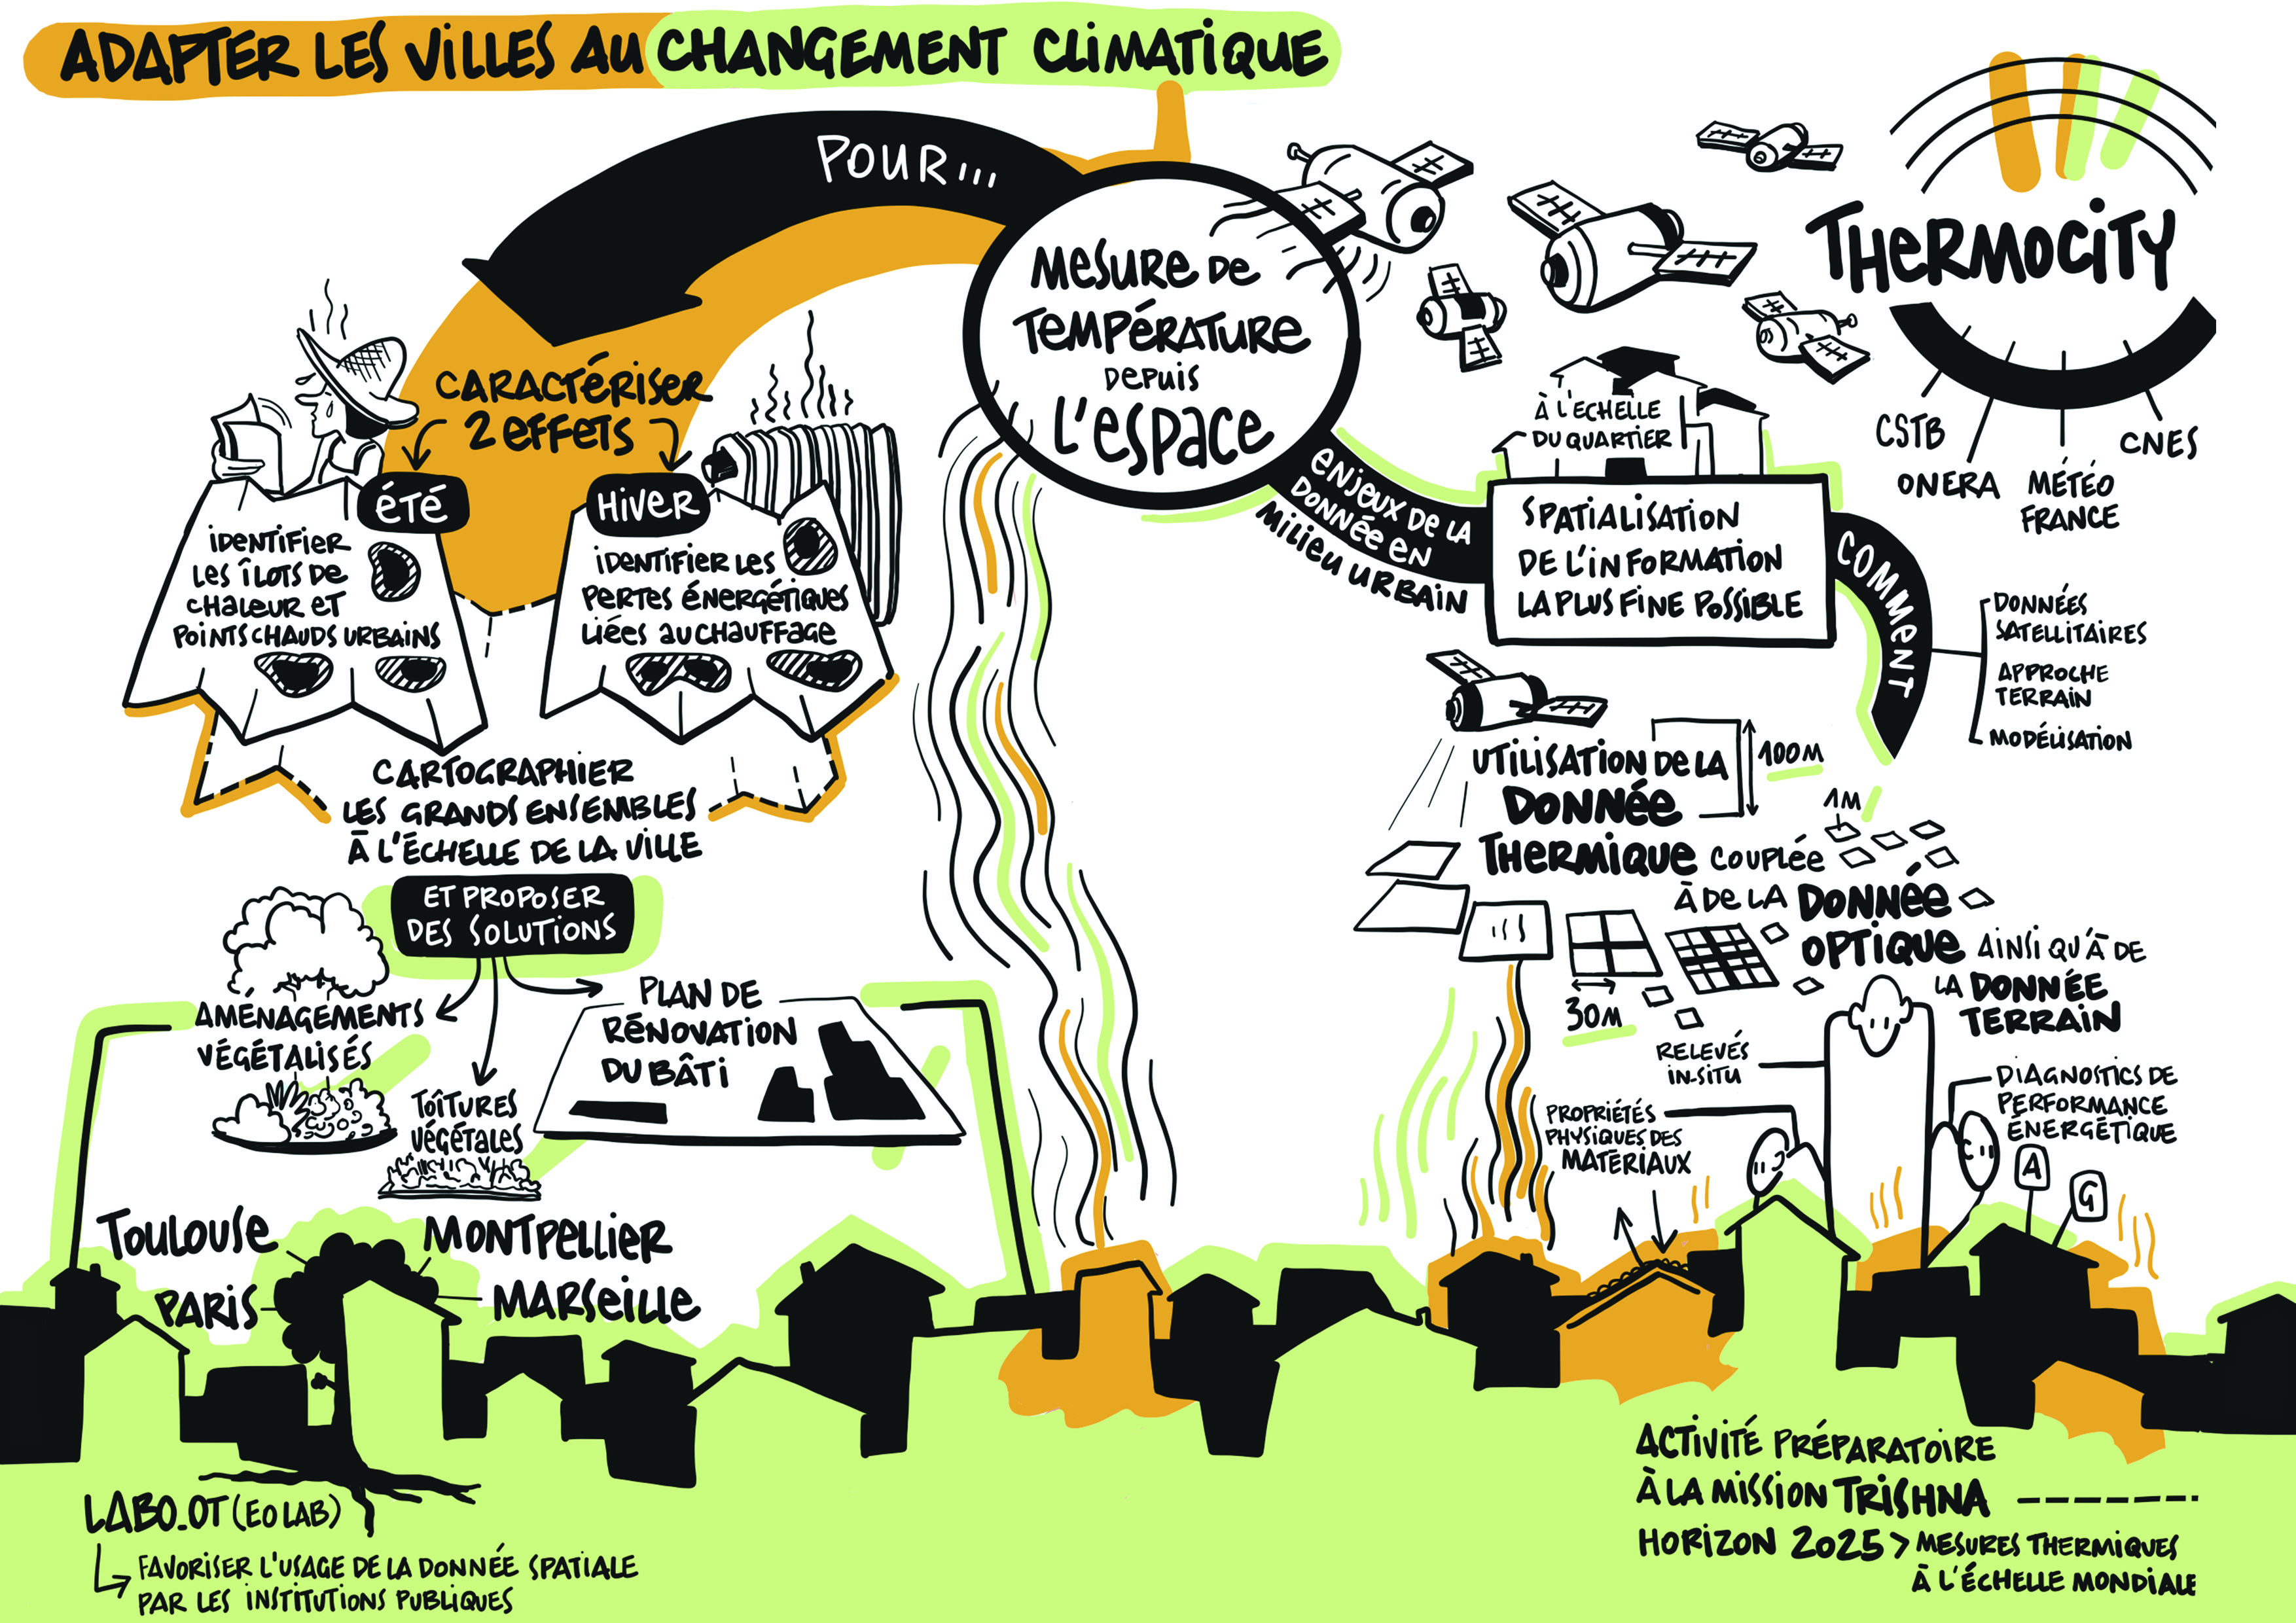 |
Thermographic data can be combined with other spatial data (vegetation mask, type of building, local climate zone, etc.) and non-spatial data (socio-economic data, energy consumption, etc.) to support the planning policy implemented across an urban area.
This project is also part of the preparatory programme for the TRISHNA mission, which is set to begin by 2025. This will provide thermal measurements at global level, with a high repetition rate and high spatial resolution.
The first phase of the project involves identifying and improving recent spatial thermal data in the regions of study. The project makes particular efforts to optimise emissivity/temperature separation based on the specific characteristics of the urban environment. This includes establishing levels of uncertainty for all the products generated.
Another strand of the project involves modelling, particularly for urban heat islands, which are more difficult to understand than heat losses. A comparison is made between models and satellite-based measurements in order to understand the benefits and limits of the two approaches.
Application site(s)
- Toulouse
- Paris
- Marseille
- Montpellier
- Strasbourg
DATA AND TOOLS
Satellite
- Copernicus/Sentinel-2 and Pléiades in the optical field
- ECOSTRESS and ASTER in the thermal sector
Other
- Copernicus imperviousness
- Municipal and sub-municipal divisions IRIS, Open Street Map
- INSEE social and economic data at IRIS level
- National Buildings Database, BDNB
Tools
RESULTS - FINAL PRODUCTS
The THERMOCITY data collection
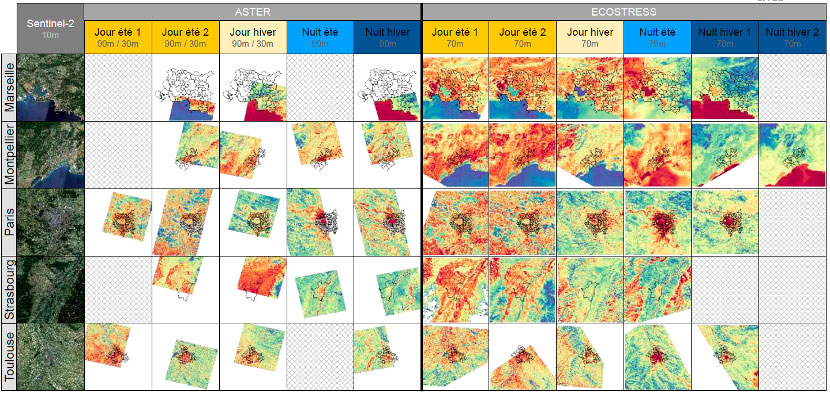
In the first year of THERMOCITY's work, a collection of analysis-ready-data thermal images was created. After careful selection of the data, the images were first geometrically corrected to ensure that each pixel was perfectly geolocated. This stage is essential for cross-referencing temperature data with any other type of data. Subsequently, a special effort was made to achieve the best possible emissivity/temperature separation in the specific conditions of the urban environment, while endeavouring to provide uncertainties and a quality indicator with all the products generated.
A major problem in the thermal field is the poor spatial resolution of images. Cutting-edge techniques are therefore applied to thermal images to improve their definition by combining them with better-resolved images from the optical domain.
|
► Figure 1. Thermocity Collection © CNES 👉 Freely available on THEIA. |
|
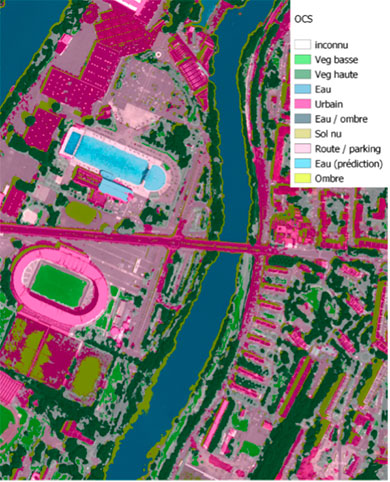
Monitoring land use/vegetation in the city
Reintroducing vegetation to the city is one of the main measures for mitigating the urban heat island effect. Vegetation also contributes to human well-being and to maintaining biodiversity in the city. This is why most major cities have revegetation plans that are currently being rolled out.
|
|
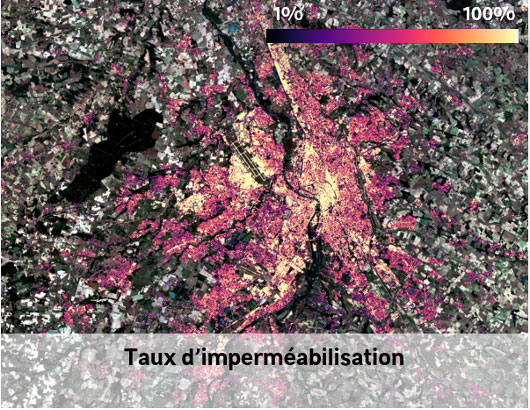
We have therefore been working on monitoring land use in the Toulouse metropolitan area and on the detailed characterization of urban vegetation. Summaries at different scales, from the commune to the neighborhood, on the rate of impermeability (see Figure 2) provided by Copernicus, enabling us to assess large-scale changes in urban land use. ◀︎ Figure 2 © CNES |
|
|
|
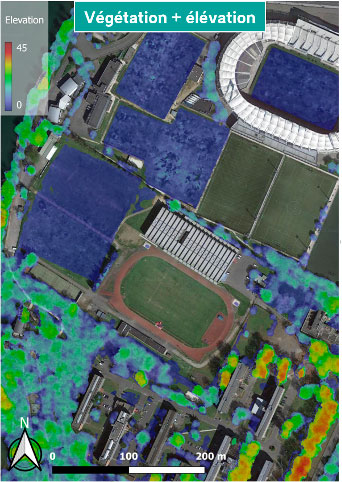
To obtain more precise information, we need to use Pleiades stereoscopic images to obtain 3D metric information. ◀︎ Figure 3 © CNES |
Thermal anomalies: overheated areas, heat leakage
A tool for the automatic detection and characterisation of thermal anomalies has been developed. For each surface temperature image, the anomalies are geolocated, characterised (surface and intensity) and contextualised using Open Street Map.
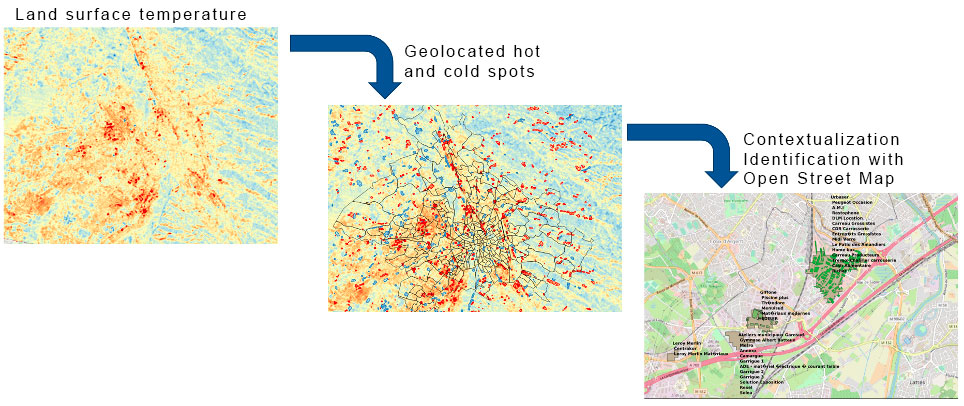
Figure 4 © CNES
|
👉 Thermal anomaly products are available in the THERMOCITY collection on THEIA. The main limitation in this analysis is the spatial resolution of the surface temperature images, which does not allow small-scale anomalies to be detected at the scale of individual buildings. |
👉 In the near future, the Franco-Indian TRISHNA mission will produce data with significantly better spatial resolution and revisit. In addition, several projects for private constellations of small thermal satellites with decametric resolutions are currently under development. Our tool will be perfectly usable with these new data! |
Surface heat islands, heat vulnerability index
|
|
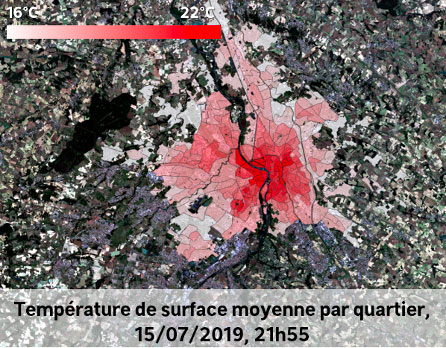
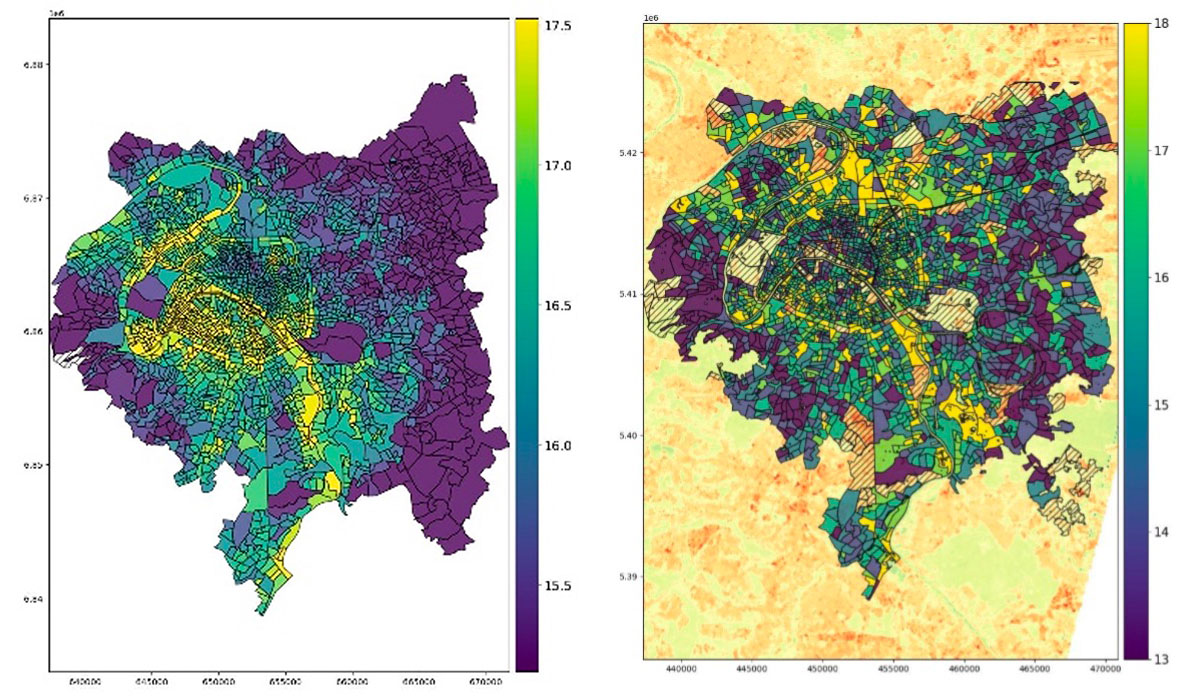
Satellite surface temperature measurements can be used to characterise the overheating of the city. In addition, thermal missions enable us to observe the Earth by day and by night. Daytime images give us information about the areas that are overheated by solar radiation, the same areas that contribute to the overall overheating of the city at night by acting like radiators. ◀︎ Figure 5. Average surface temperature by district. © CNES |
|
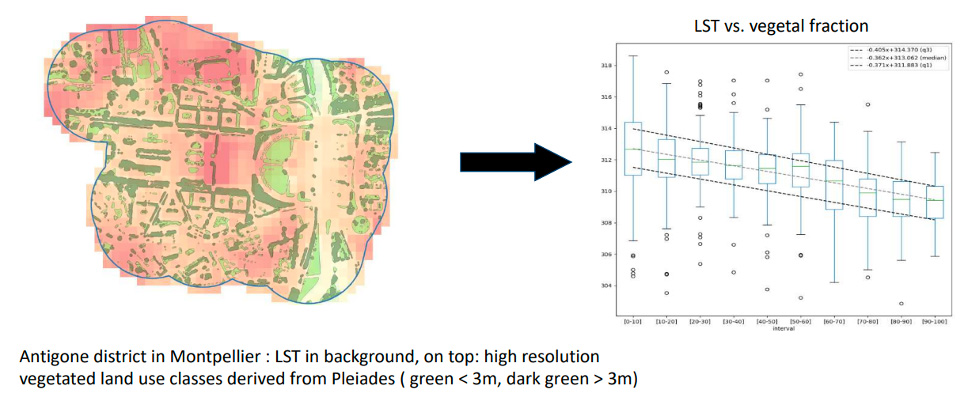
Figure 6 © CNES |
Vegetation makes a dual contribution to urban thermal comfort. During the day, as well as providing shade for passers-by, vegetation heats up less in the sun than an artificial surface because it uses solar radiation to photosynthesis. We have characterized surface temperature as a function of land use: the surface of a 100% vegetated park is typically 5°C cooler on average than a surface made exclusively of artificial materials. |
|
Figure 7: Paris, summer night-time surface temperature on the left, heat vulnerability index on the right, taking socio-economic data into account. © CNES |
Finally, thermal images can be used to model the spatial distribution of exposure to heat. By cross-referencing with socio-economic data, we can obtain a heat vulnerability index that takes into account the age of the population, income and even the thermal performance of buildings.
|
👉 Surface temperature maps and associated vulnerability indices are available in the THERMOCITY collection on THEIA.
Urban climate modelling: cross-validation and future climate
Another way of understanding the city's thermal behaviour is to model the urban climate. While it is not possible to measure now what will happen in the future, it is entirely possible to model it. With the help of Météo-France, we therefore decided to try and quantify the impact of climate change on the urban heat island in the future.
|
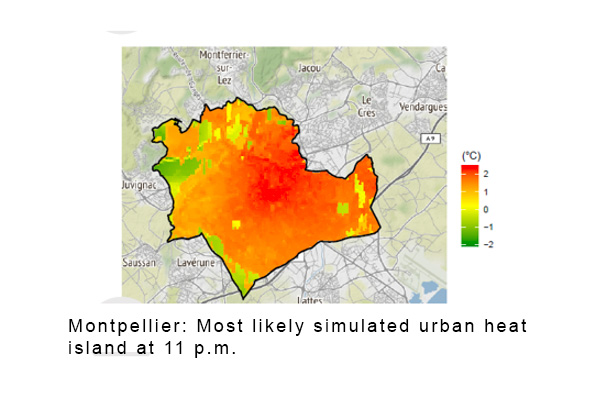
The study did not reveal any change in the morphology of the dominant UHI, as the most likely sensitive weather (all the significant elements of the state of the atmosphere) in the future climate in Montpellier remains unchanged. ► Figure 8 © Météo-France |
|
|
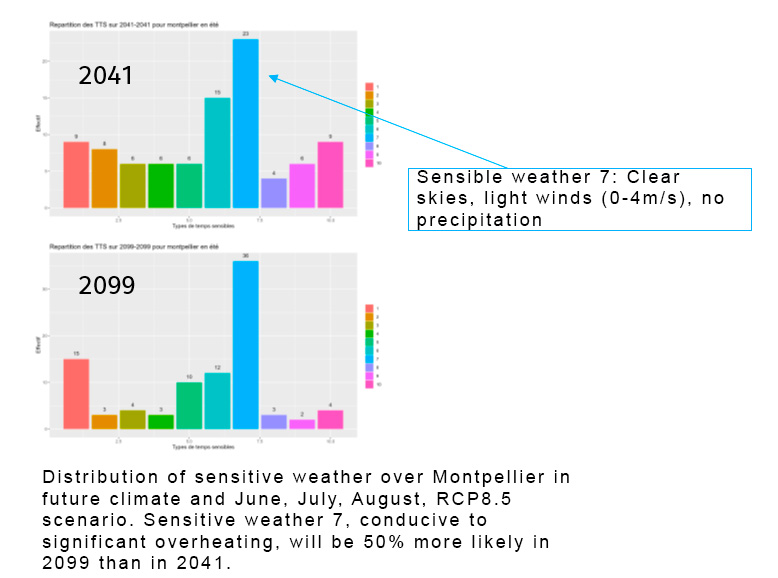
On the other hand, the study makes it possible to quantify the variations in the frequency of sensitive weather in the future. We can see that, in a future scenario as described by the IPCC RCP8.5, the sensitive weather favouring overheating of the city will be 50% more likely in 2099! ► Figure 9 © Météo-France |
|
✚ Find out more
- Open access data on THEIA
- 🎥 An OPEN-IG webinar presenting the project (in French)
- 🎥 An educational video based on the Thermocity project (in French) to explain the challenges of urban adaptation to young people
📂 4 Reports available for download in the Resources section below:
- 2 Reports on thermal data processing:
- geometric correction by CNES (in English)
- radiometric processing by ONERA (in English)
- Météo-France report (in French)
- CNES report on the use of thermal data in cities (in French)
References
| Thermocity on GEO Knowledge Hub, a long lasting digital repository created by the Group on Earth Observations: https://doi.org/10.60566/cckwb-hqr05 |
Related SCO projects
Project News
- 18/09/2023: Thermocity, a pioneer in satellite thermal data for cities
- 10/03/2022: Thermocity entrusts its data to Théia
- 09/06/2021 : Video (YouTube) Thermocity, thermal data at the service of the city: extract from SCO France's First Quarterly, where the project is presented from the angle of "using satellite data" followed by a progress report