

SCOFrance
PartnersLEGOS, IRD, Egis, CNES
Useful linksProject page
KeywordsTopography, bathymetry, risk diagnosis, vulnerability index
WACA-VAR in the field
|
In its space component, supported by the SCO, the WACA-VAR project approaches the subject from an unusual but highly appropriate angle: its consortium, led by LEGOS and IRD scientists, includes EGiS, an industrial company specializing in the design of coastal protection structures. In this way, they go straight to the heart of the matter: defending coastlines and their populations. To validate the results of their topographic and bathymetric models based on Pleiades satellite data, the project team carried out two drone measurement campaigns in the first quarter of 2025. |
2 meetings in September 🔹WACA-VAR will be taking part in the September 2025 Quarterly, the opportunity to share drone images of Dansoman and St Louis. 🔹 WACA-VAR is organizing its scientific workshop in Côte d'Ivoire from September 30 to October 2, 2025. |
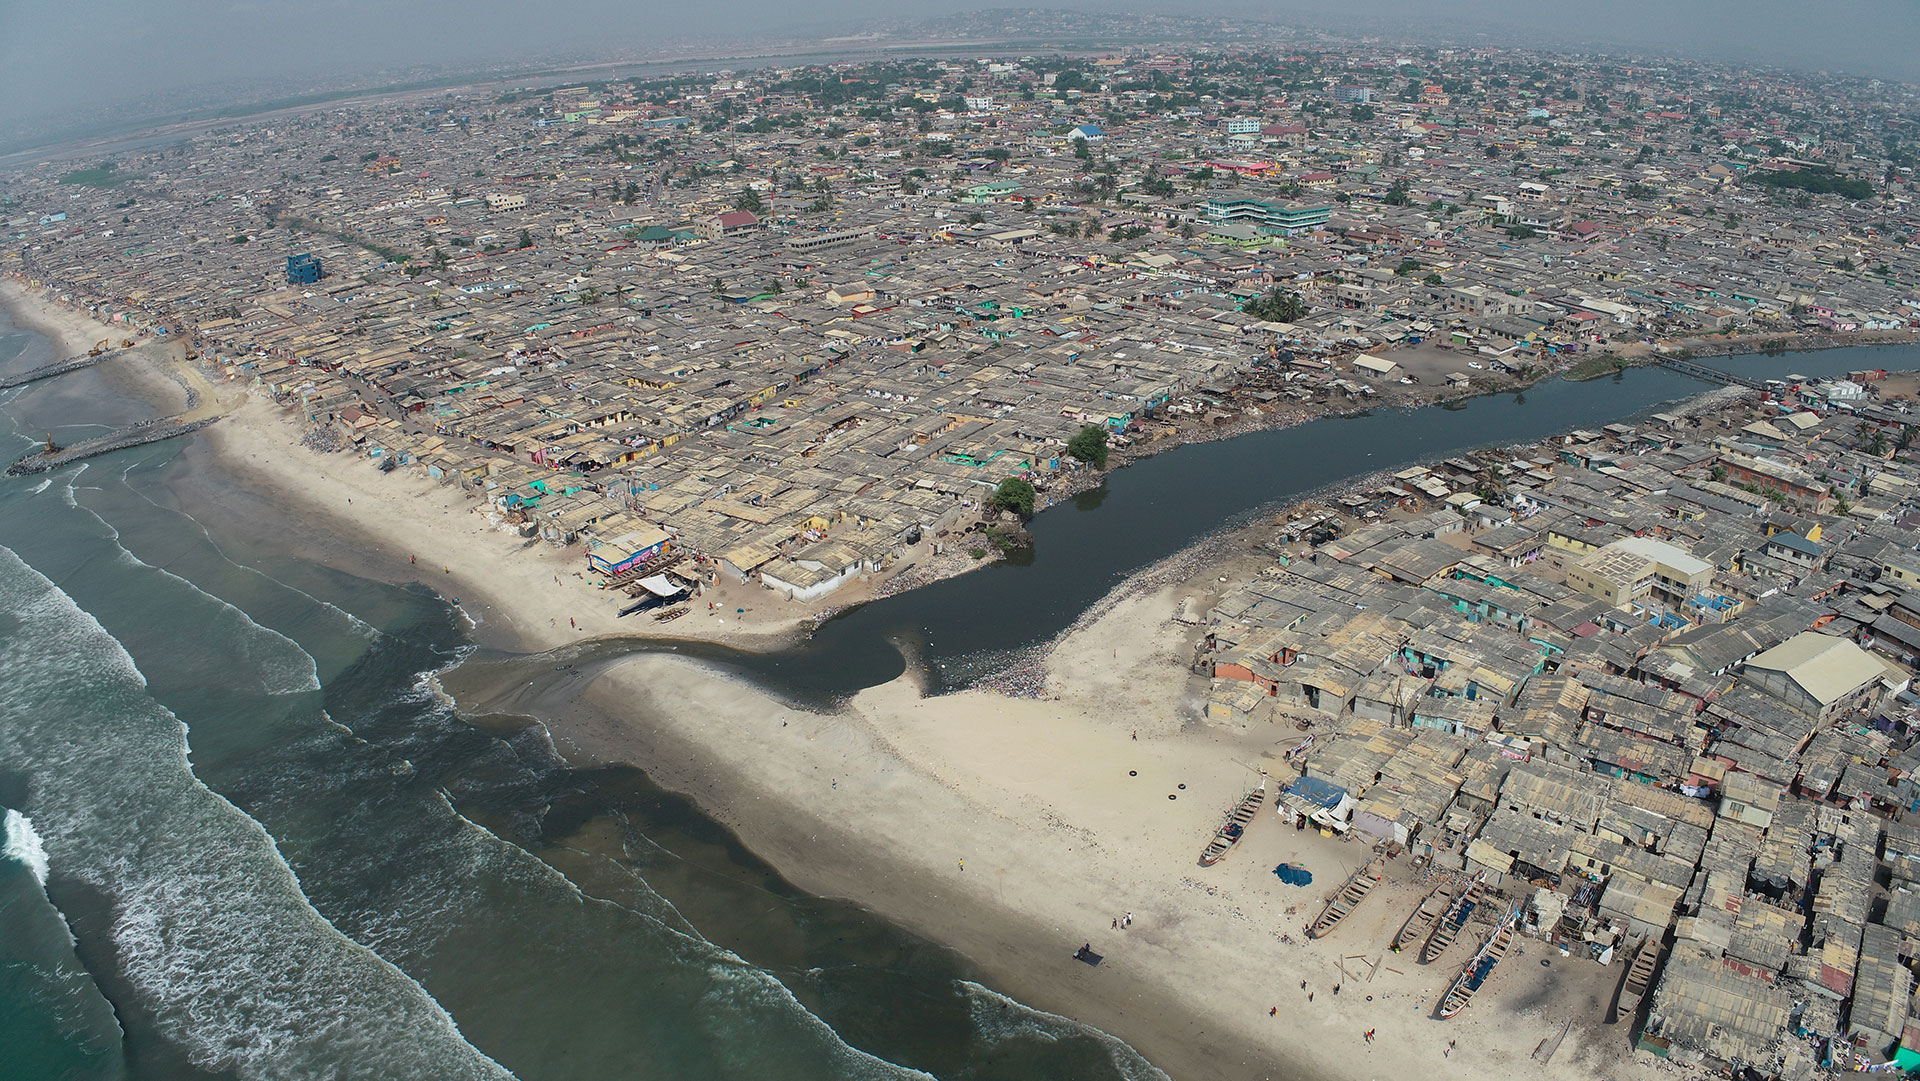
Data acquisition at Dansoman (Ghana) on January 27 and 28, 2025
|
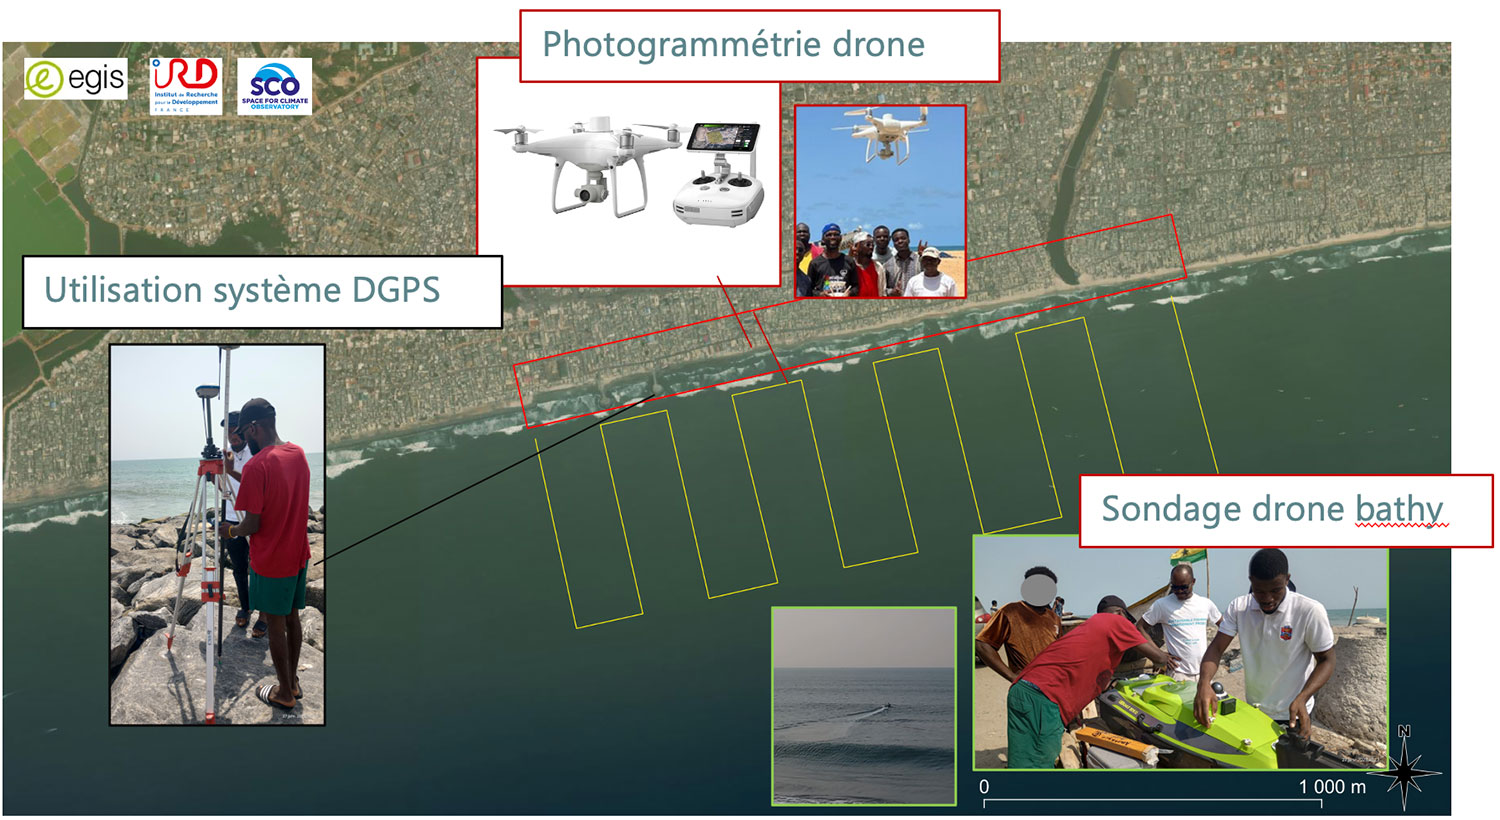
At Dansoman, EGIS has begun construction of two groins to protect the coast by slowing down water currents and limiting sediment movements. Twenty more are planned towards the east and the city of Accra. To position them in the best possible way, it is necessary to know the topography of the beach, including underwater (bathymetry), information obtained through drone measurements as well as DGPS (precise geolocation), directly on the beach at low tide. |
© EGIS-IRD/SCO WACA-VAR |
|
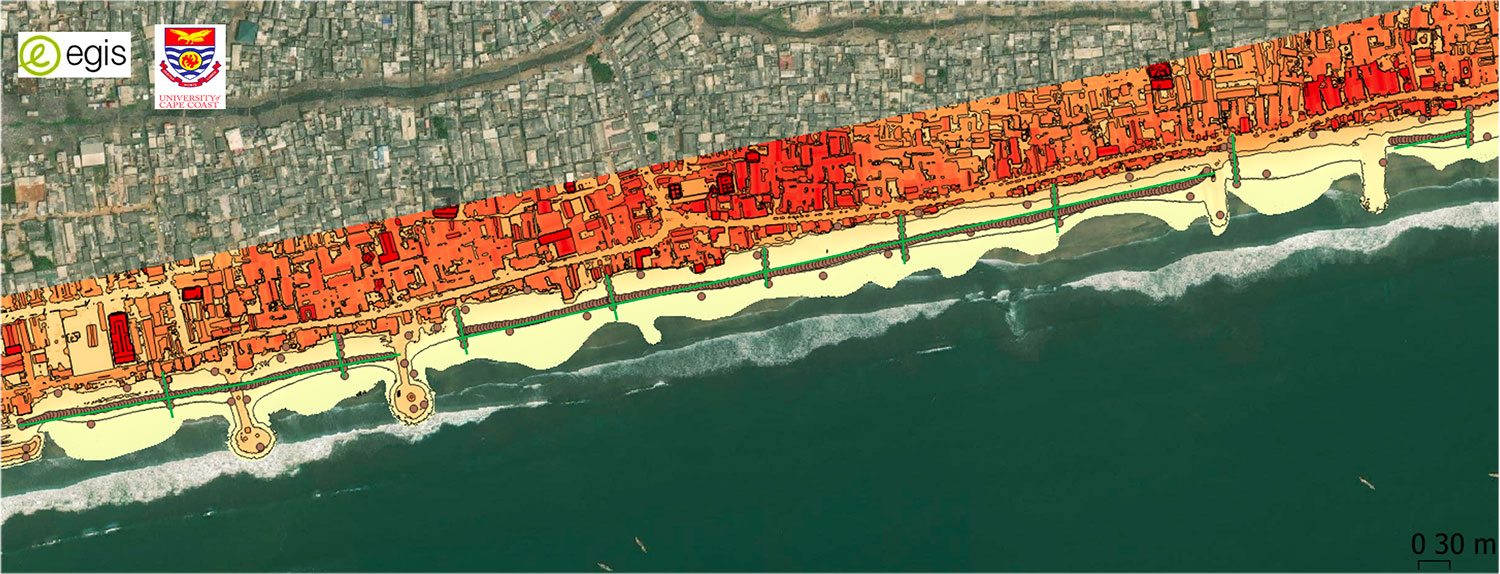
👉 The generated topography of the beach – showing the two groynes under construction – is accurate to within a centimetre. These highly accurate results are the fruit of intense exchanges with Cape Cod University (UCC), recognised as a centre of excellence in West Africa. |
© EGIS-IRD/SCO WACA-VAR |
Data acquisition in St Louis (Senegal) on March 13 and 14, 2025
|
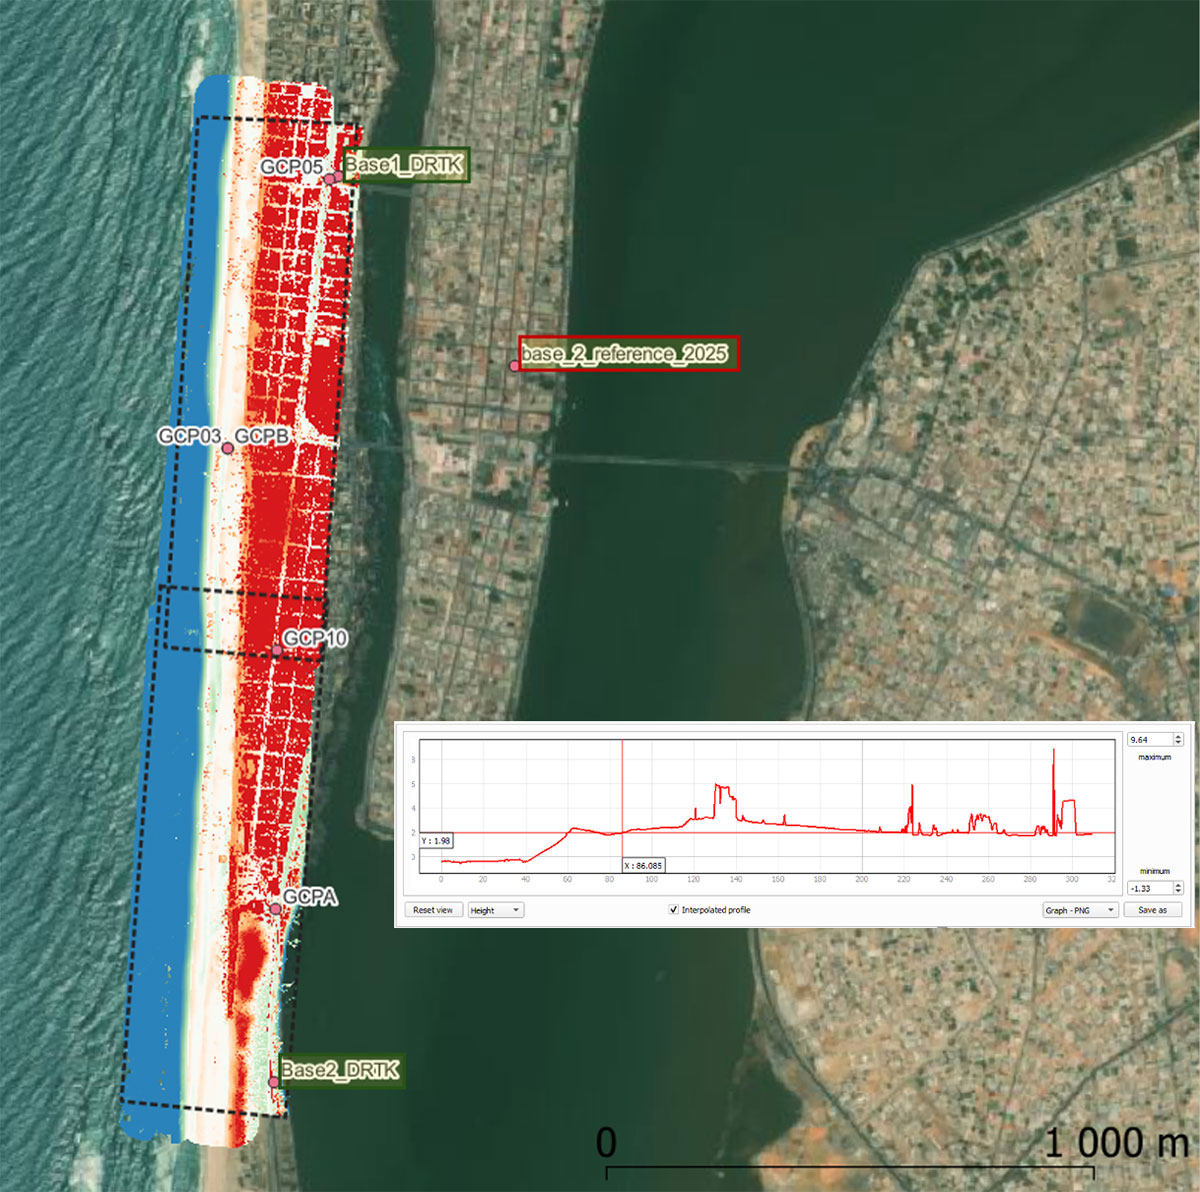
Using similar methods (drone and DGPS), here the team called on Deparentis, a company specializing in maritime surveillance. Deparentis suggested using LIDAR rather than optical measurements, as LIDAR allows better differentiation between the surface and the water, making it easier to clean up the data without any loss in quality. 👉 The results are remarkably accurate across the entire seafront. The profile generated shows a very flat beach, where the pirogues are stored, followed by a larger wave front.
© EGIS-IRD/SCO WACA-VAR |
 |
While the team is continuing to compare these in situ data with digital terrain models (DTMs) derived from satellite images, it is also using these satellite data, now with confidence, to complete the measurements that could not be acquired in the field. The ultimate aim is to assess the relevance of satellite data for risk diagnosis.
Using satellites to estimate coastal vulnerability
In response to a pressing request from coastal managers, the WACA-VAR team also set out to develop the only existing vulnerability index for these coastlines, which has been frozen at low tide since 2020...
Using satellite images acquired since 1990, they were able to generate an evolving index that incorporates a climate model (notably for El Niño/La Niña), seasonal variations in monsoons, sea-level rise and socio-economic indices.
👉 A precursor to a demonstrator, this index enables seasonal forecasts of coastal vulnerability to:
- trigger short-term actions at regional level, such as sandbagging, relocating dugout canoes, etc.
- identify future vulnerabilities and start preparing actions in targeted areas.
Coming soon: an online tool
To facilitate analysis of the products generated, the team is moving towards an online dashboard format, including a cartographic section. Users will be able to play with the parameters to visualize the models on two scales: regional West Africa and local to the study sites.