

SCOFrance
PartnersIRD-LEGOS
LIENSs_University of La Rochelle
University of Arizona
FFWC Flood Forecast and Warning Center
CNES
Useful linksPresentation of the project
News BandSOS a societal necessity
Key wordsFlooding, submersion, risk, societal impact, ocean model
BandSOS launches the prototype of its coastal flood prediction platform
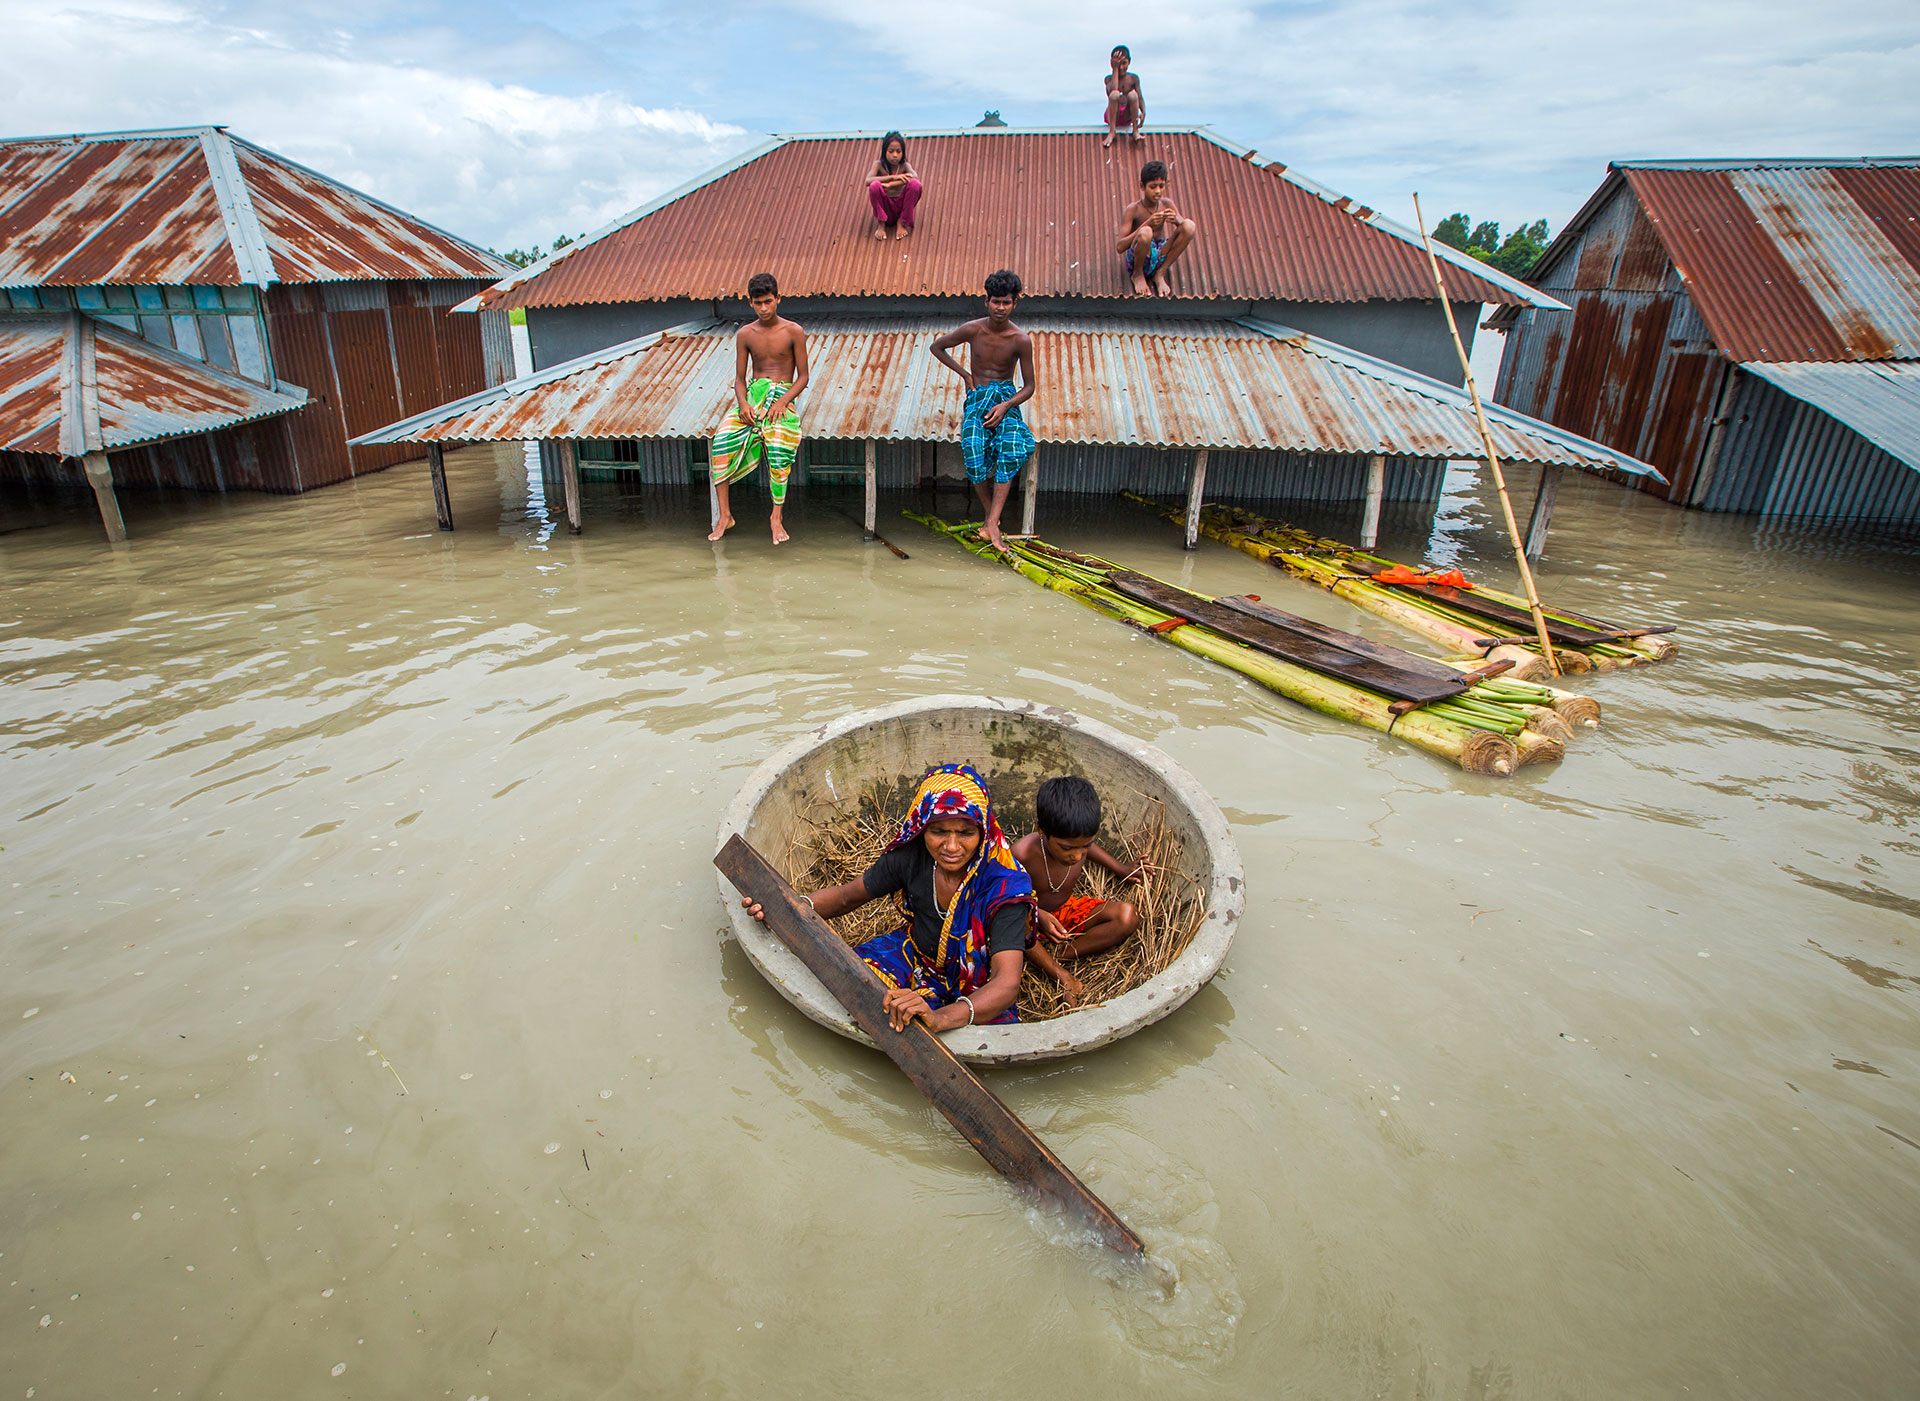
On December 6th, 2022, the Band-SOS project gave us a great three-way demonstration of their platform prototype. Objective: to support real-time risk management and feed adaptation policies to improve the resilience of populations in medium and long term.
As Fabien Durand, oceanographer researcher at IRD/LEGOS, explains, "with this automatic flood hazard forecast platform, we are bringing our research developments to an operational mode for the Bangladesh Water Board, and especially for the FFWC flood forecasting center. To reach a danger scale predicted in real time, our system is being designed to integrate natural hazard and socio-spatial vulnerability”.
A first fully operational version, with an open source code
Imagine you are a Bangladeshi dweller and a cyclone is coming: what will be the water level at the end of the pier of my village the day after tomorrow? The demonstration by Jamal Khan, a research engineer on the Band-SOS project, is simply amazing, as the tool is simple and clear. And effective: "We have developed our forecasting system on the Bengal delta but it is generic and can be applied anywhere! Besides, the source code is open, and the prediction system can be deployed on any computer or cloud".
Test the BandSOS plateform: https://bandsos.github.io/
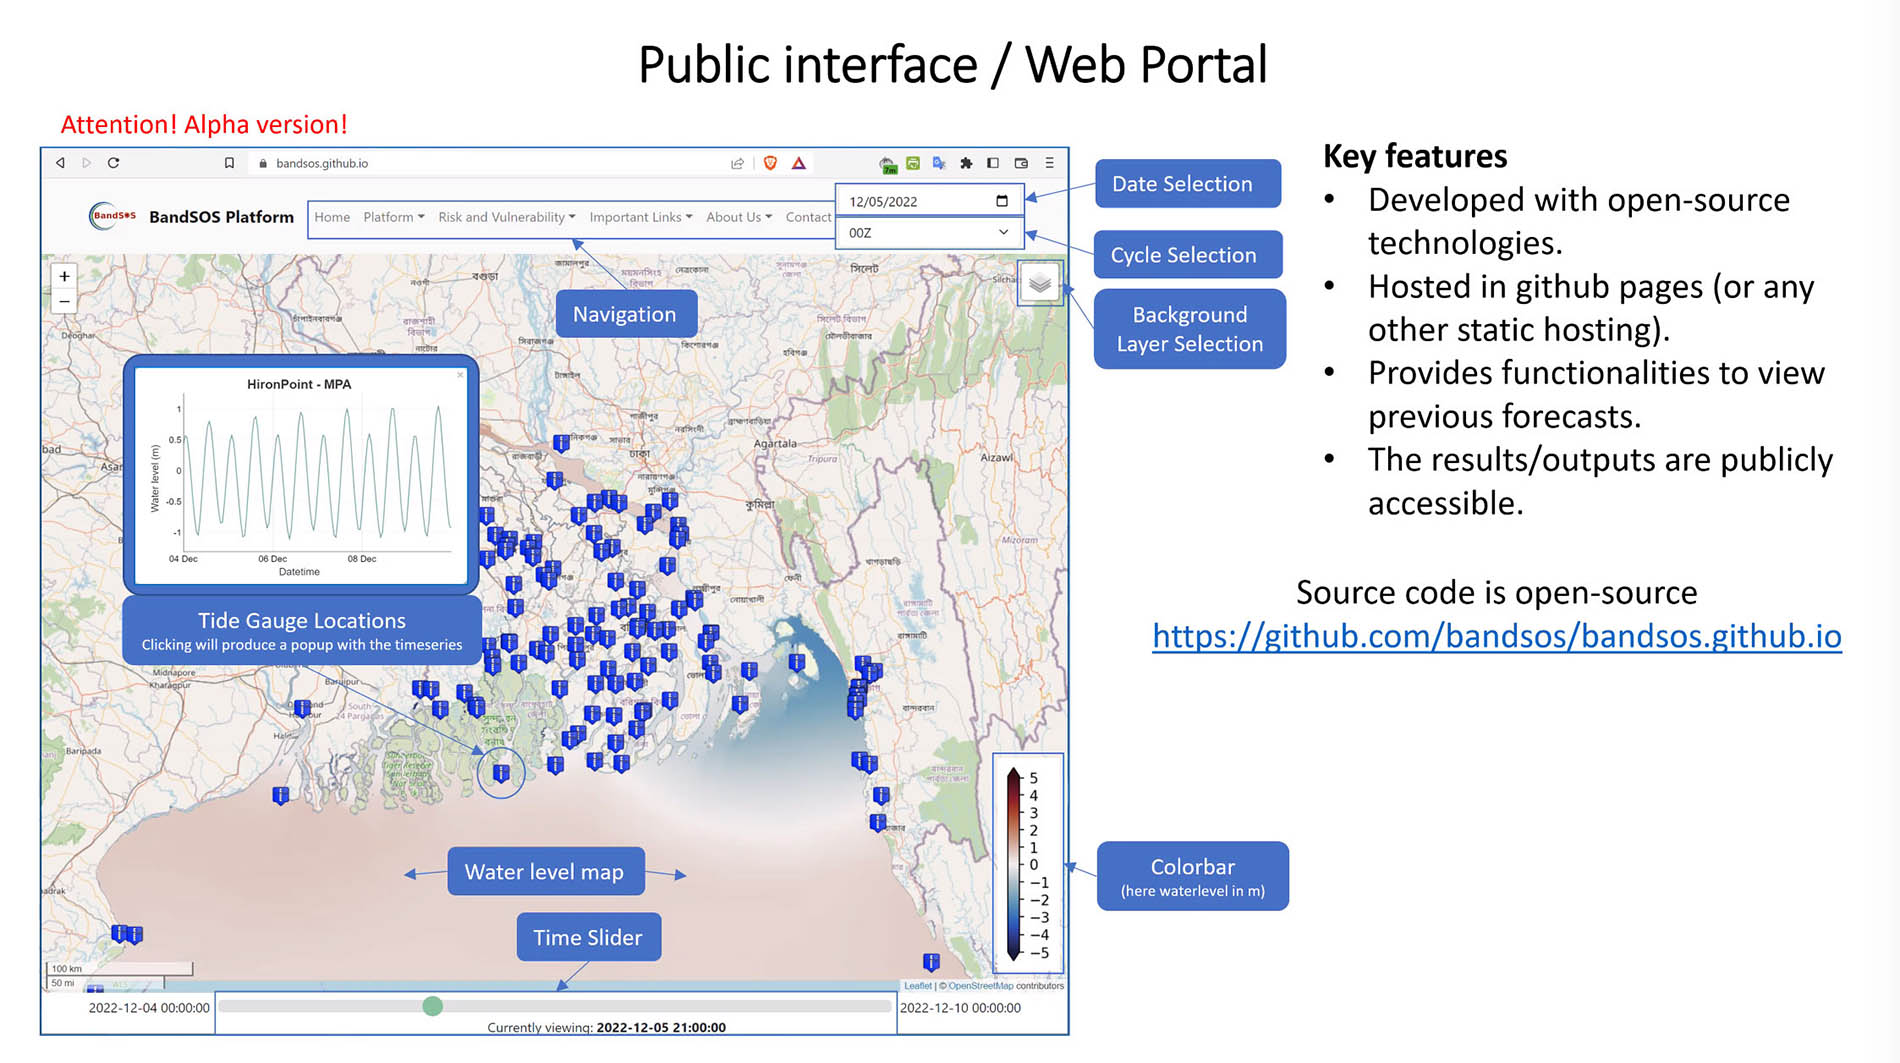
With BandSOS, any dweller (and yourself!) can view the forecasted water level and potential flooding for the next 5 days, every six hours, across the Delta. © BandSOS
Now, if a future cyclone threatens Bengal Delta, the BandSOS platform, although in its initial version, is fully operational. It was officially delivered to the Bangladesh Water Agency on November 1, 2022, with a training workshop for FFWC staff in charge of operational flood forecasting.
Satellites at the heart of the system
To establish its flood forecasts, the system begins by retrieving the NOAA Global Forecast System (GFS) atmospheric forecast, which is freely available and produced every six hours with the inputs from weather satellite data. Merged with tidal heights and river flow, the SCHISM-WWM ocean model (see below) predicts water heights and, wherever it exists, potential flooding. The system then sends its information to the online visualization portal.
In order to be able to estimate the flooding in a given area and the associated vulnerability, the team used remote sensing combined with several other data sources to characterize land use, population exposure and other indicators. This work will soon be refined by testing Sentinel-1 radar imagery (see below).
Finally, thanks to Sentinel-2 satellite images, the project team was able to calculate a high-resolution Digital Elevation Model (DEM) of the intertidal zone. "This is a crucial element," says Fabien Durand, "because the dynamics of cyclonic flooding depend on the topography of the intertidal zone. It reacts particularly strongly in areas of very large beaches with low slopes, which, as in the Bengal Delta, become dry over several kilometers between high and low tide. The Sentinel-2 imagery has allowed us to estimate this topography in detail and we will integrate it into the system in the coming months.
The ocean model
The BandSOS platform uses coupled SCHISM-WWM ocean model, which the project team has been implementing for five years. This model simulates the evolution of sea level and ocean waves at a scale of a hundred meters every five minutes. Taking into account the interaction of the tide, the cyclonic surge and the river discharges from the continent, it works particularly well, even in extremely severe weather conditions.
Defining socio-spatial vulnerability
In order for the forecasting system to incorporate socio-spatial vulnerability, the team conducted an extensive literature review and analysis of available socio-economic and infrastructure data at the county (upazila) levelto construct a socio-spatial vulnerability indicator. According to Nathan Gauthier, research engineer on BandSOS project, "We started from an initial work of vulnerability estimation at a district scale to arrive today at a vulnerability estimation at a scale ten times finer (at the county scale), and we will go down in granularity by the end of the project thanks to spaceborne remote sensing. We will test Sentinel-1 radar data, which penetrates vegetation, to refine the detection of various elements such as habitats and other shelters, dikes, and thus increase the accuracy of our estimate of the exposure of the population at risk."
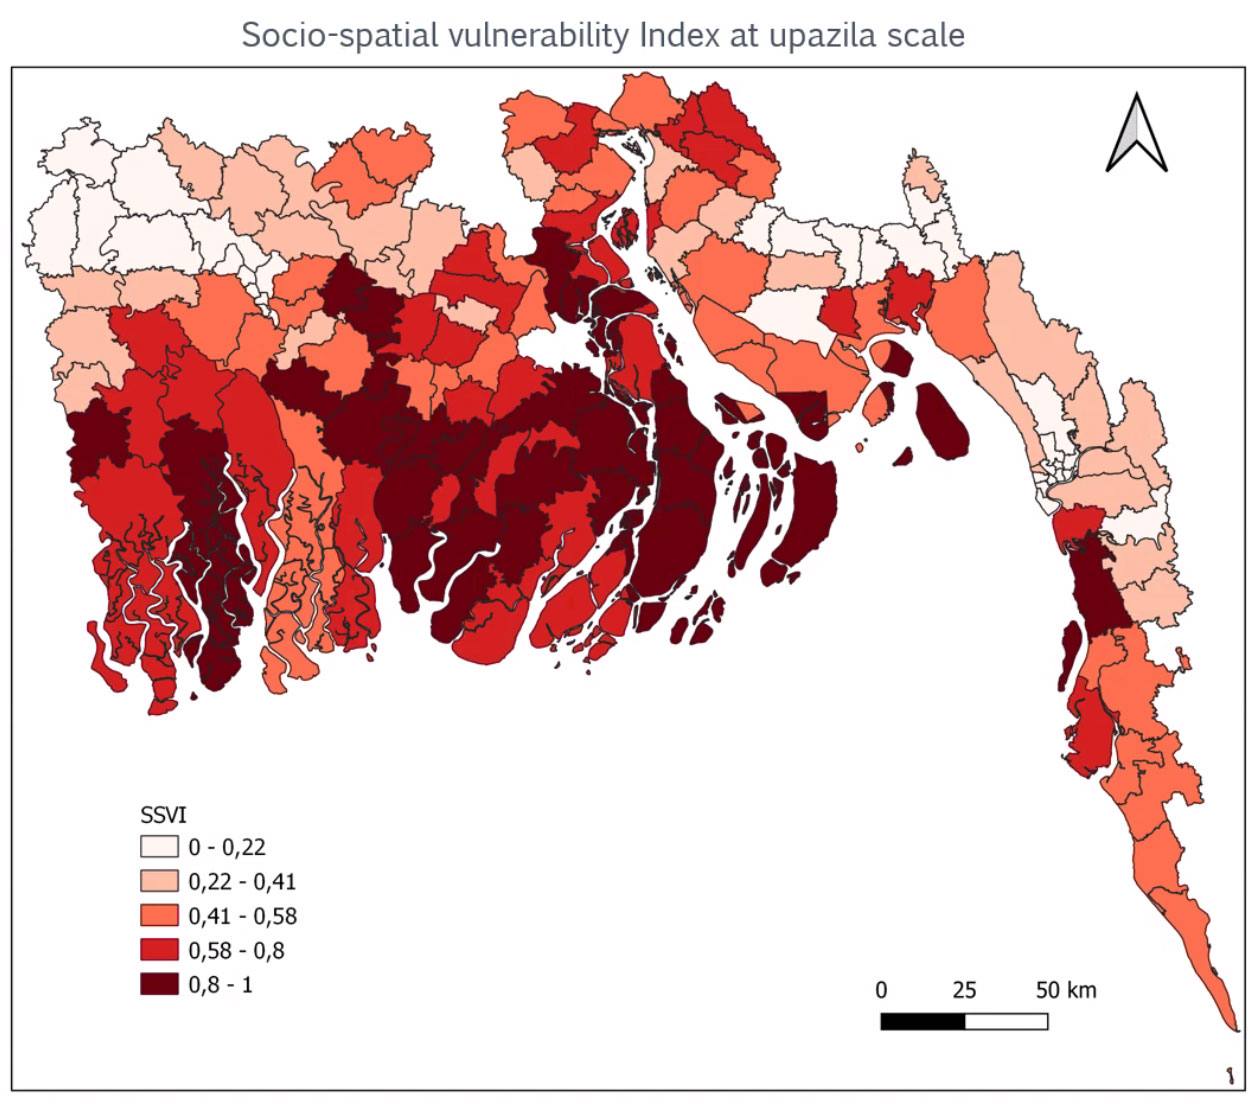
The socio-spatial vulnerability indicator was defined by compiling various data: household composition and socio-economic status, type of housing, presence of infrastructure and networks, exposure to cyclones, and protective structures such as dykes. On this vulnerability map, we can clearly see that the counties in the center and southwest of the Delta, some of which are located several dozen kilometers inland, are more vulnerable than the other counties. © BandSOS