

SCOFrance
3 partnersUMR Espace-Dev (IRD / University of La Réunion)
CNES
Pasteur Institute of Cambodia
DemonstratorLepto Yangon
KeywordsHealth surveillance, epidemiology, DHIS2, leptospirosis, Yangon, environmental data
ClimHealth step 1: demonstrator is online
A very SCO approach
The dynamics of many diseases such as dengue fever, malaria, chikungunya, etc. are strongly linked to climate and environment. The ClimHealth project, led by IRD, CNES and its subsidiary in the health sector MEDES, aims to help public health actors to use satellite information to monitor diseases in relation to environmental variations and develop surveillance and early warning systems for epidemics.
To design ClimHealth, the project consortium went against the usual methods and, as recommended by the SCO, started from a user's point of view. According to Vincent Herbreteau, project manager for the IRD, "Epidemiological data are sensitive and should not be extracted from health information systems to enable environmental analyses, as is usually the case. With ClimHealth, we want to provide institutions with the possibility to integrate indicators of environmental dynamics, calculated in real time, into their own monitoring systems and help them make decisions. Florian Girond, specialist in health monitoring systems, adds: "To be more widely used, we are designing ClimHealth as a module of DHIS2 [see end of the article], the global health information management system, used in more than 100 countries. The objective is not to predict diseases, whose emergence is multifactorial and particularly linked to human behavior, but to predict environments and times that are favorable to the emergence of diseases.
Leptospirosis demonstration in Yangon (or Rangoon), Myanmar
Listening to the partners in the health field, the IRD is carrying out the entire development of the ClimHealth application in the continuity of the S2-Malaria project, previously implemented in Reunion Island. To verify that the application is working properly, the project consortium has created a demonstrator to predict the environments and periods favorable to the transmission of leptospirosis around the city of Yangon in Myanmar (formerly Burma). "We chose leptospirosis, a disease that is closely linked to humid environments, but which is little diagnosed in Asia, except in Thailand, where thousands of cases appear every year," explains Vincent Herbreteau. "The other element that guided our choice was the possibility of calibrating our models on fine data acquired within the framework of the Ecomore2 project, coordinated by the Institut Pasteur and in which we are involved for the spatial analyses. In the Yangon area, this project has developed clinical diagnosis and laboratory confirmation of leptospirosis in a network of hospitals linked to the National Health Laboratory. We used patient location and date of infection to identify and model environments and times favorable for leptospirosis transmission. »
-
3 revealing clues
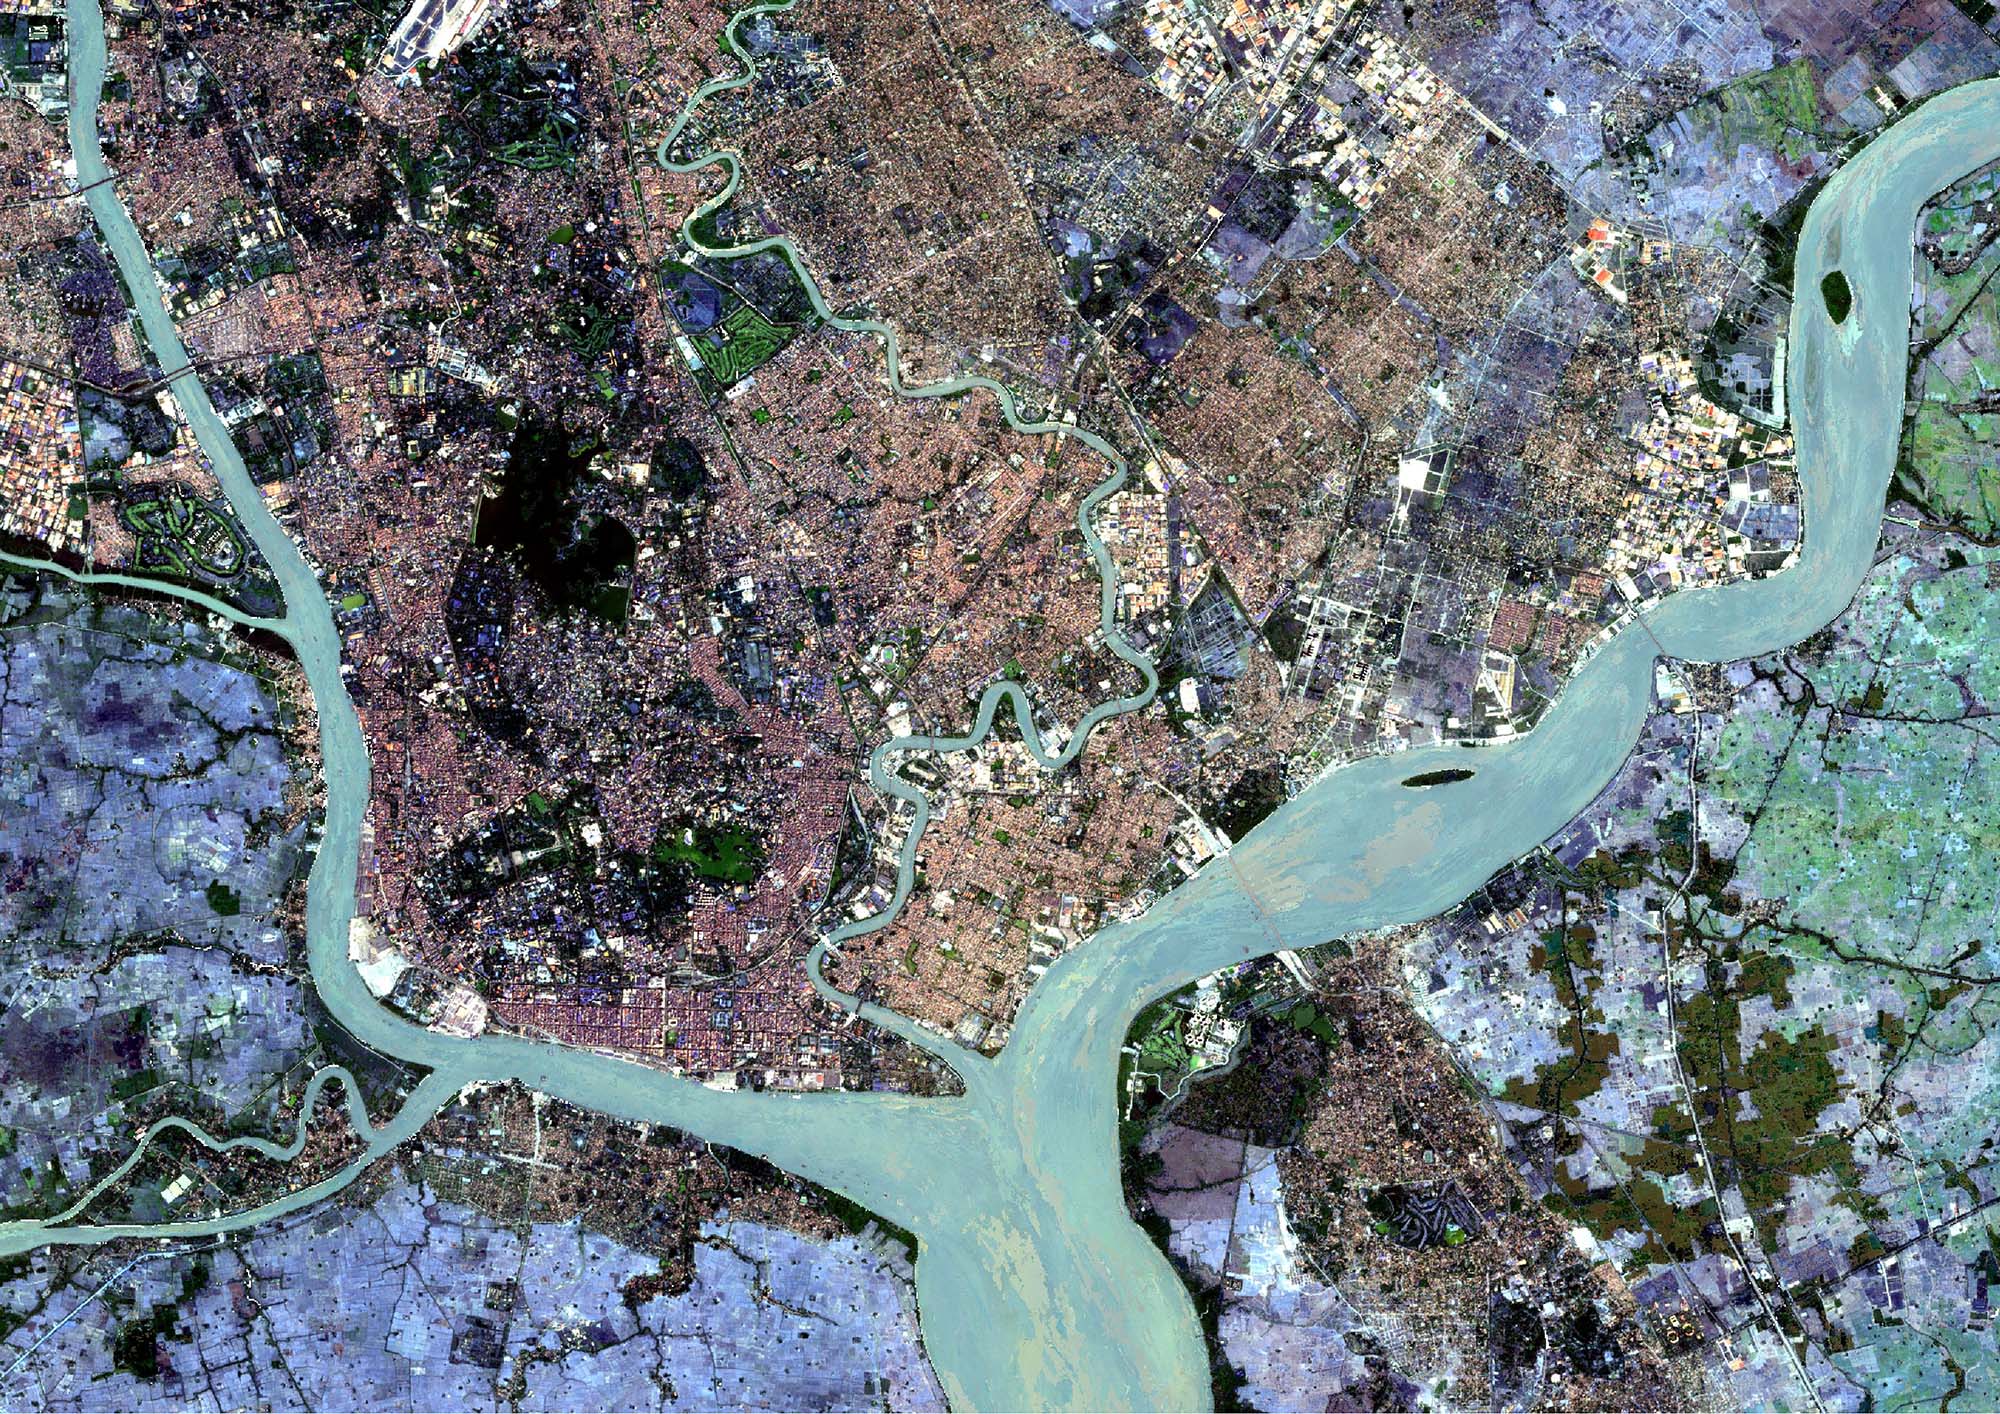
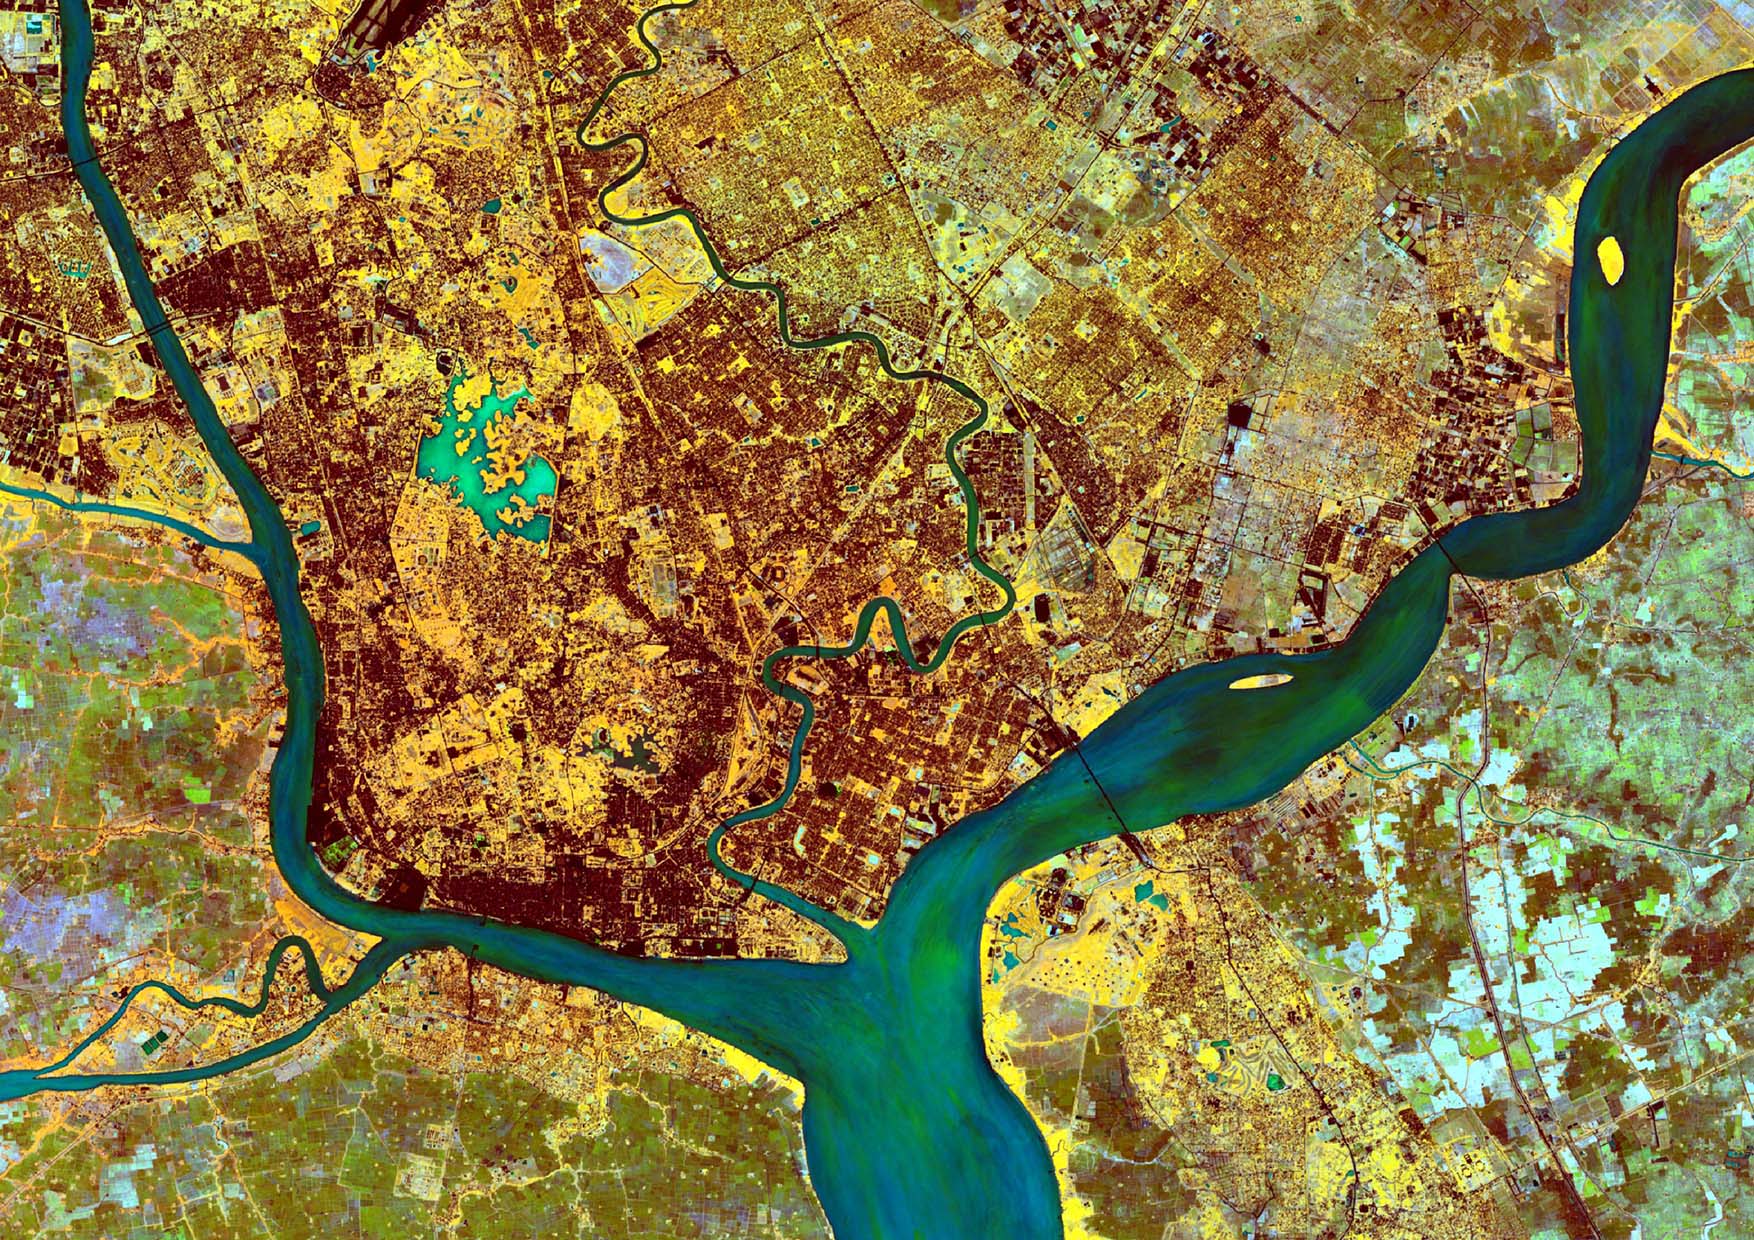
To design the tool, the team first focused on automating the monitoring of environmental dynamics by analyzing Sentinel-2 satellite images. This automation is based on the Sen2Chain tool of the S2-Malaria project, operational at the SEAS-OI Station in Reunion Island, which allows the creation of time series of environmental indicators on locations of interest. Among this information, the model uses the three most revealing indices: the NDVI vegetation index, the MNDWI water indicator and the NDWI Gao humidity indicator.
Sentinel-2 image processing with respect to the NDVI vegetation index. © IRD/Contains modified Copernicus Data
-
Model construction
The statistical basis of the predictive model is to compare the indices with respect to the location and date of occurrence of positive, probable and negative cases. The team tested five types of modeling and selected the best one (Support Vector Machine, SVM). This model will be able to indicate to a user the appearance of environmental conditions suitable to the transmission of the disease.
-
Mapping interface
In order to visualize the relationships between epidemiological and environmental data and the prediction model, an environment-based approach offers a more readable message to public health actors. Using the Sentinel-2 image of Yangon at 10 meters resolution, the team divided the territory into homogeneous entities according to environmental parameters ("segmentation"). The result is a little over a thousand polygons on which the prediction model is applied. In the manner of layers, the tool allows to visualize the spatio-temporal evolution of each of the three indices as well as the prediction for each polygon.
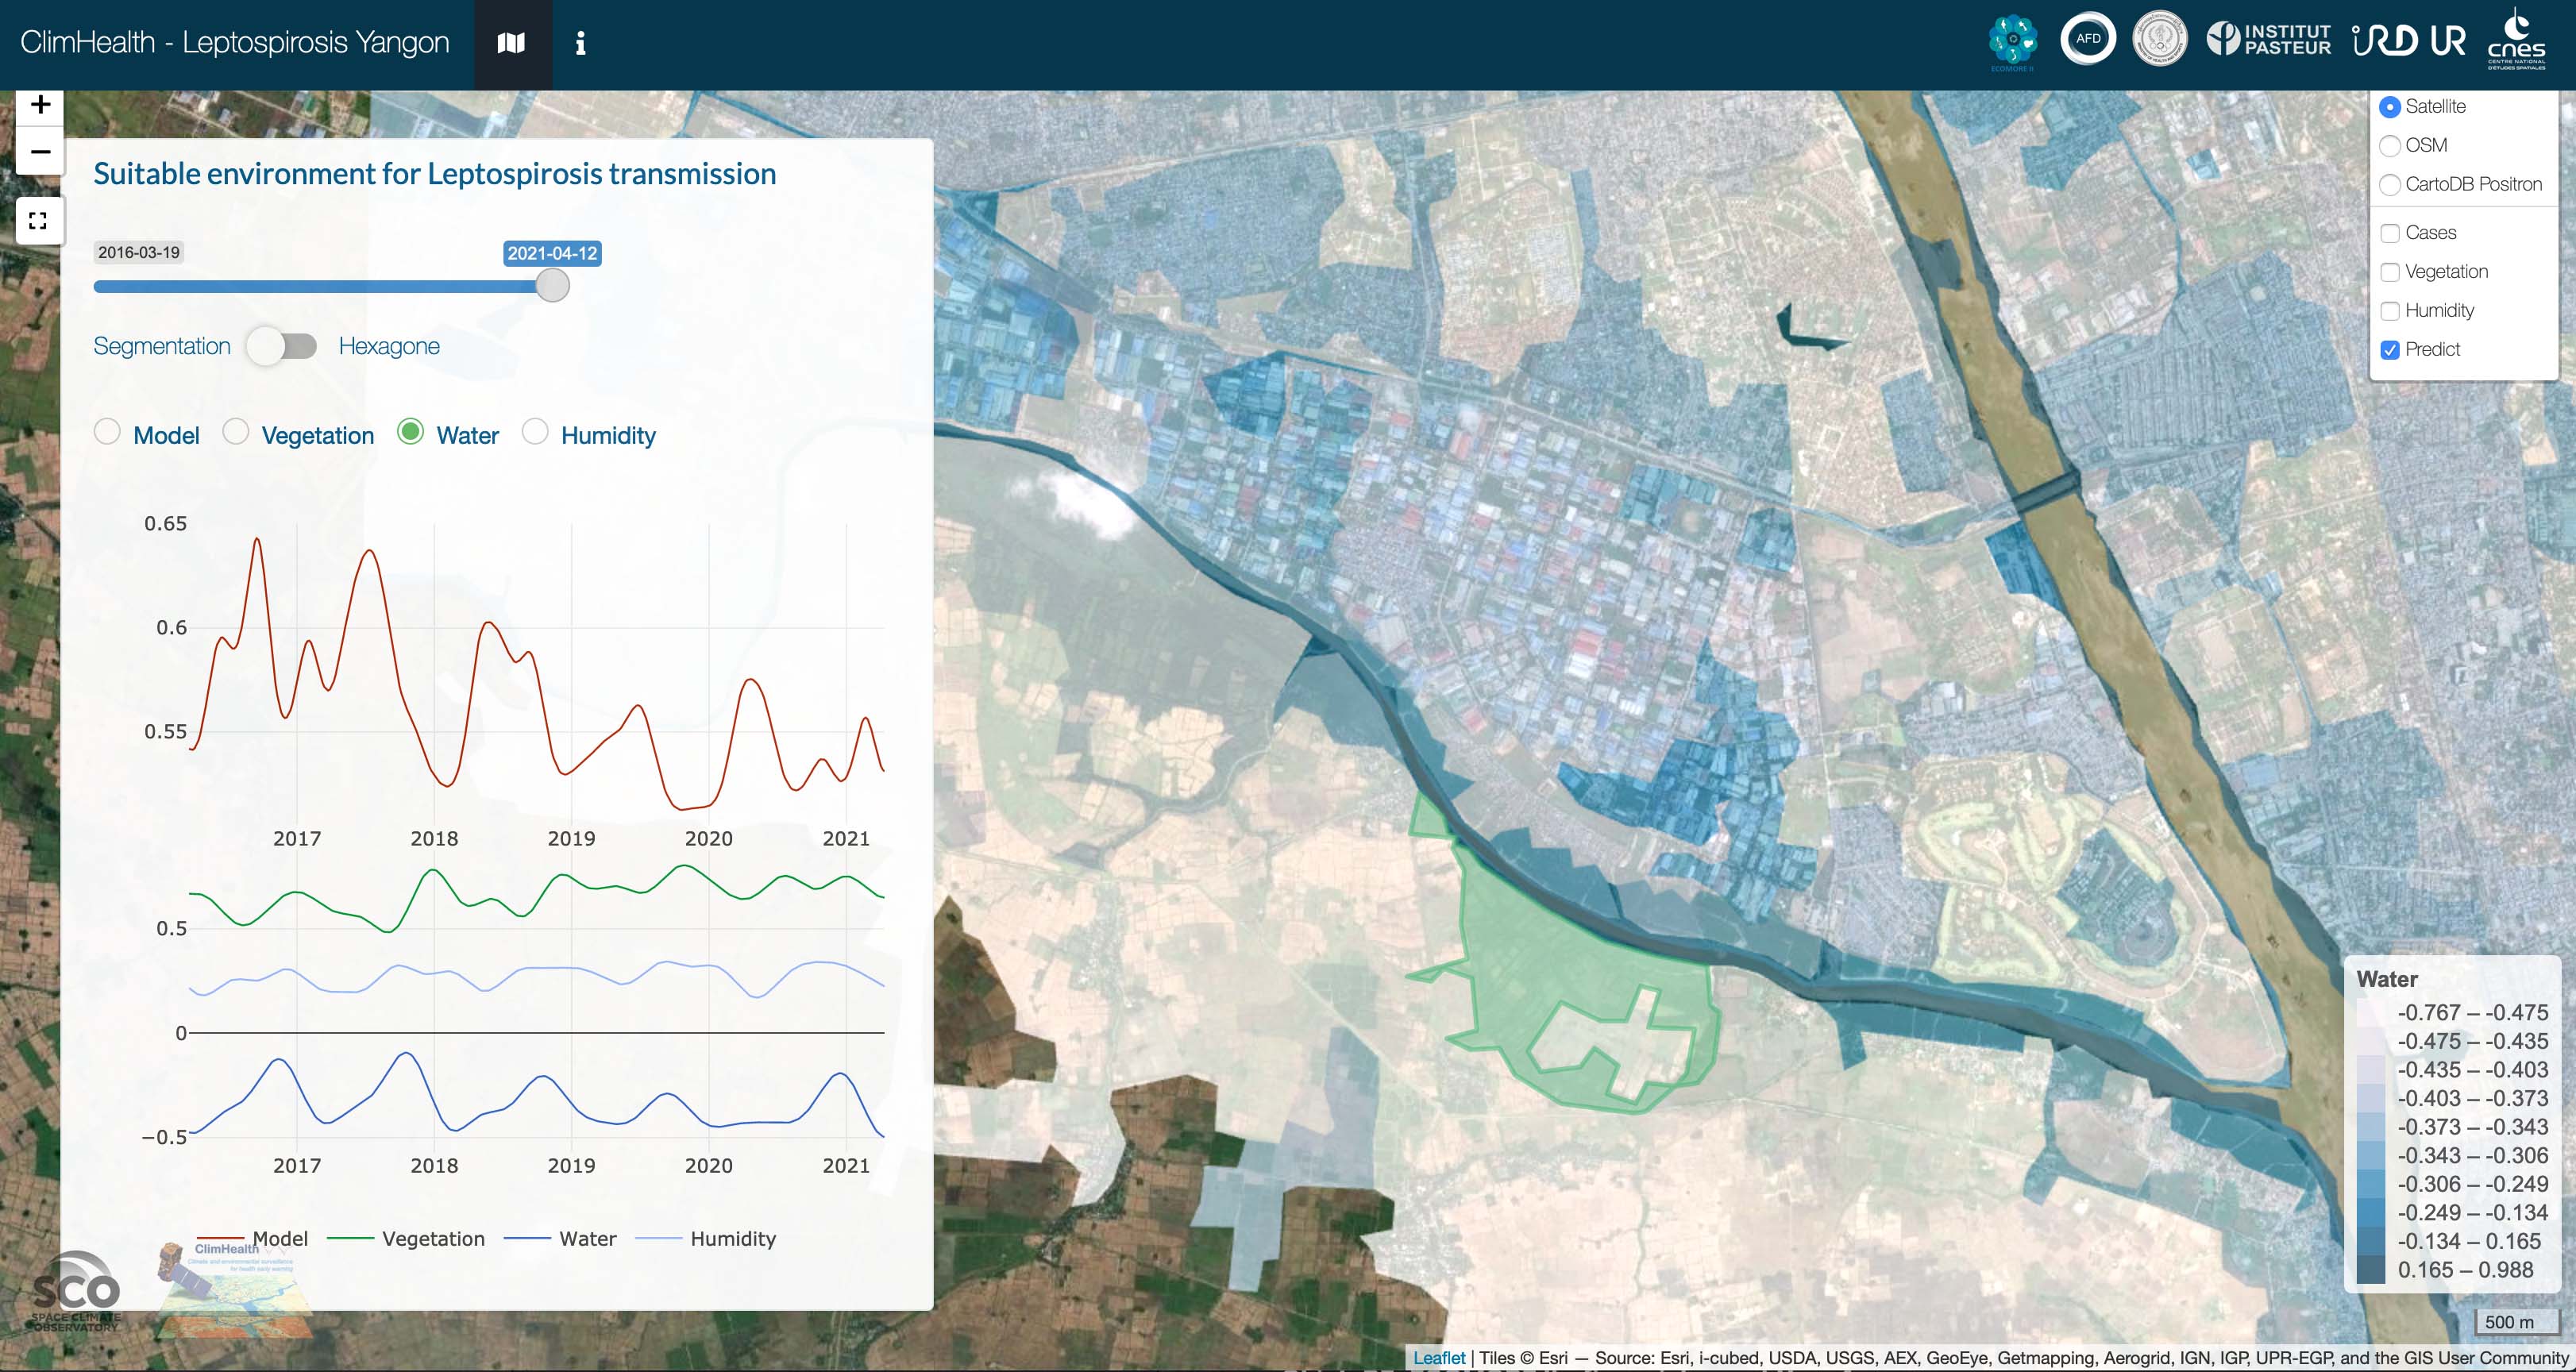
Layer 1: Visualization of the MNDWI water index. © IRD/Contains modified Copernicus Data
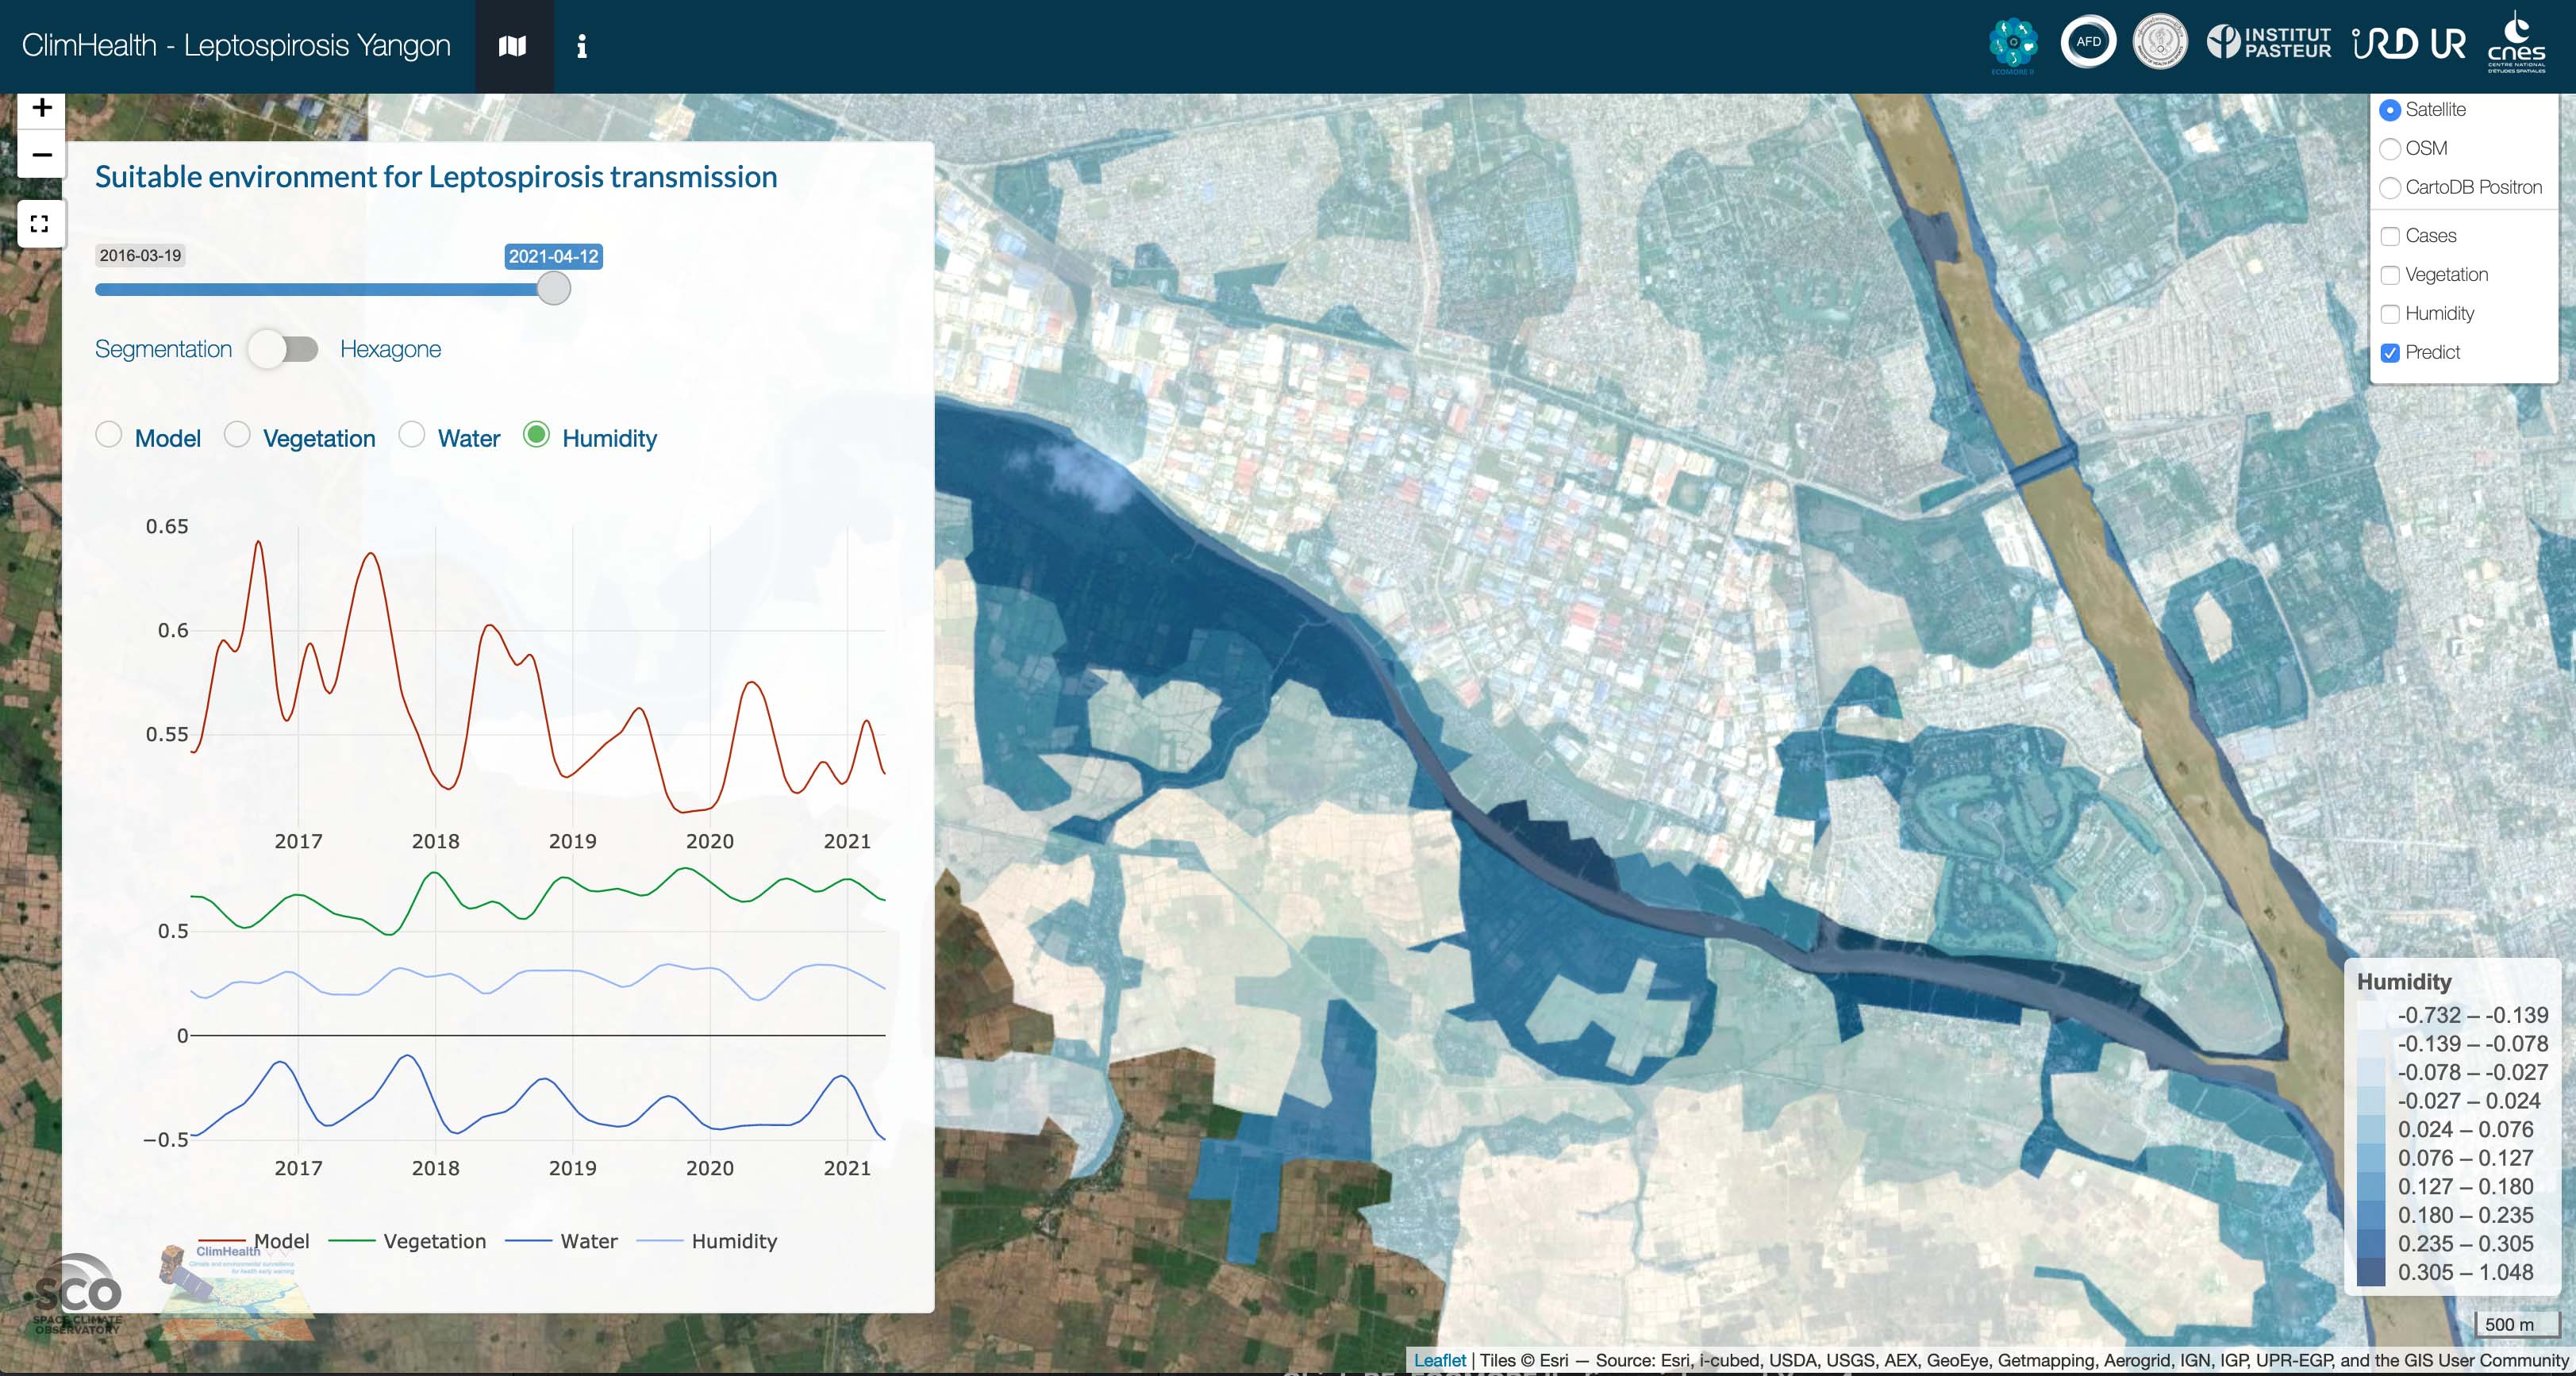
Layer 2: Visualization of the NDWI Gao moisture index. © IRD/Contains modified Copernicus Data
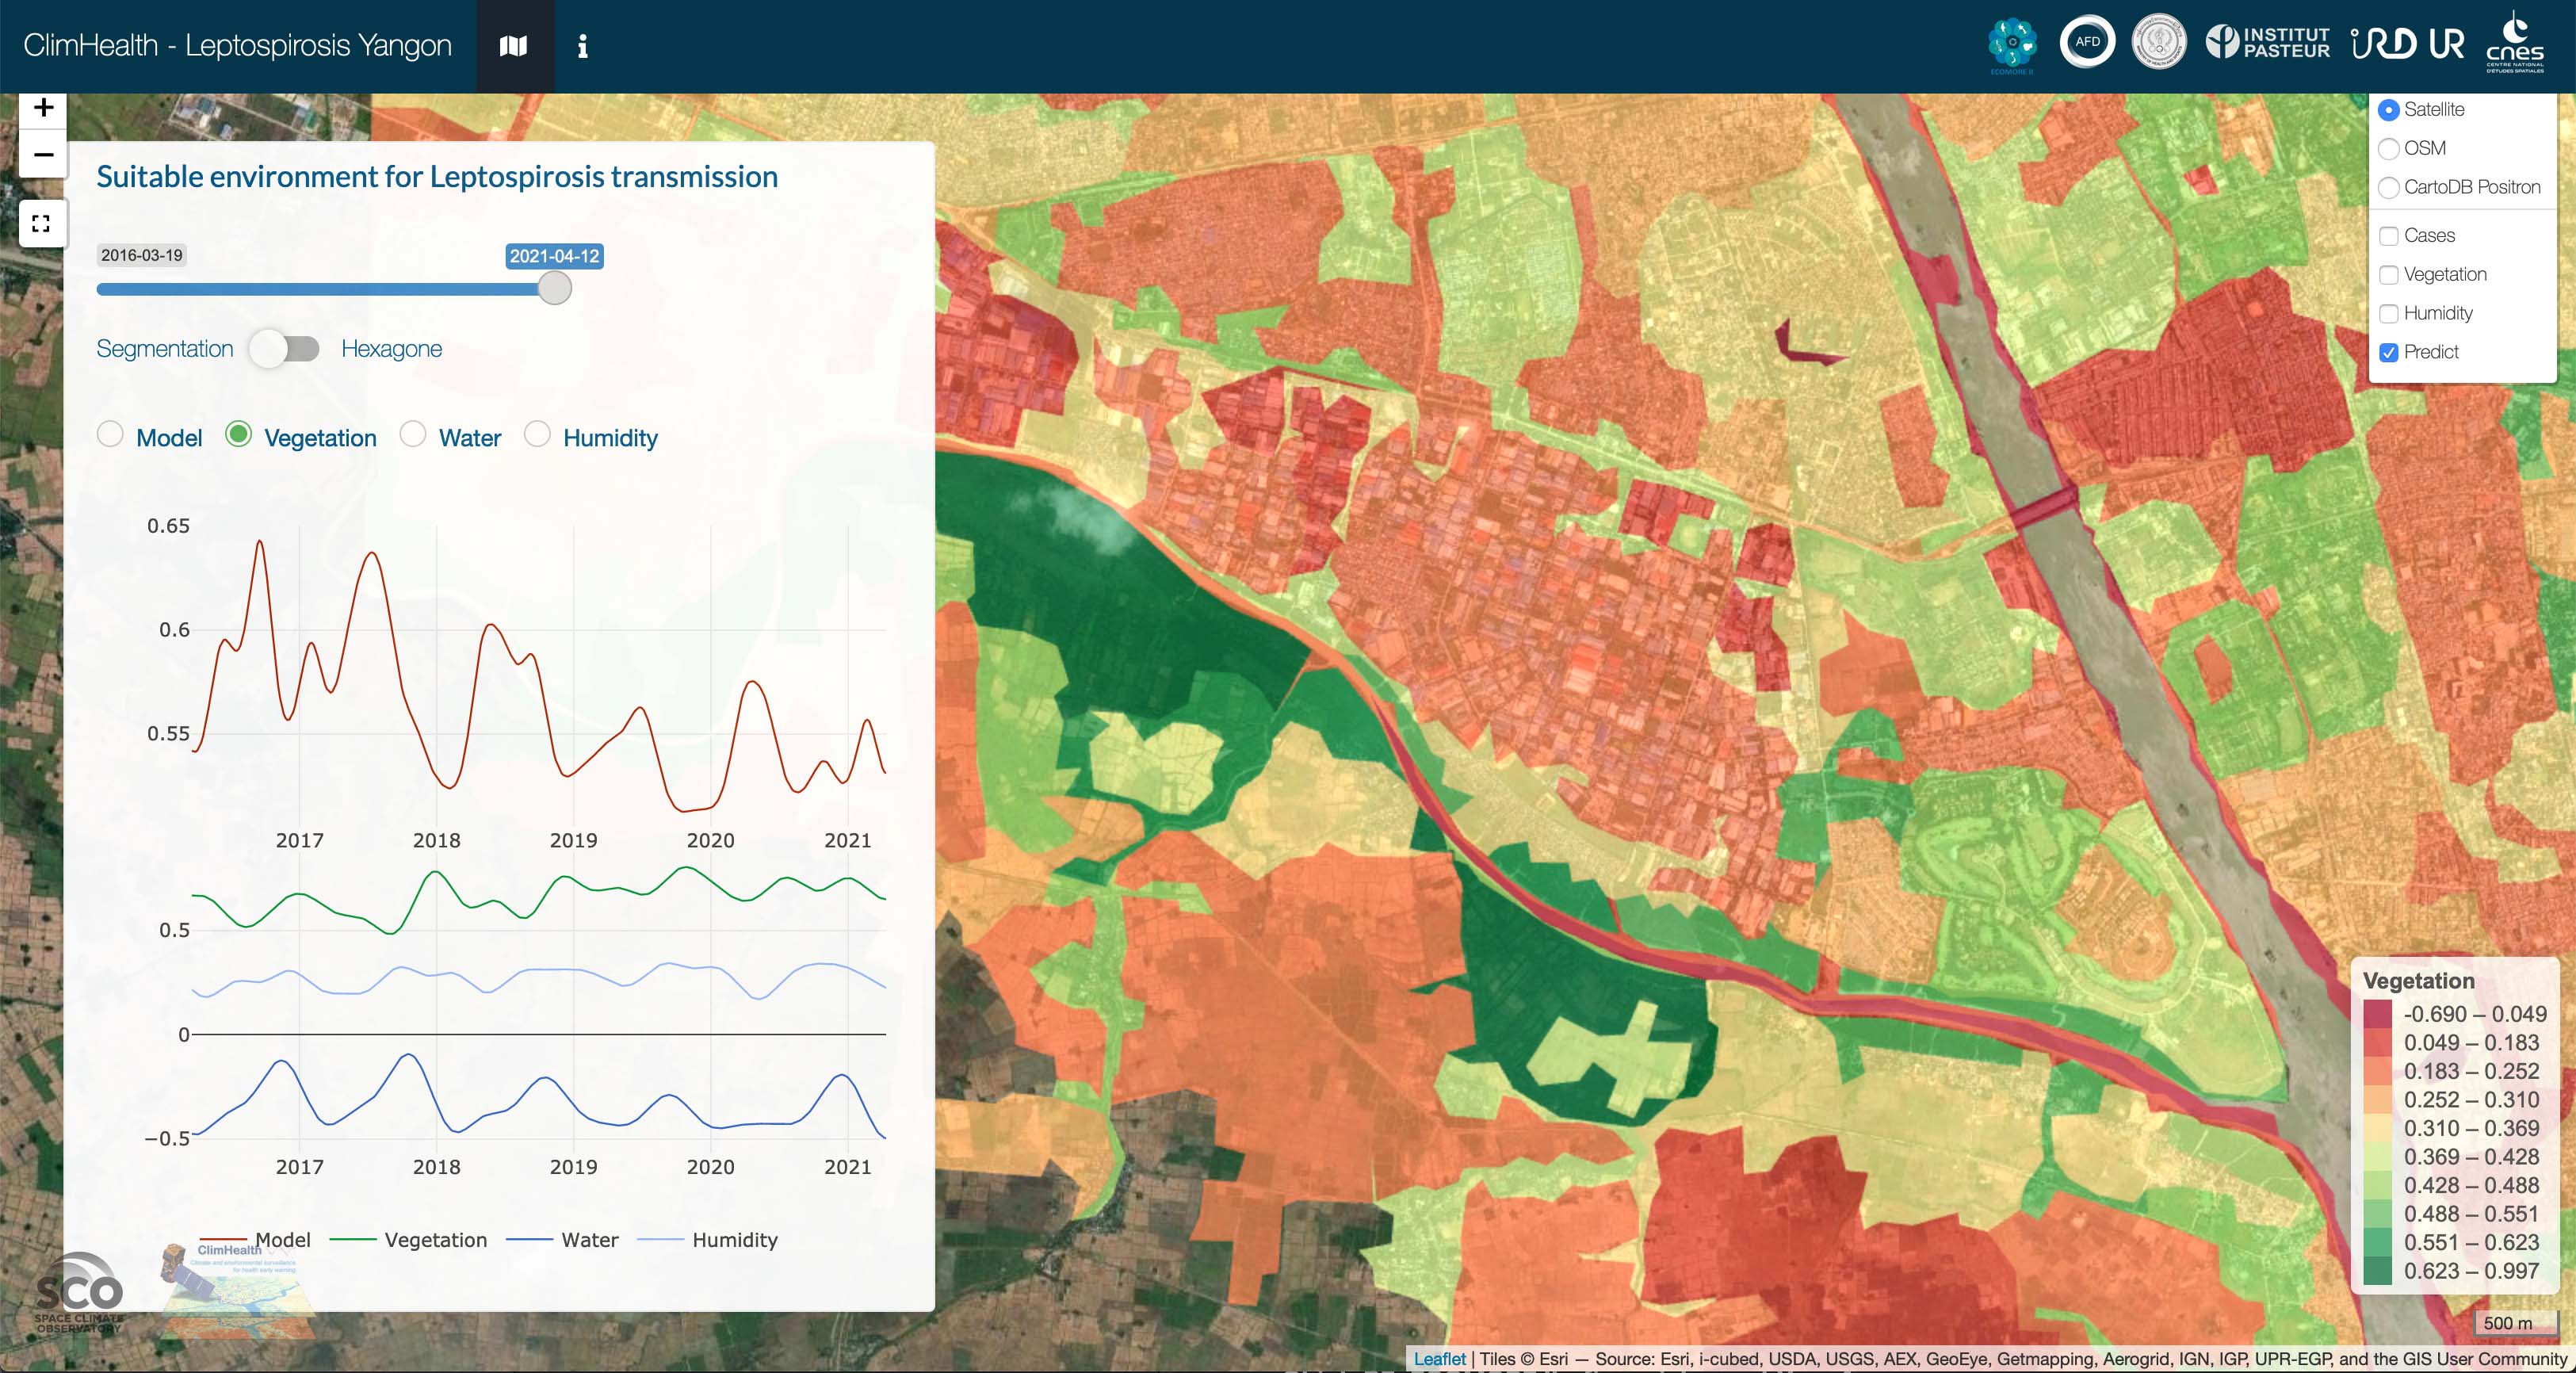
Layer 3: Visualization of the NDVI vegetation index. © IRD/Contains modified Copernicus Data
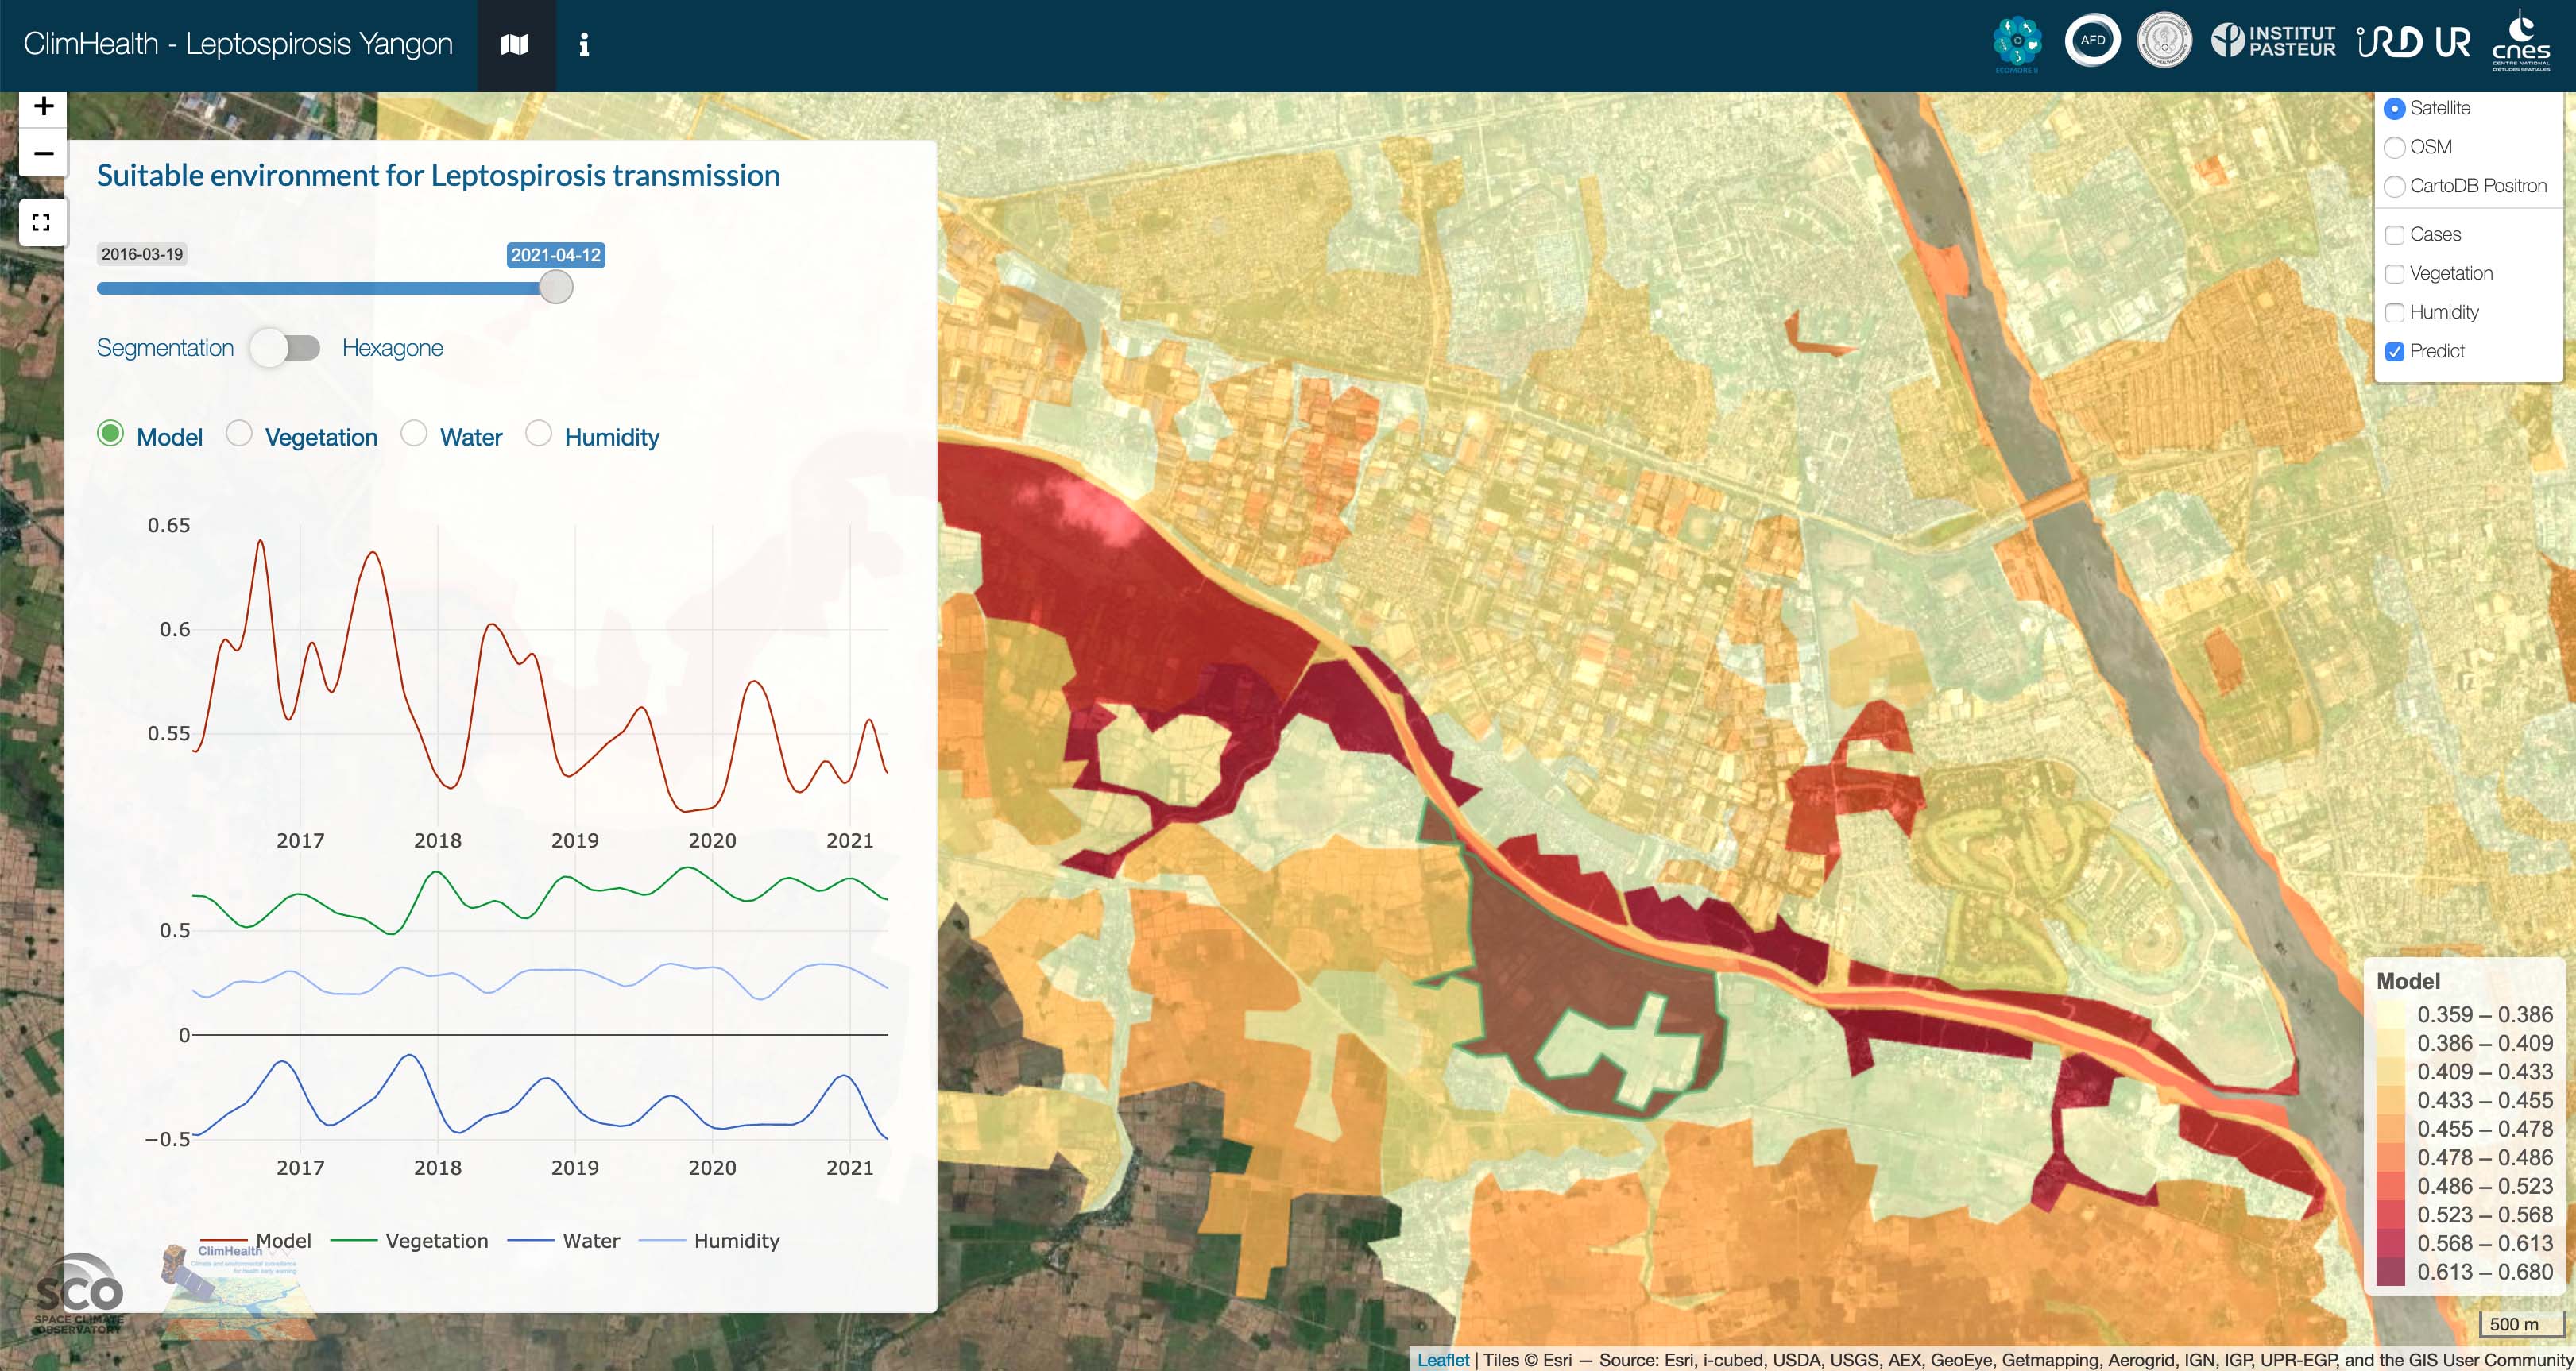
Layer 4: Global model for predicting environments favorable to leptospirosis based on the 3 indices. © IRD/Contains modified Copernicus Data
From demonstrator to DHIS2
Available online and automatically updated with each new Sentinel-2 image, i.e. every five days, the LeptoYangon demonstrator is proving successful. Now that the data production and the mapping interface are operational, the IRD team prepares the integration of the ClimHealth module into the DHIS2 system, which will be effective at the end of 2022.
----------
DHIS2 (District Health Information Software 2) is the world's most widely used Health Information Management System, covering a population of approximately 2.4 billion people in over 100 countries. It was developed under an open source license in international collaboration. With a database and dashboard visualization capabilities, its platform offers users the ability to generate analyses from real-time data.