

Facing cyclones with Cimopolée
The strength and speed at which cyclones develop is becoming more and more surprising every year. This is entirely logical, since they are driven by warm ocean water, and ocean temperatures are rising all the time. For countries frequently exposed to their paths, understanding the phenomenon and monitoring and quantifying its impacts is becoming a necessity.
As in Madagascar, where the Cimopolée project is being implemented and coordinated by the Espace-Dev Joint Research Unit (UMR), through its University of La Réunion and IRD components, from the SEAS-OI station on La Réunion. The aim is to develop an automatic online tool based on satellite products. As Christophe Révillion, a remote sensing geomatician at UMR Espace Dev, explains, "In Madagascar, a swollen river quickly becomes an insurmountable geographical barrier, preventing emergency services from getting out into the field. It is vital for the public authorities to have as much information as possible as quickly as possible, firstly to anticipate the areas affected and then, once the cyclone has passed, to have information on the populations and infrastructures affected".
Already armed with the automated processing chains based on Sentinel-1 and 2 data that it has developed over the last five years, the project team travelled to Madagascar in October 2023 to present the functionalities it envisages for the future tool to its local partners, the National Office for Risk and Disaster Management in Madagascar (Bureau National de Gestion des Risques et des Catastrophes BNGRC) and the Antananarivo Geophysical Institute and Observatory (Institut et Observatoire de Géophysique d'Antananarivo IOGA).
Case study: Freddy, a double-edged cyclone
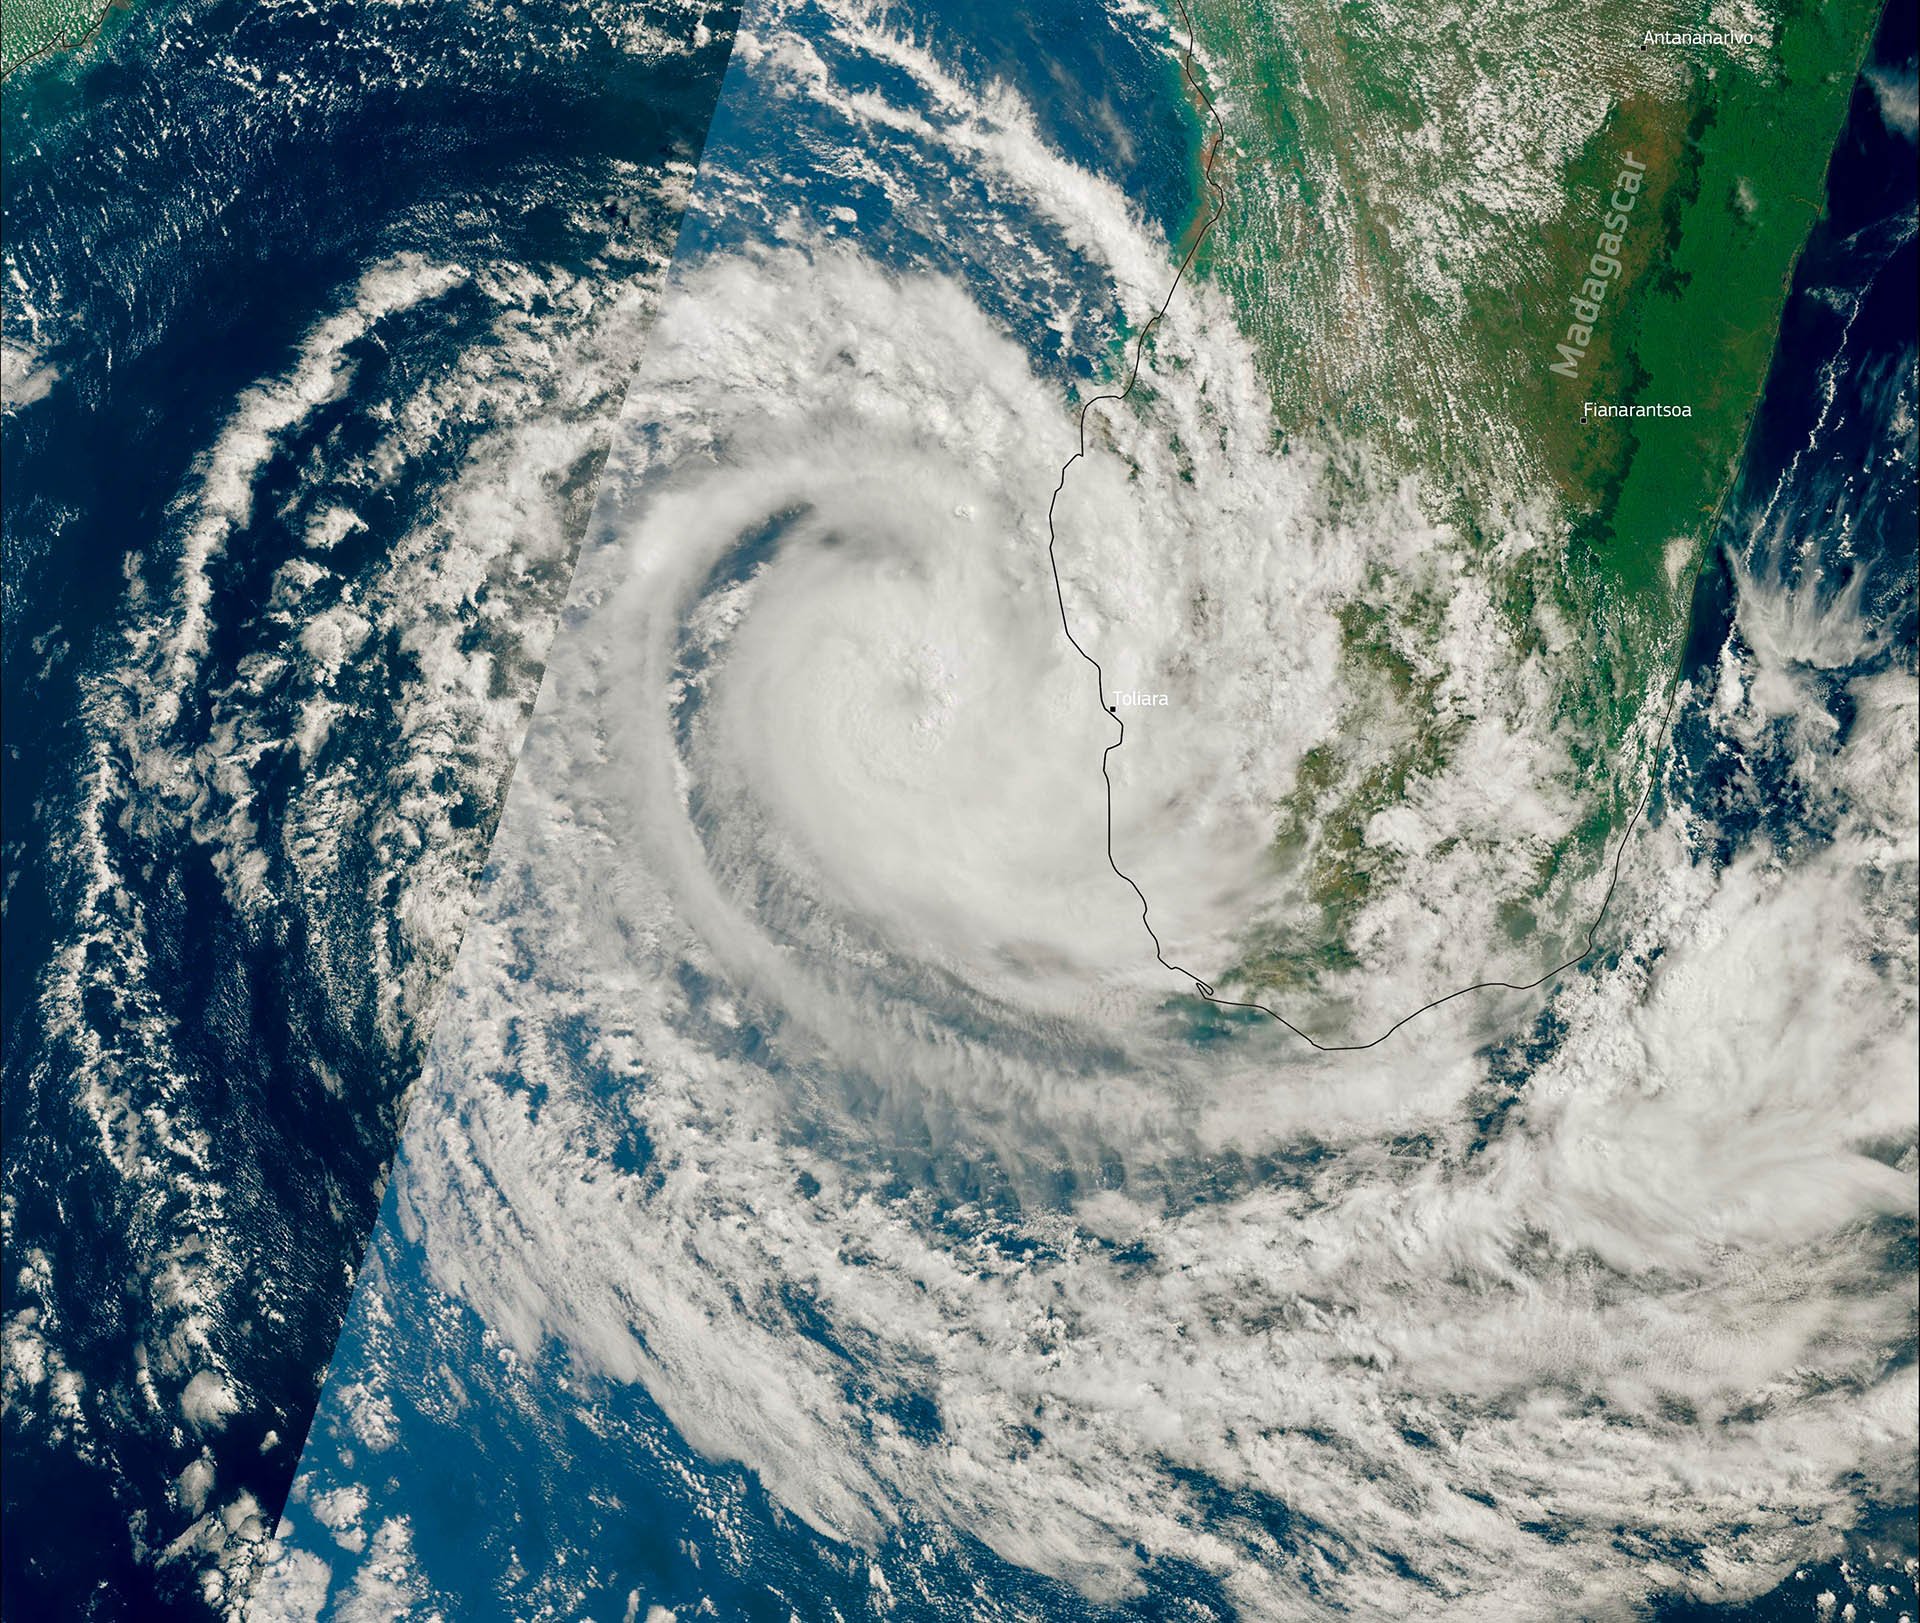
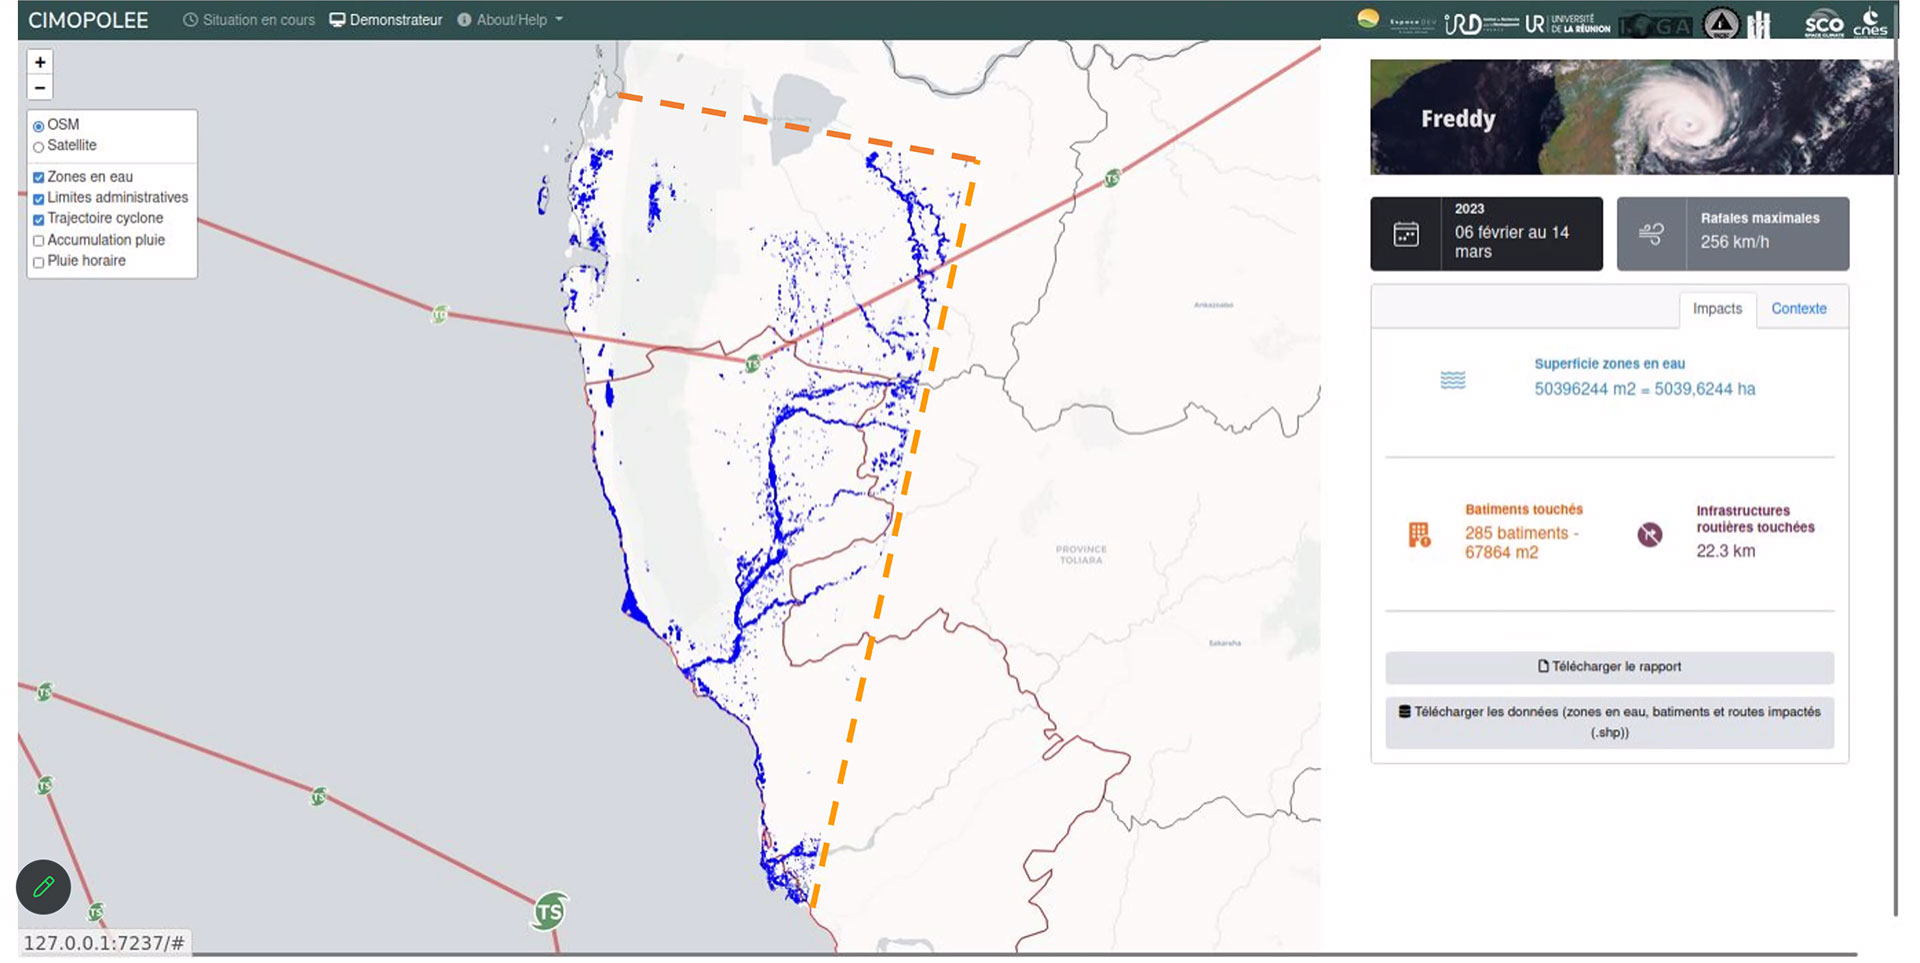
To demonstrate the processing that can be carried out and the data that can be extracted, the team has focused the demonstrator on cyclone Freddy, which crossed Madagascar twice in early 2023.
|
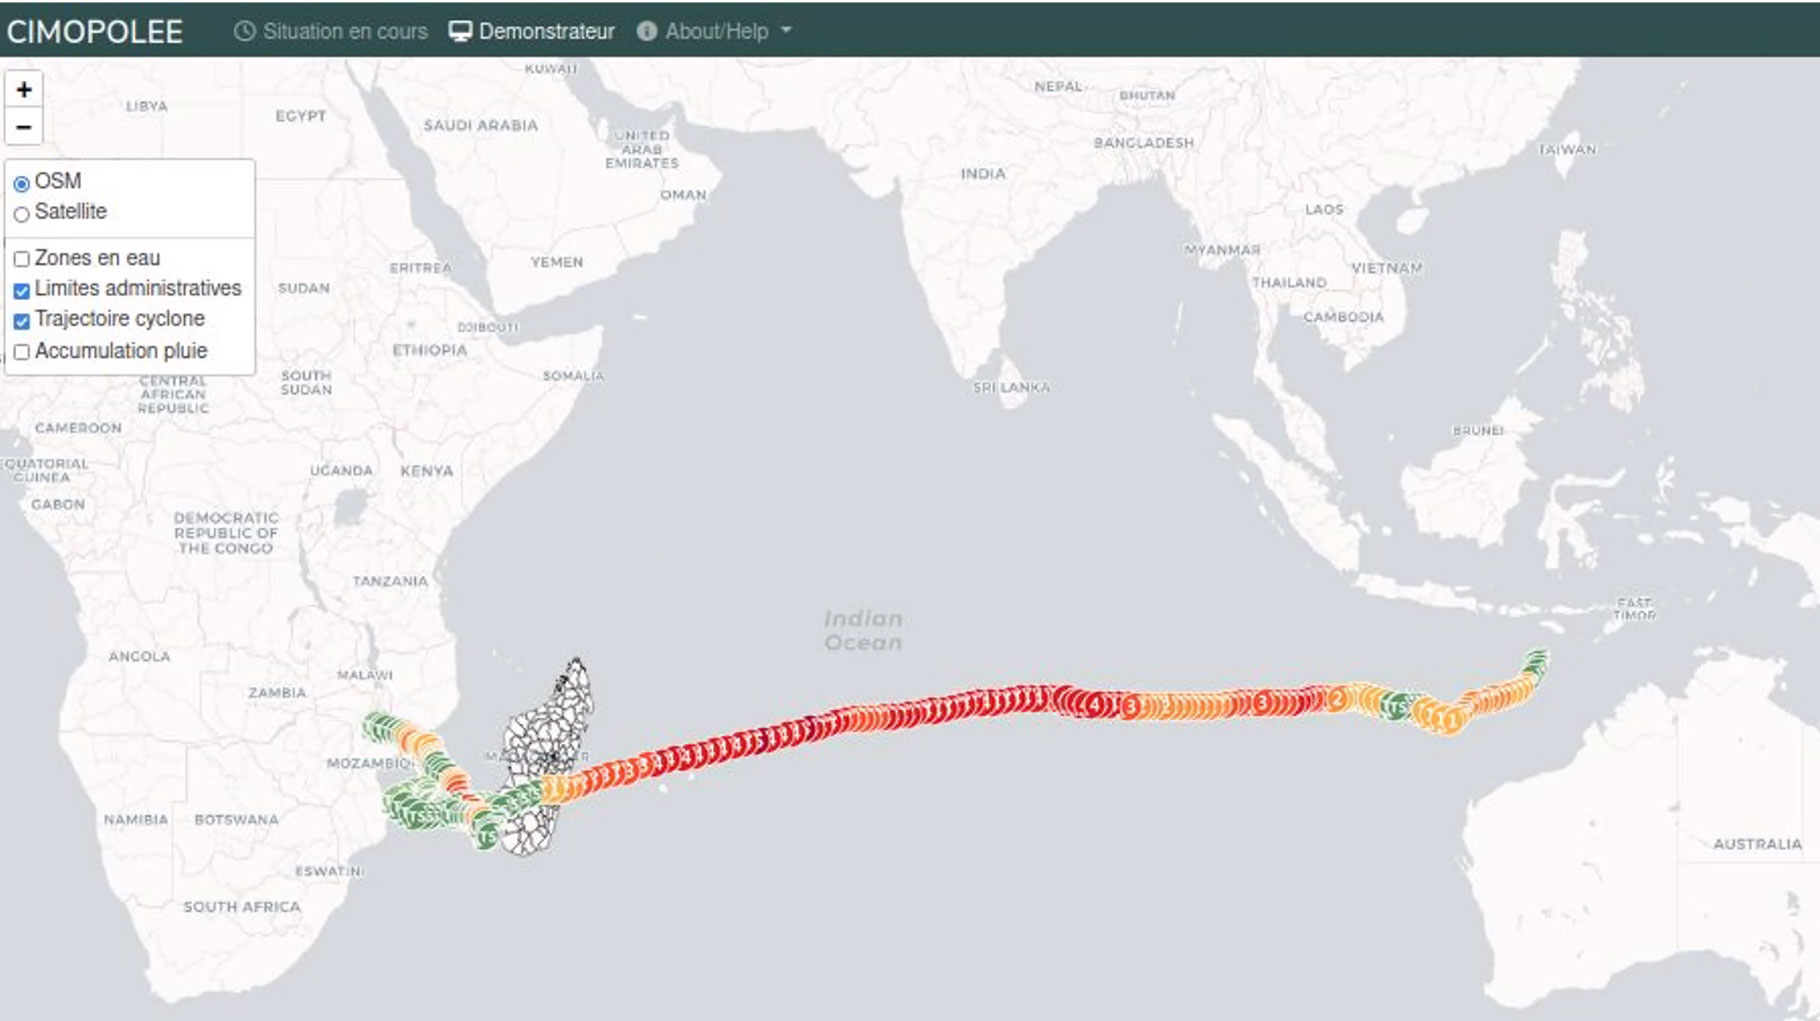
The team began by reconstructing Freddy's trajectory using various measuring points, the color of which varies according to the intensity of the storm. By looking at these measurement points, it appears that the most intense rainfall occurs when the cyclone 'recharges' in the warm waters of the Mozambique Channel. It is therefore around this time that she calibrates her method, selecting Sentinel-1 (radar) and Sentinel-2 (optical) images before and after this episode. |
▲ Hurricane Freddy's path. © Cimopolee |
|
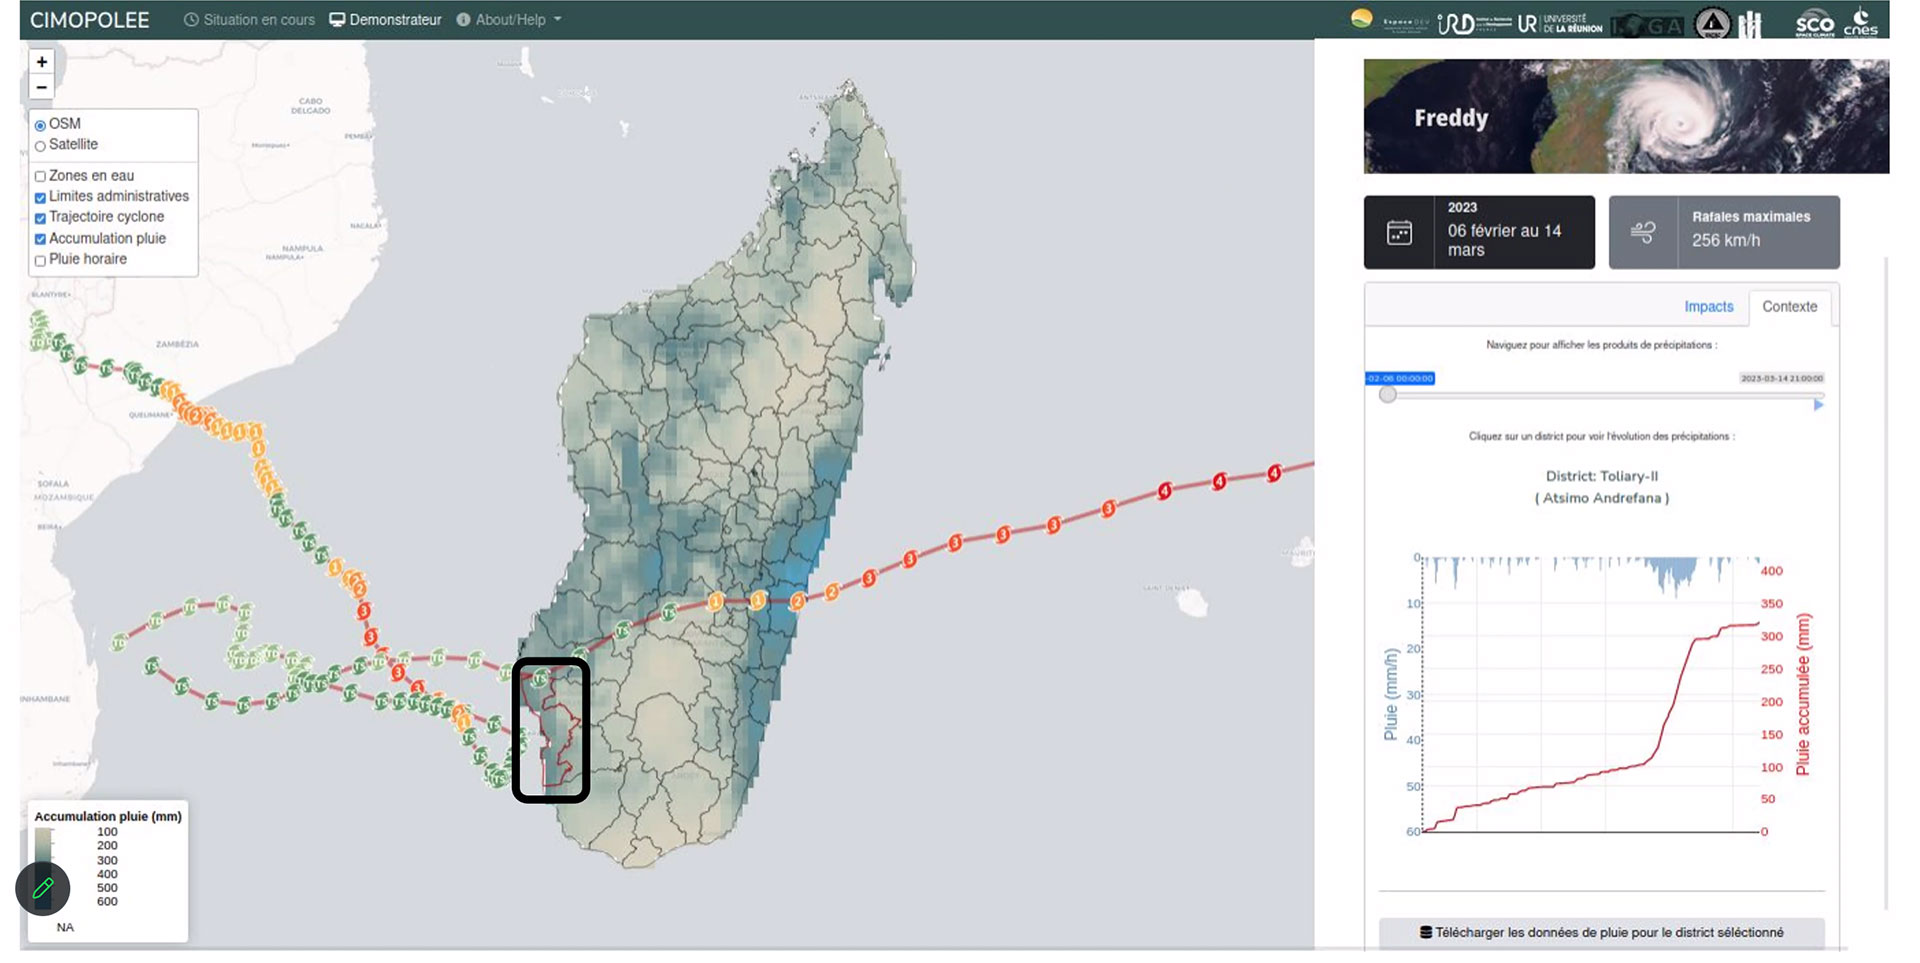
Then, although the rainfall maps show that the east coast is being heavily rained on, the team chose to contextualize the event more specifically in the district of Tuléar, in the south-west of the island. "In this area, which is not usually prone to rain and flooding, the heavy rainfall generated by the cyclone will impact the territory in a different way. This area is therefore of great interest for parameterizing our processing chains designed to predict flooded areas and their surface area", explains Christophe Révillion. |
▲ Post-cyclone rainfall map and selection of the Tuléar district in the black rectangle. © Cimopolée |
|
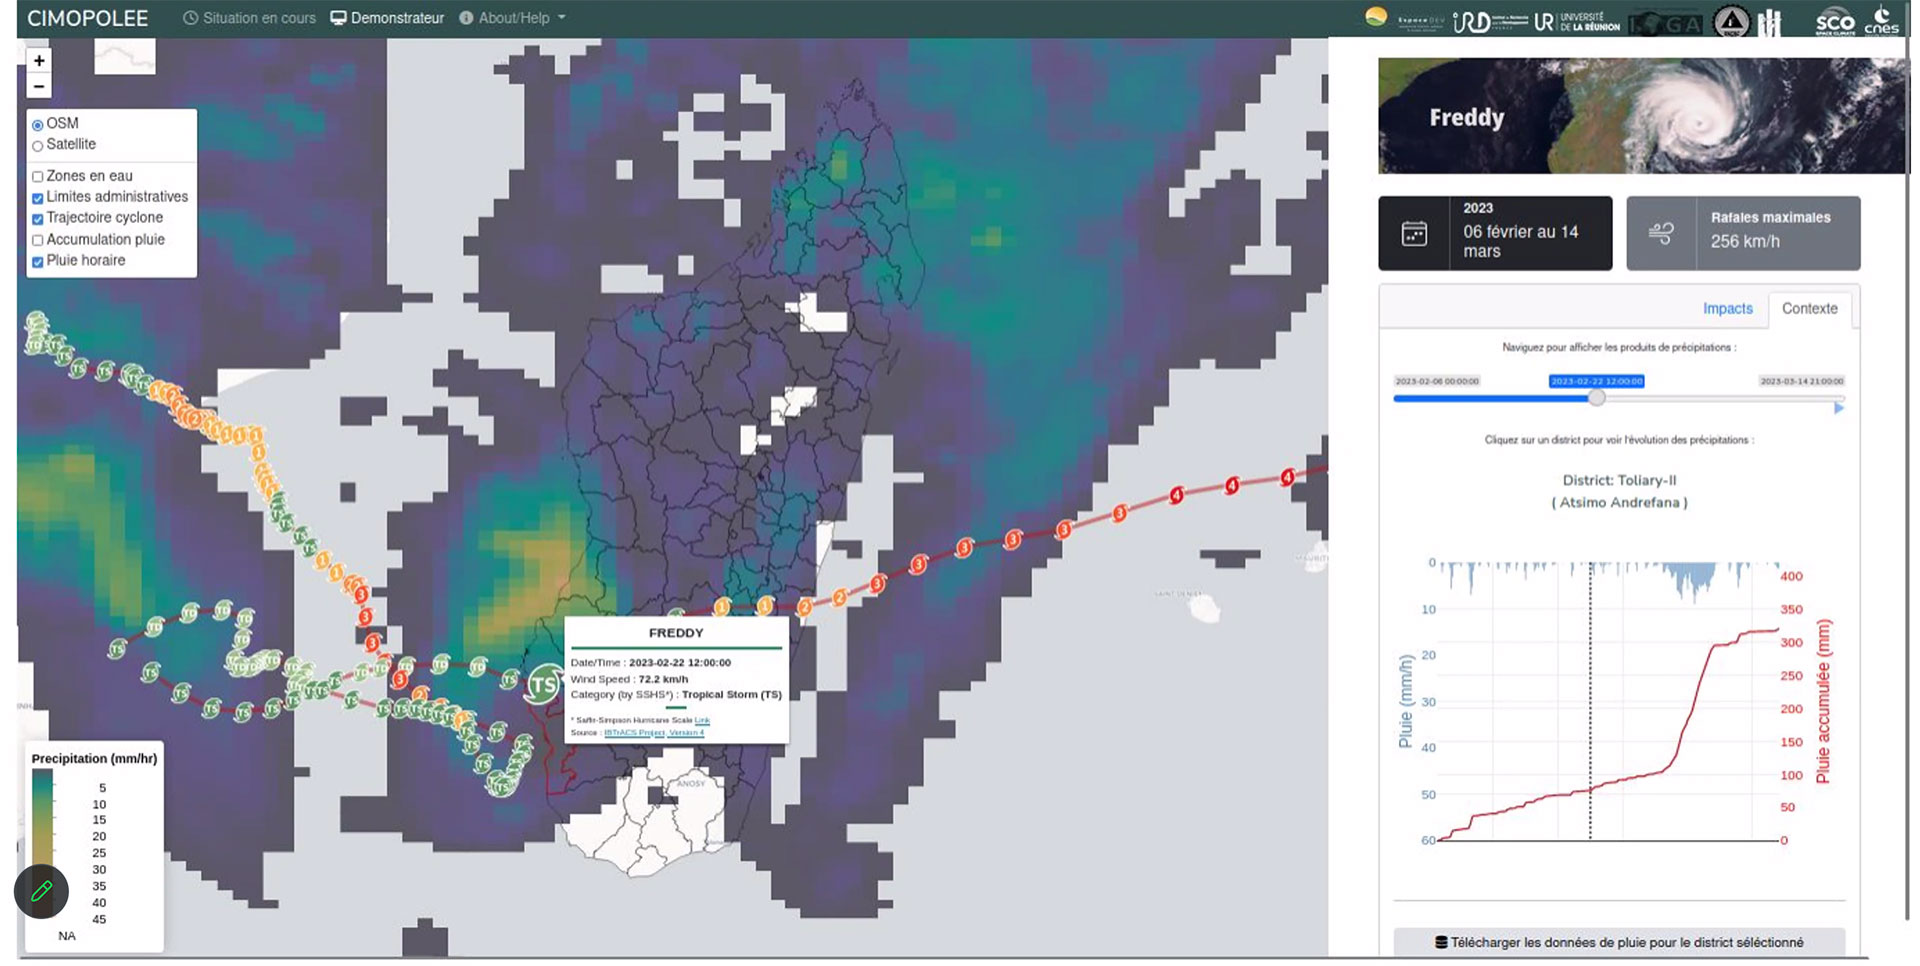
▲ Focus on rainfall measured in the Tuléar district. In the graph on the right, the blue bars are satellite rainfall measurement points, and the red curve shows cumulative rainfall. The overall picture shows a sharp and sudden increase. © Cimopolée |
▲ The processing chain shows the flooded areas of the Tuléar district in blue, with statistical information on the right: dates of the event, maximum gust power, surface area of flooded areas, number of buildings and road infrastructure affected. © Cimopolée |
According to Florent Veillon, remote sensing and programming engineer, "Our aim is to produce a semi-automatic or even 100% automatic system. As far as context data is concerned, we know that we can aim for 100% because we are already systematically producing Sentinel-2 satellite data for SEAS-OI, which is stored in our database. Rainfall data, which is also satellite data, can easily be retrieved automatically in near-real time. We are therefore working to ensure that our processing chains can automate the detection of changes to produce impact maps, particularly of flooded areas".
Meeting with the BNGRC
|
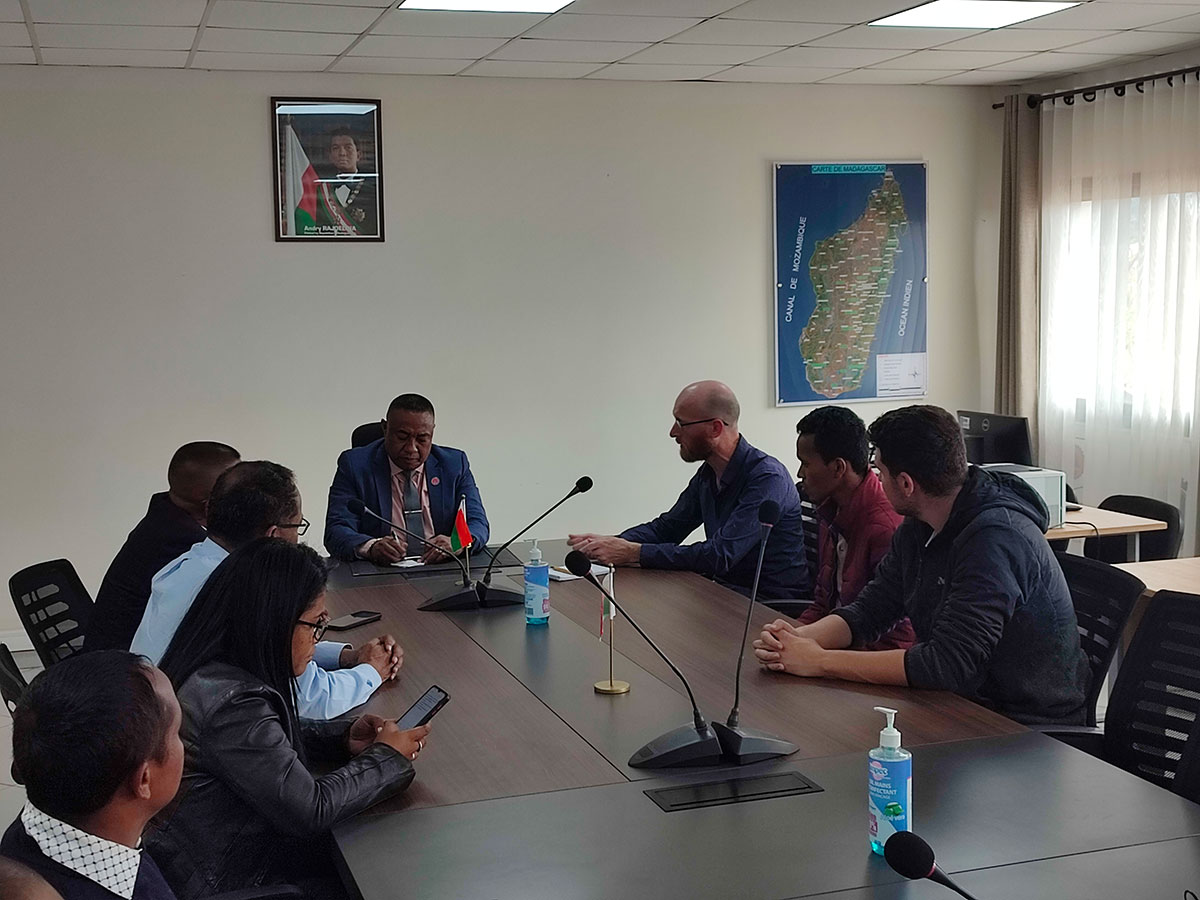
At the end of the user workshop, the Cimopolée team was invited to visit the premises of the BNGRC in Madagascar. Welcomed by the Director, he was very knowledgeable about the project.
▶︎ Working meeting during a visit to the BNGRC operations center. © UMR Espace-Dev |
|
This gave Christophe Révillion and Florent Veillon an extra boost of motivation: "The institution is really interested in this partnership, and is expecting hydrological data, particularly on flooded areas. We discovered a very well-equipped and well-thought-out service, in particular the control room from which they can alert the local population when they identify that a risk is approaching an area. To do this, they have monitors on which cartographic and geographical data from in situ measurement stations are displayed in real time, as well as many telephone reports of observations, including from private individuals. Cimopolée's information, based on spatial data, can be perfectly integrated into their system to provide them with the data they need".
Full steam ahead!
The project team will now be able to adjust its processing chains to the needs and comments expressed by future users, as well as developing the interface best suited to all this. Interactive and freely accessible, it will offer the possibility of retrieving all the data in GIS format so that they can be injected into their own system.
As the BNGRC has expressed a wish to test the tool as early as the next hurricane season (January to February - or even April - 2024), the team is doing its utmost to deliver a first prototype at the end of 2023-beginning of 2024.
Previously, Florent Veillon and Pascal Rakotomondrindra, an engineer at the BNGRC, were part of the SCO delegation at GEO Week from 6 to 10 November 2023 to present this method and its objectives.