


FloodML at the heart of the French FloodCare service
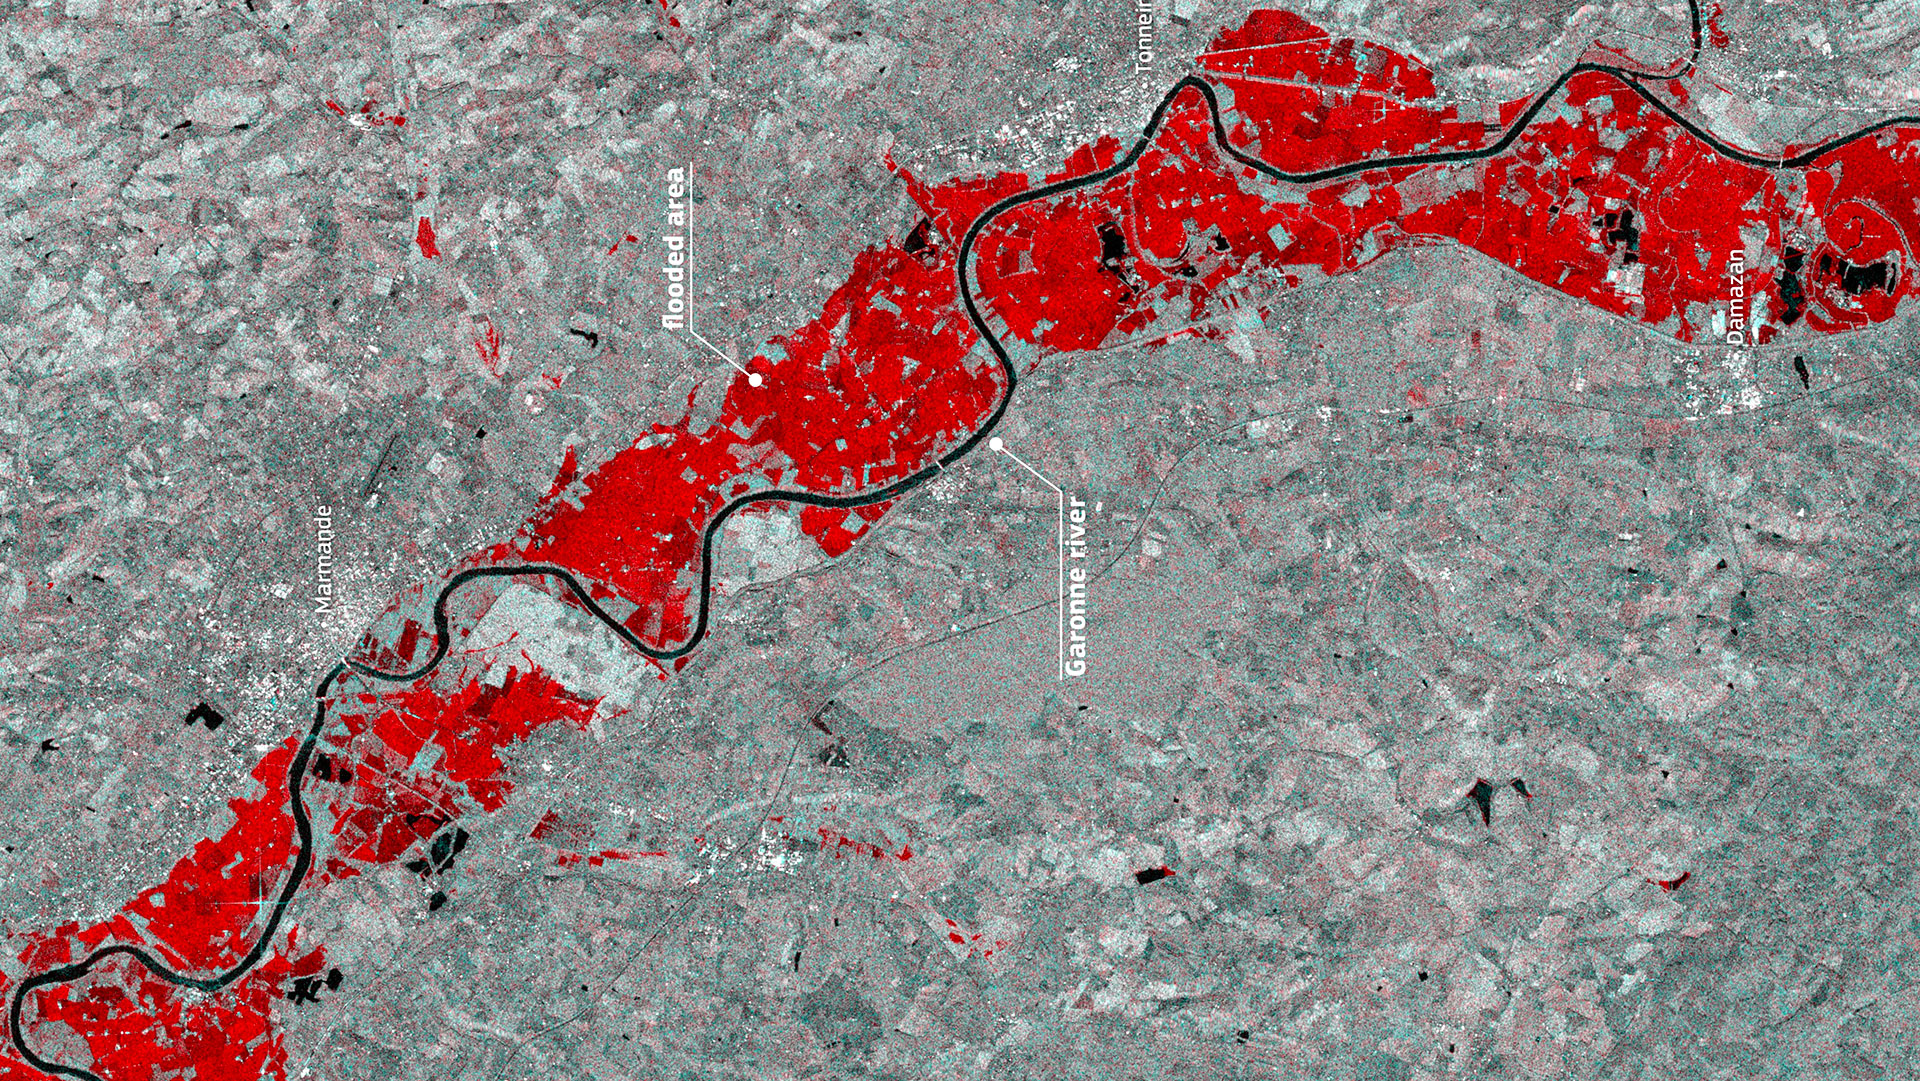
Their names are similar, and this is no coincidence: implemented as part of the France 2030 initiative, FloodCare – the innovative French flood crisis management demonstrator – operates in part thanks to FloodML, a satellite image processing algorithm developed through the SCO FloodDam project! Deployed during the exceptional floods of winter 2026, FloodCare is set to become an essential tool for the future. | The SCO boosts services to make them operational, but it also aims to support pioneering projects, such as FloodDam, which develop satellite data processing capabilities capable of supporting operational public services. |
Winter 2026: an exceptional hydrological situation…
With more than 40 consecutive days of rainfall, the winter of 2026 broke a rainfall record not seen since Météo-France began collecting such data in 1959. This was due to exceptional hydrological conditions, resulting in an unusually prolonged period of heavy rainfall and simultaneous flooding across a large number of catchment areas, affecting both densely populated and rural areas.
… Taking the plunge
On the ground, crisis and emergency response teams had to manage simultaneous red alerts across almost the entire western half of the country. Given the severity of the events, it was decided to activate the new FloodCare service, which had been tested under operational conditions in the as part of the France 2030 Flood Crisis Management Service programme.
FloodCare is a crisis management support service that aims to provide, in near real time, satellite observation products designed to assess the extent of flooding and support operational decision-making: mapping of flood extent, refined contour lines (including water levels), and mapping of road passability.
To this end, activating the service enables the use of satellite imagery, notably Sentinel-1 (radar) and Sentinel-2 (optical) over the affected area, but also – and this is a distinctive feature of FloodCare – triggers the acquisition of high-resolution private satellite imagery (Umbra, Pléiades, Pléiades Neo, Capella, RADARSAT, EUSI, etc.). Then, for each new image received, FloodCare generates a flood map. The service is operated jointly by SERTIT Strasbourg and CLS, with the latter utilizing the FloodML processing chain. | Supporting Civil Protection |
👉 Over 147 products generated by SERTIT and CLS from 34 satellite images covering 9 areas in February 2026: please do take a look at the news section on the FloodCare website, which describes and illustrates how events unfolded.
FloodML in action: a closer look at Marmande
Let’s look at how the FloodML algorithm works, using a Sentinel-1 radar image acquired on 19 February 2026 at 17:46. It should be noted that it can also work from an optical image, but as the thick cloud cover during this period meant that very few optical images were available, it was mainly radar images that were used (as they are unaffected by clouds and rain).
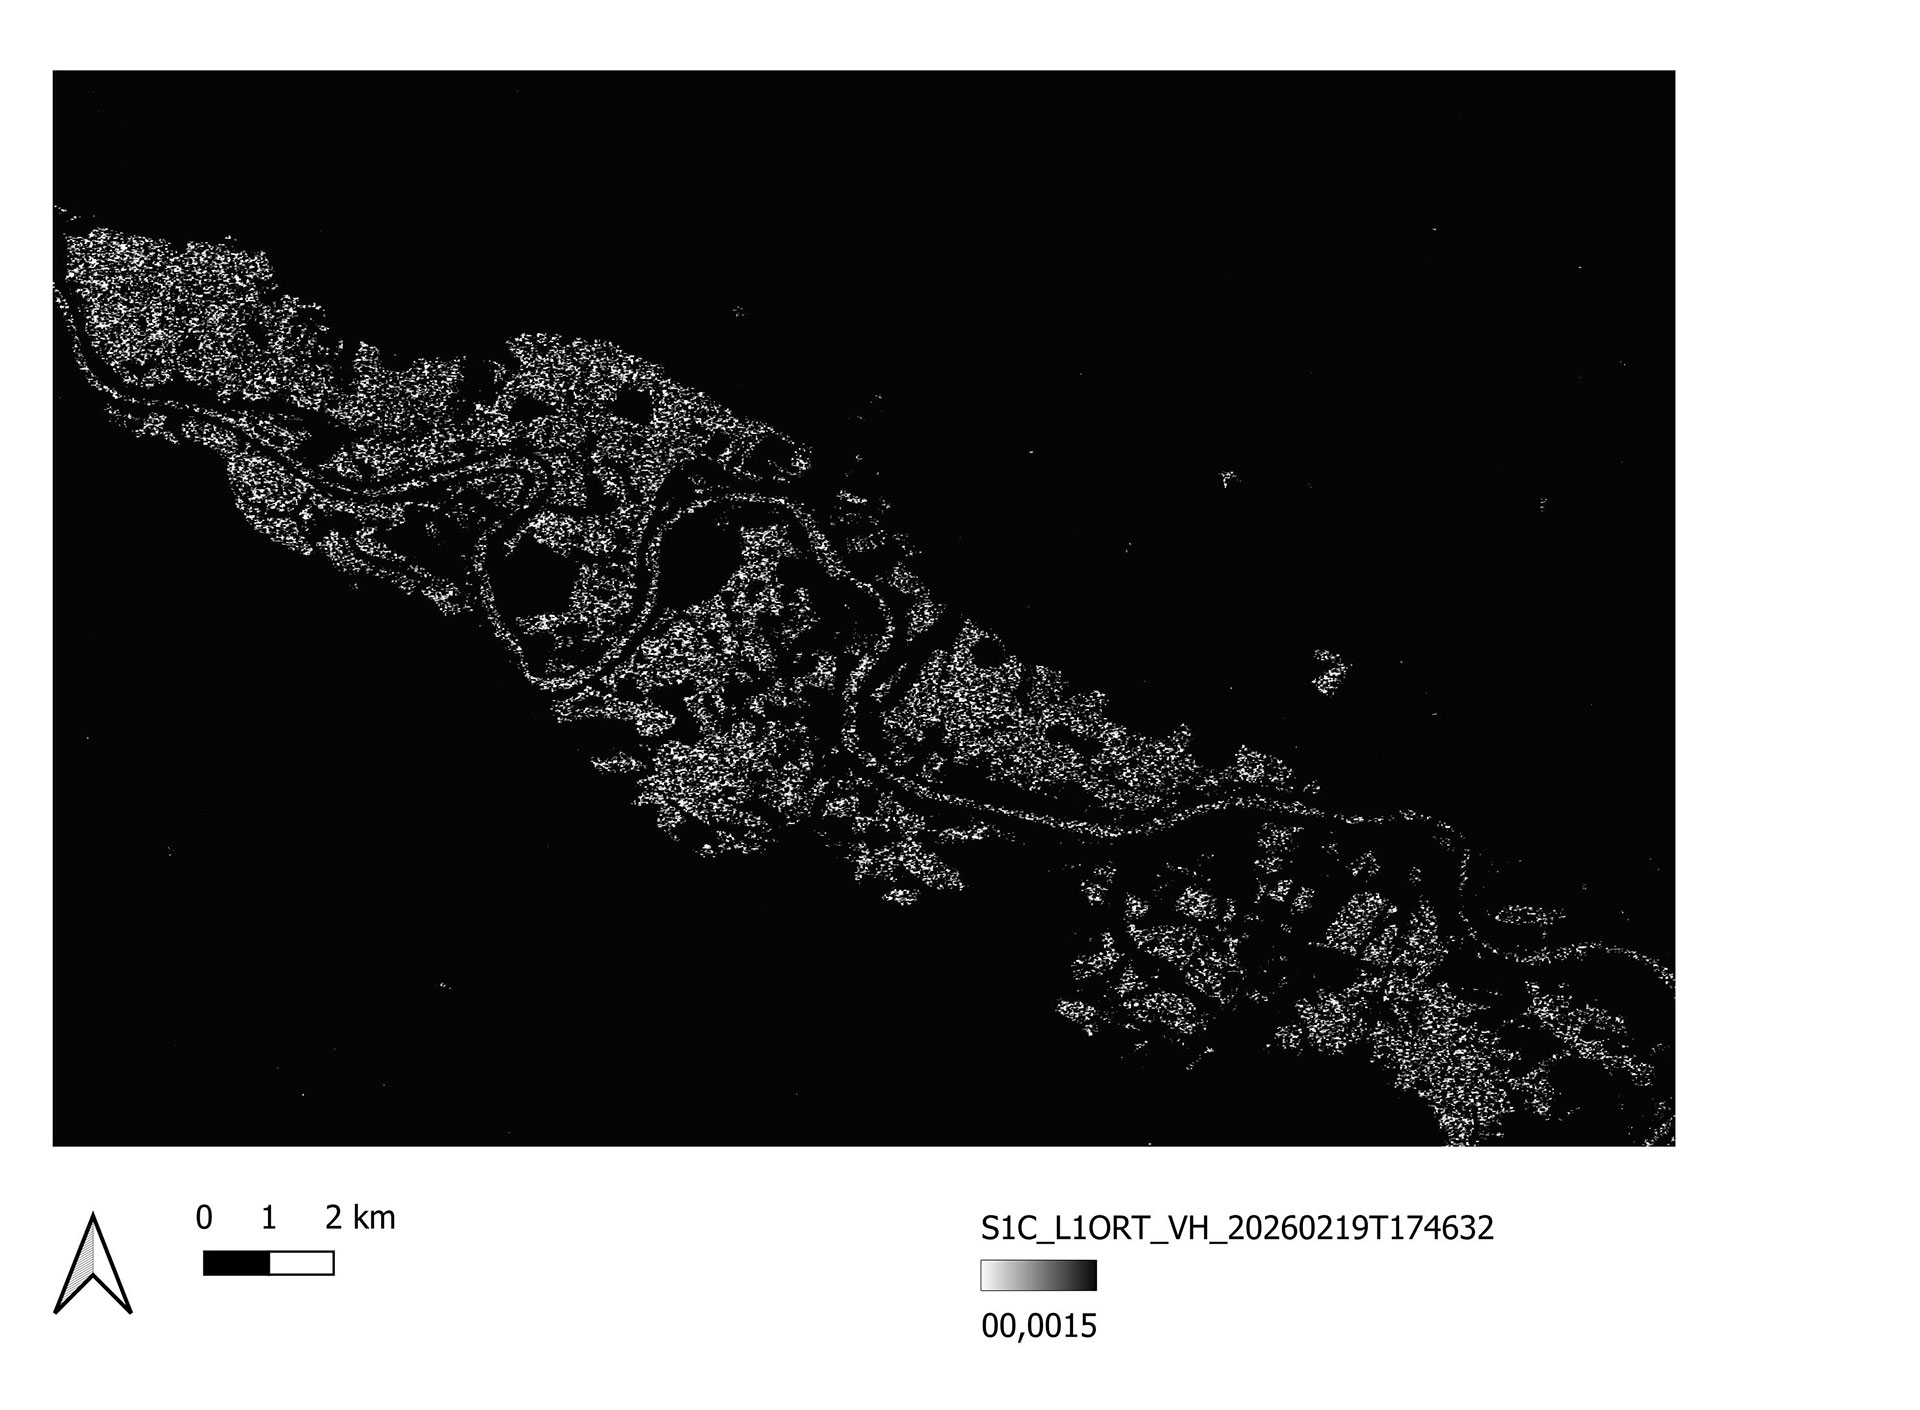 ▲ The radar sends an electromagnetic wave (chirp) towards the surface and measures the backscatter of the wave, i.e. the amount of radiation reflected from the ground back to the sensor: white corresponds to water surfaces and black to the rest of the ground. | 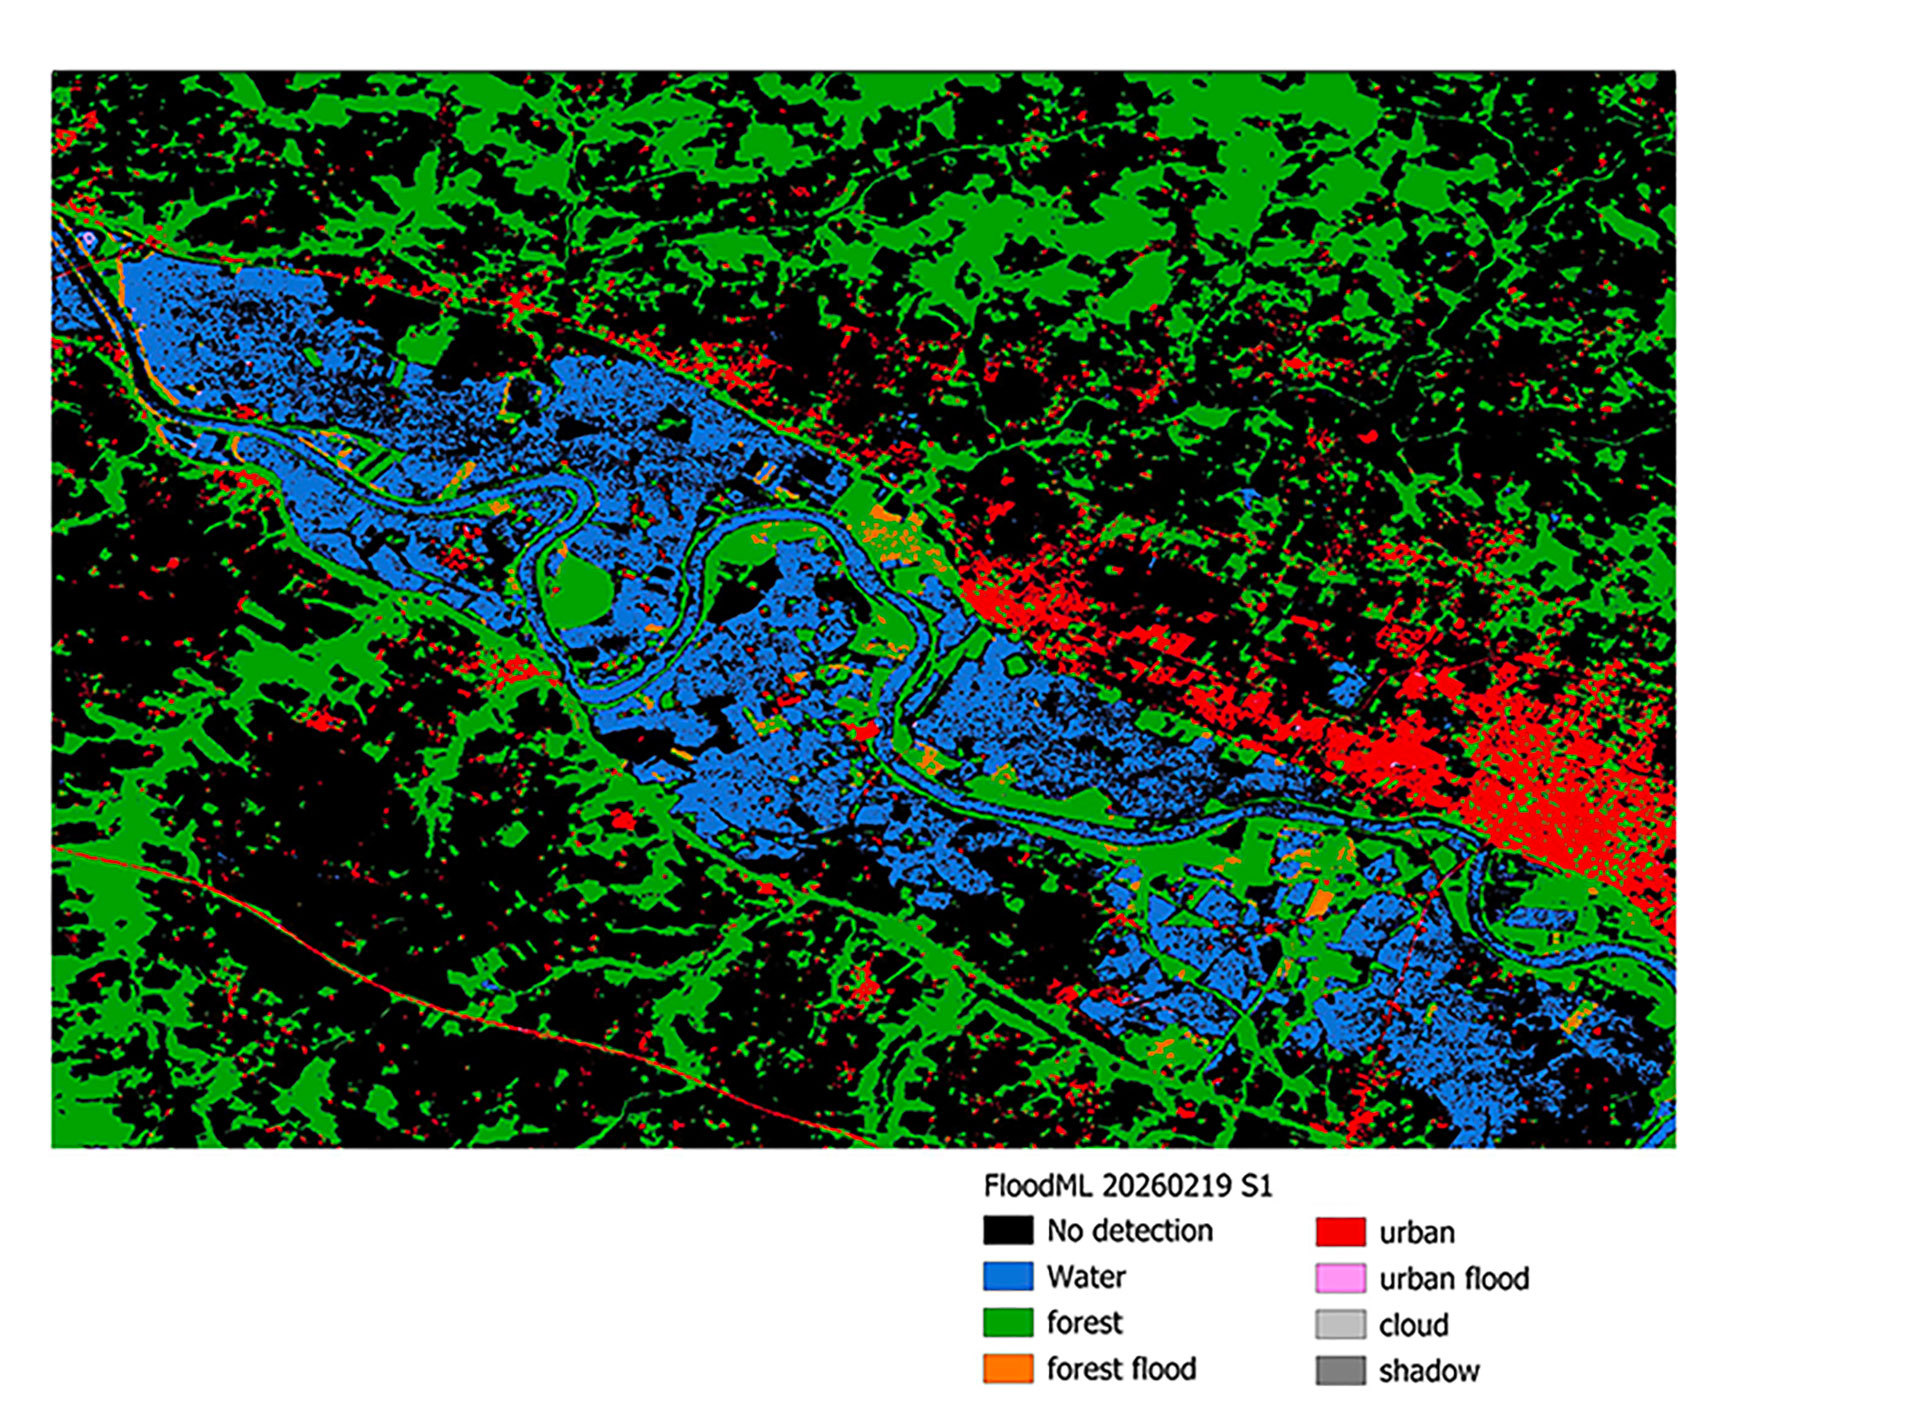 ▲ By overlaying this mask onto the ESA WorldCover land-use map, FloodML highlights forests and built-up areas, whether flooded or not, or likely to be flooded. |
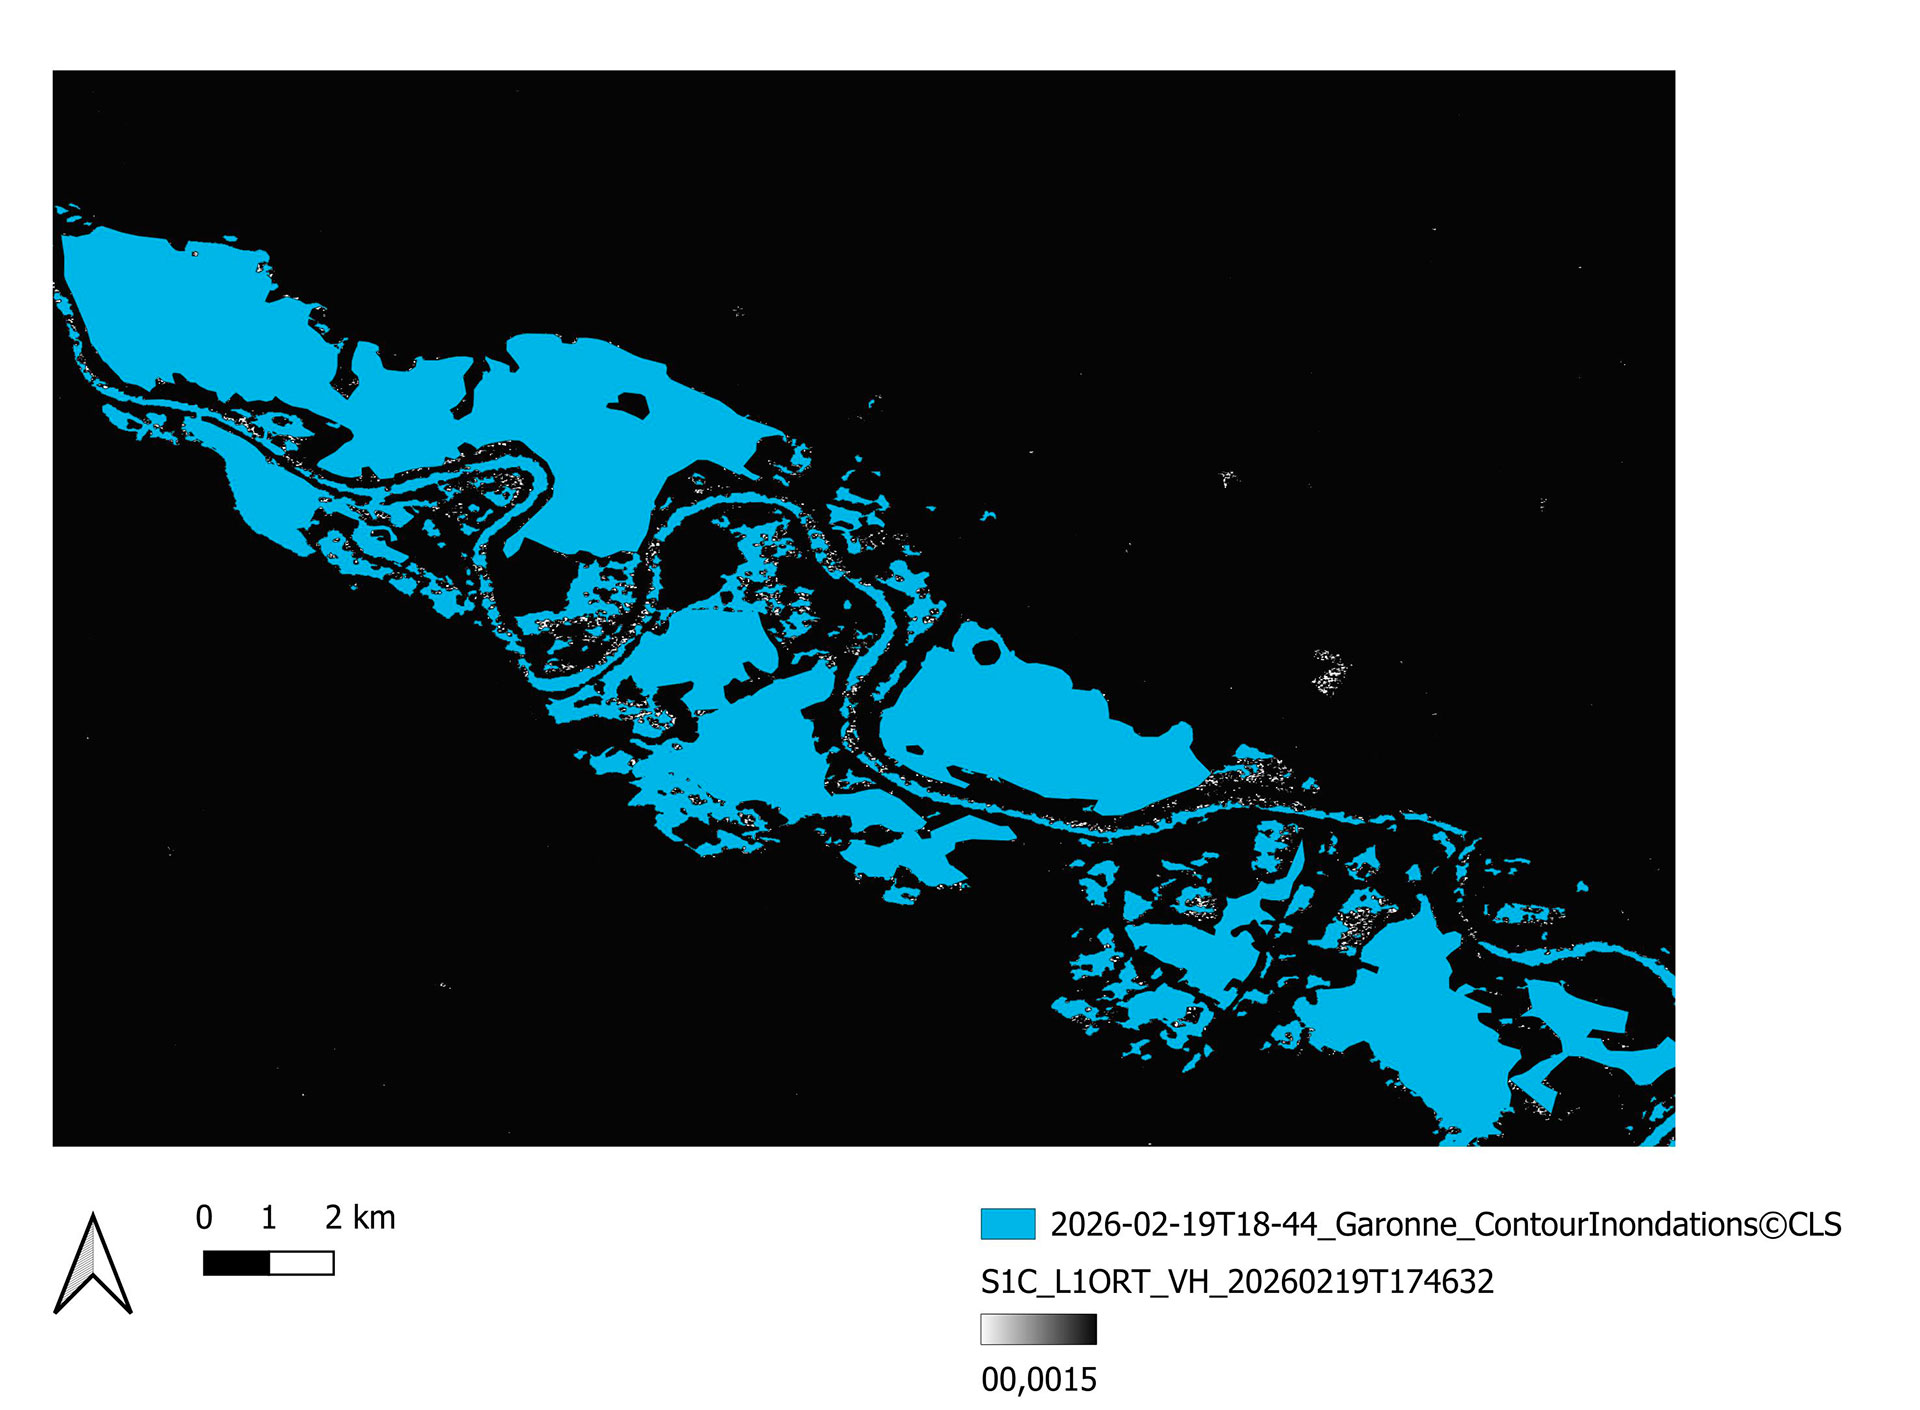 ▲ Extraction of the flood boundary calculated by FloodML from the radar image. | 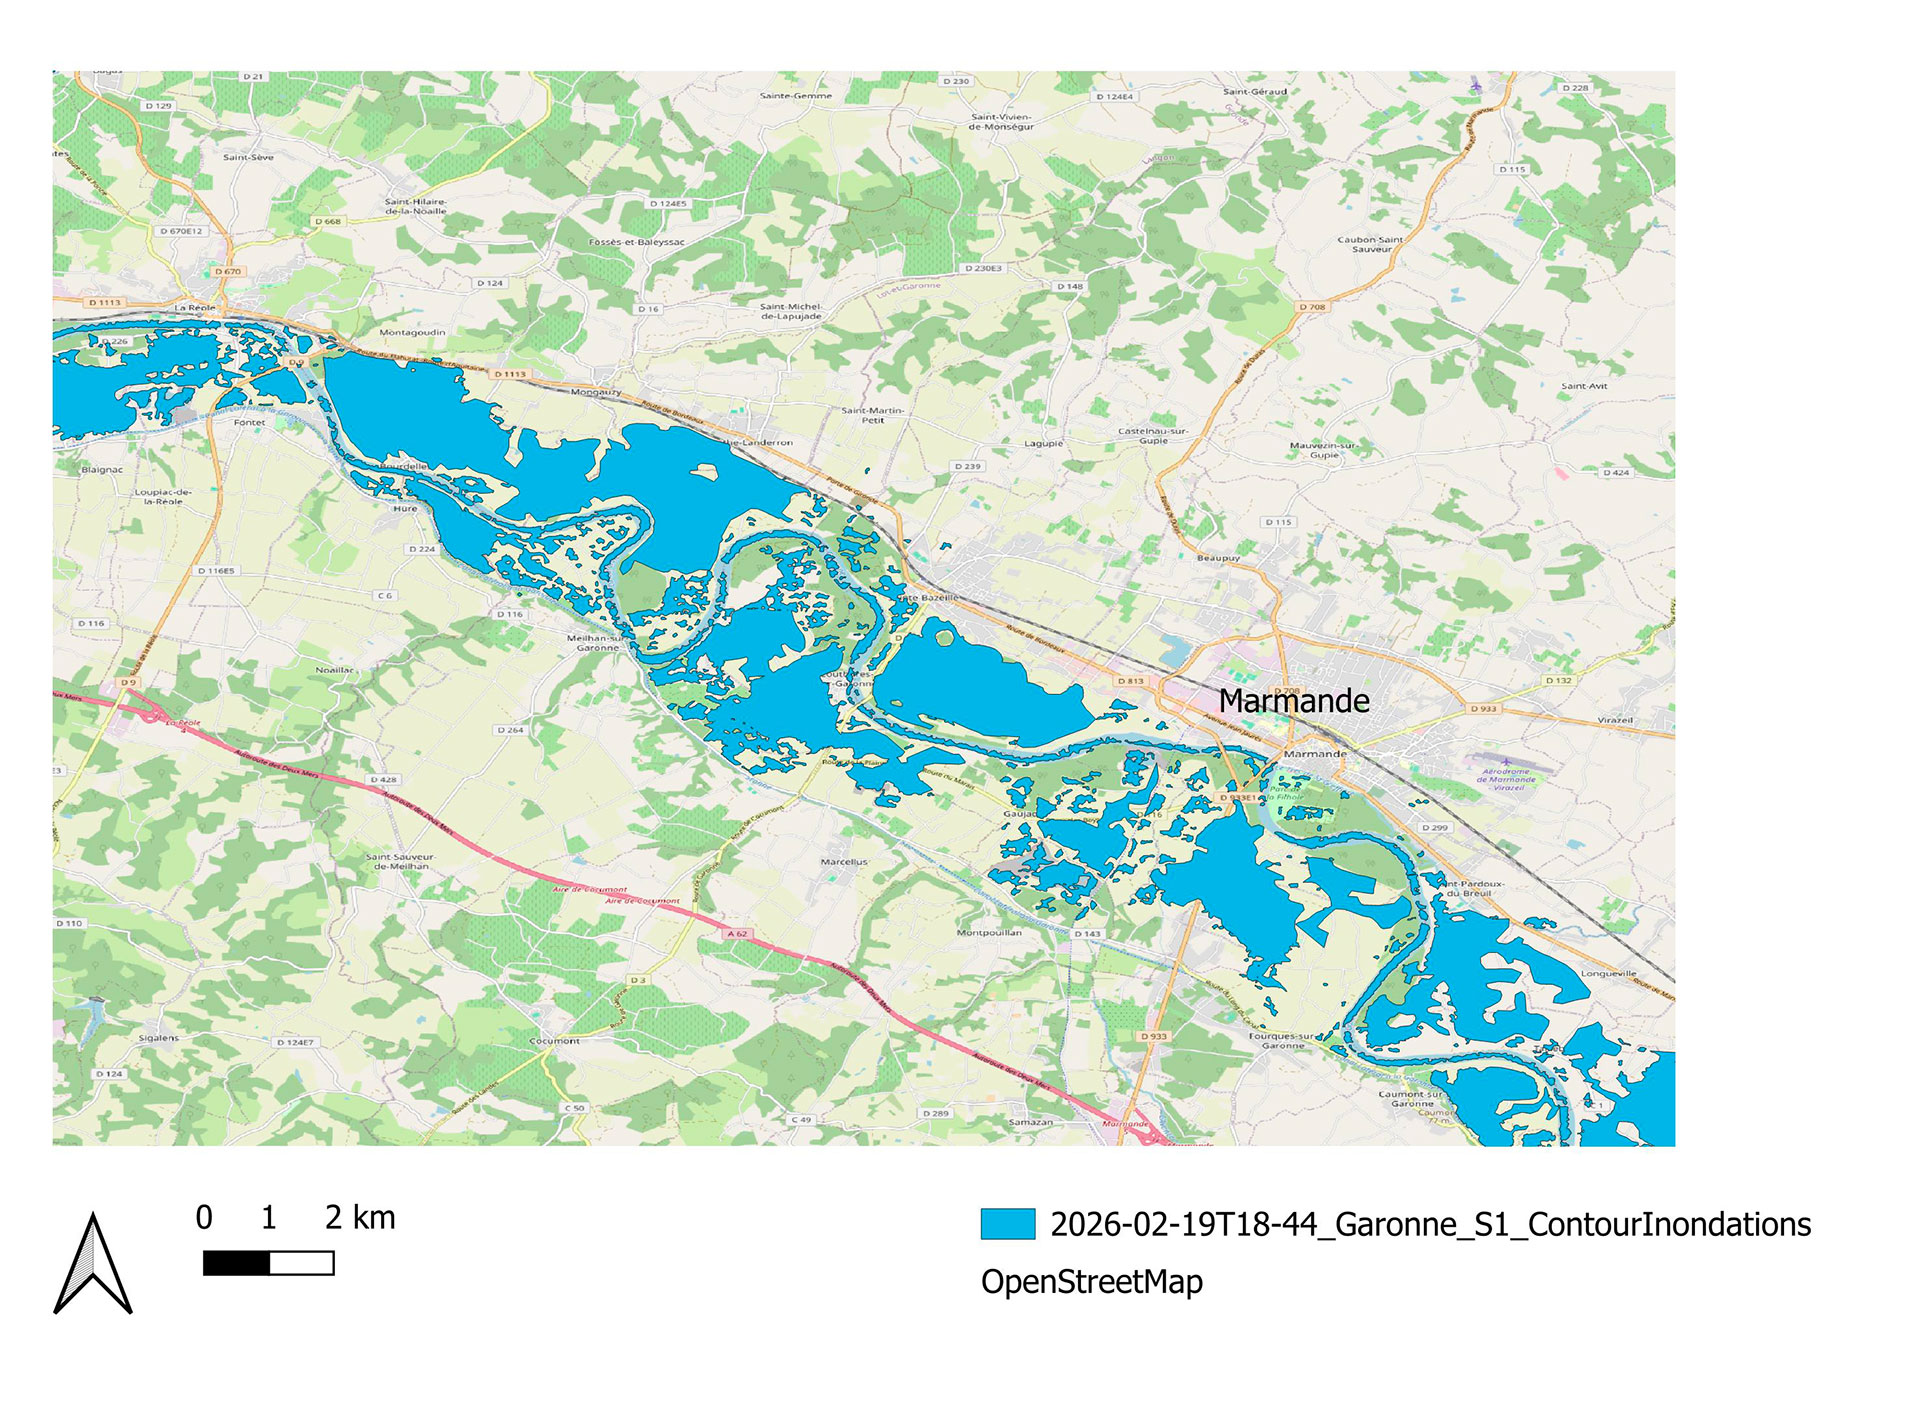 ▲ The flood boundary is overlaid on an OpenStreetMap background to facilitate geographical location. |
🚨 To all local authorities wishing to adopt a similar tool: the FloodML algorithm is open source on the CNES GitHub repository. Please feel free to contact the project team that developed it.
Coming soon
With such good results, the adventure is far from over!
Eventually, FloodCare will offer maps for detecting ice jams.
Meanwhile, FloodML will soon be available as an on-demand service via GEODES, the French national portal for access to satellite data and products.
CNES also plans to integrate FloodML into its Digital Twin Factory to create a hydrological digital twin for flood management.