HEATMAP-PH
Supporting heat resilience in highly urbanized cities in the Philippiness
Overview
Urban Heat Islands are one of the most visible consequences of climate change in tropical cities. In the Philippines, intensified urbanization and declining vegetation have increased exposure to extreme heat, particularly in densely built areas such as Manila, Makati, and Quezon City. Prolonged heat conditions elevate health risks, increase energy consumption, and degrade overall urban comfort and productivity.
The HEATMAP-PH project aims to develop a Heat Vulnerability Index (HVI) designed specifically for Philippine cities. It integrates satellite-derived thermal indicators with socioeconomic and adaptive capacity variables; such as population density, income, age distribution, housing type, and access to green or shaded areas; to identify communities most at risk. HEATMAP-PH thus transforms static temperature maps into a dynamic climate-risk-assessment system capable of informing local governments, health agencies, and planners.
This multidimensional approach allows for a deeper understanding of both the physical and social drivers of heat vulnerability, enabling more targeted and equitable adaptation strategies.
Methodology
Initially, the project will rely on satellite and open-access datasets for scalability and reproducibility. In later phases, Ground Sensor Terminals (GSTs) will be deployed for finer spatial validation and continuous ground-based monitoring. This integration of remote and in-situ data will ensure scientifically sound, policy-relevant, and context-sensitive tools to strengthen heat-resilience planning in Philippine cities. The platform will serve as a decision-support system for local governments, health and disaster-risk-management offices, and academic institutions.
The methodological approach follows the NASA ARSET framework on urban heat-risk mapping, adapted to local data conditions.
Pre-processing and LST Retrieval: Atmospheric and emissivity corrections applied to Landsat and Sentinel imagery using mono-window and split-window algorithms.
Computation of Environmental Indices: Derivation of NDVI, NDBI, albedo, and surface roughness to represent vegetation, built-up extent, and material properties.
Socioeconomic Assessment: Standardization and weighting of demographic and infrastructure indicators such as population density, age structure, poverty incidence, and green-space accessibility.
Integration and Index Computation: Application of Principal Component Analysis (PCA) and Weighted Linear Combination (WLC) to produce the composite Heat Vulnerability Index.
Validation and Uncertainty Analysis: Cross-checking with available meteorological records and sensitivity analysis of weighting parameters. All data will be processed using open-source platforms such as Google Earth Engine, Python, and QGIS to promote transparency and capacity building.
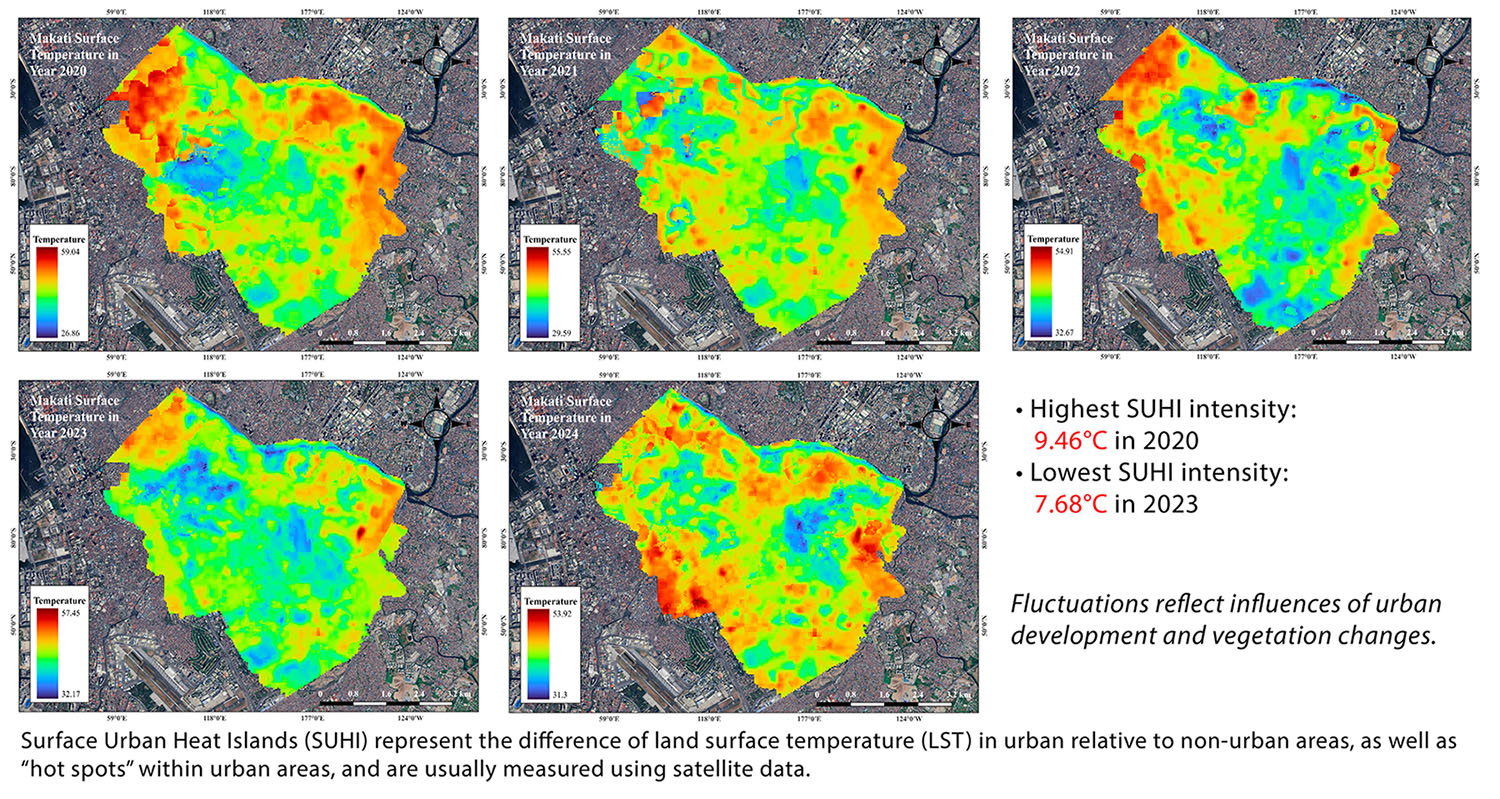
► Makati. Visualization of selected areas that was classified as Rural (left image) and Urban (right image) based in Landsat 8&9 land surface temperature from 2020-2024 in Makati City. © Mark Angelo C. Purio, Jann Rovic Cueto (2025) | 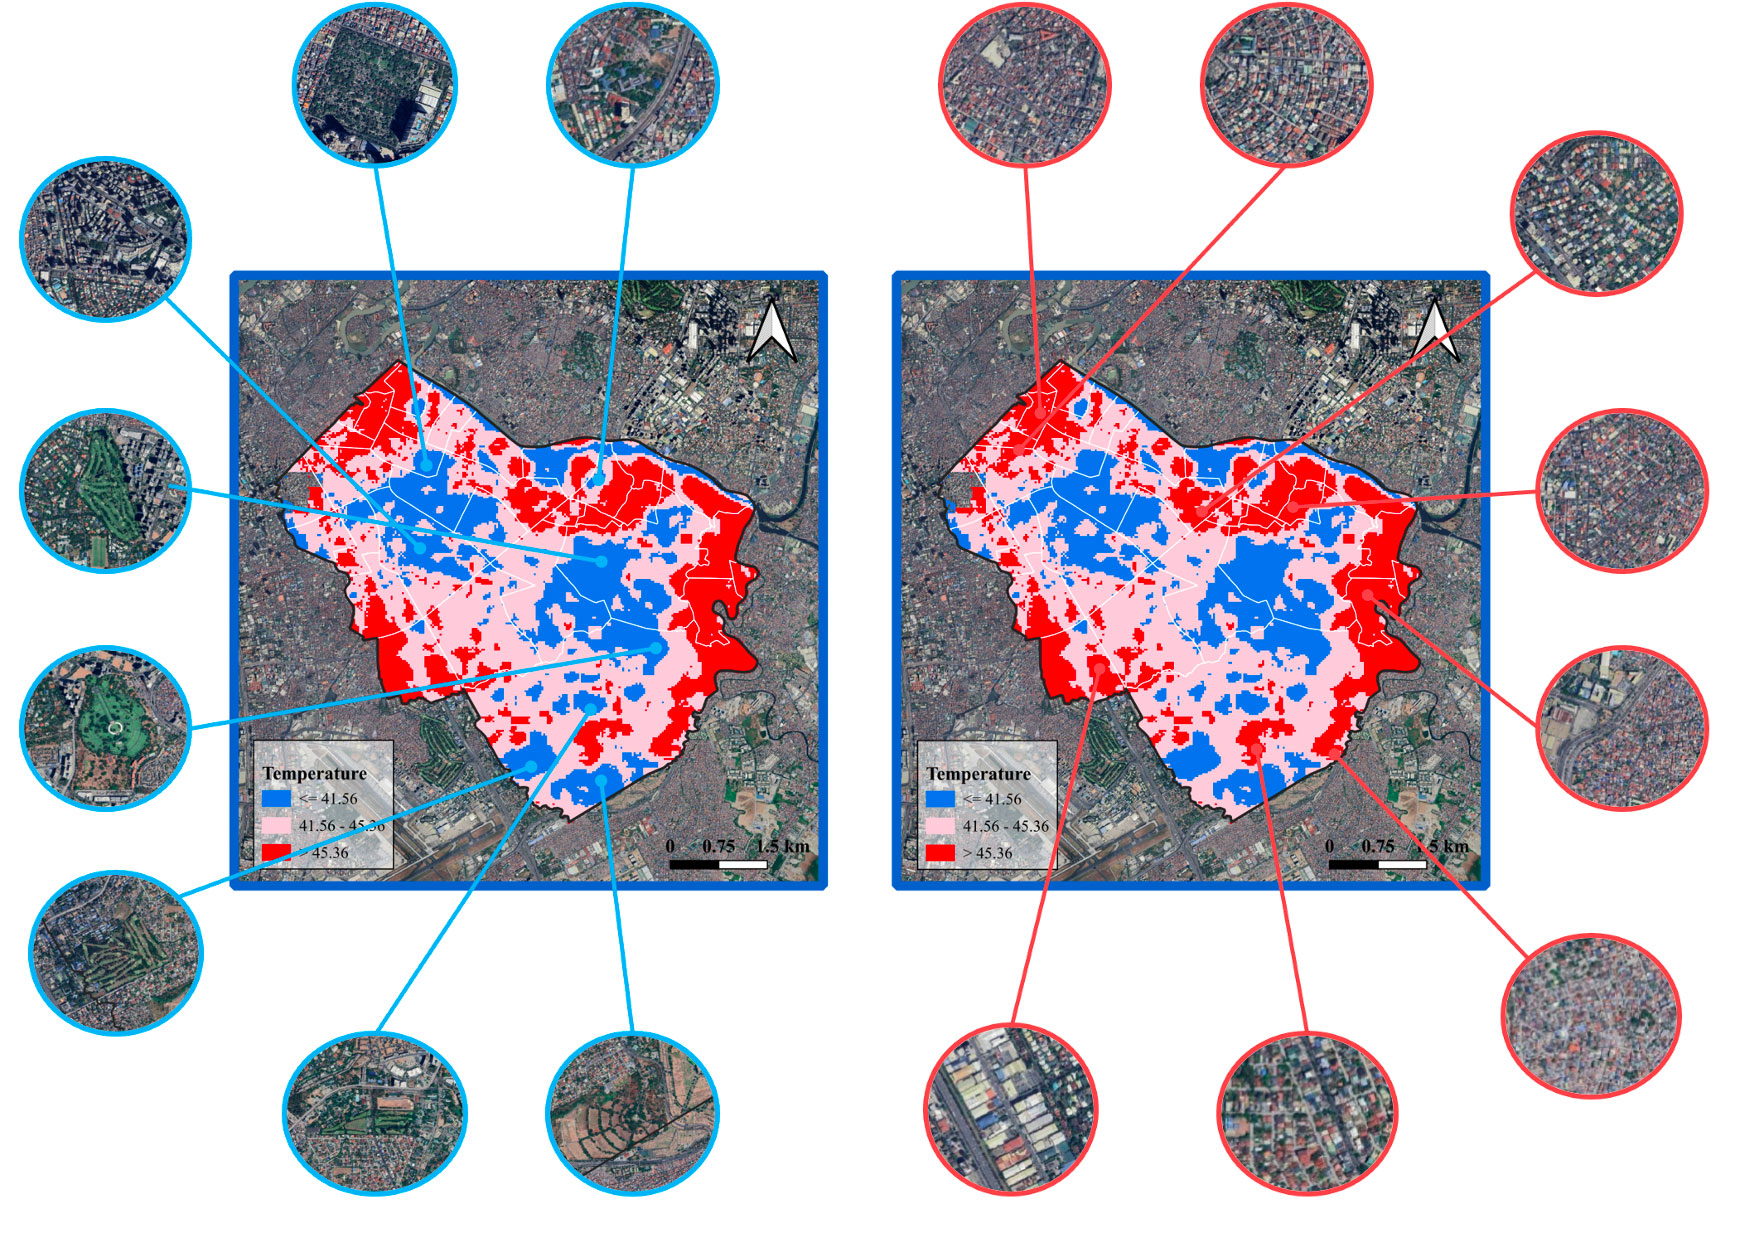
|
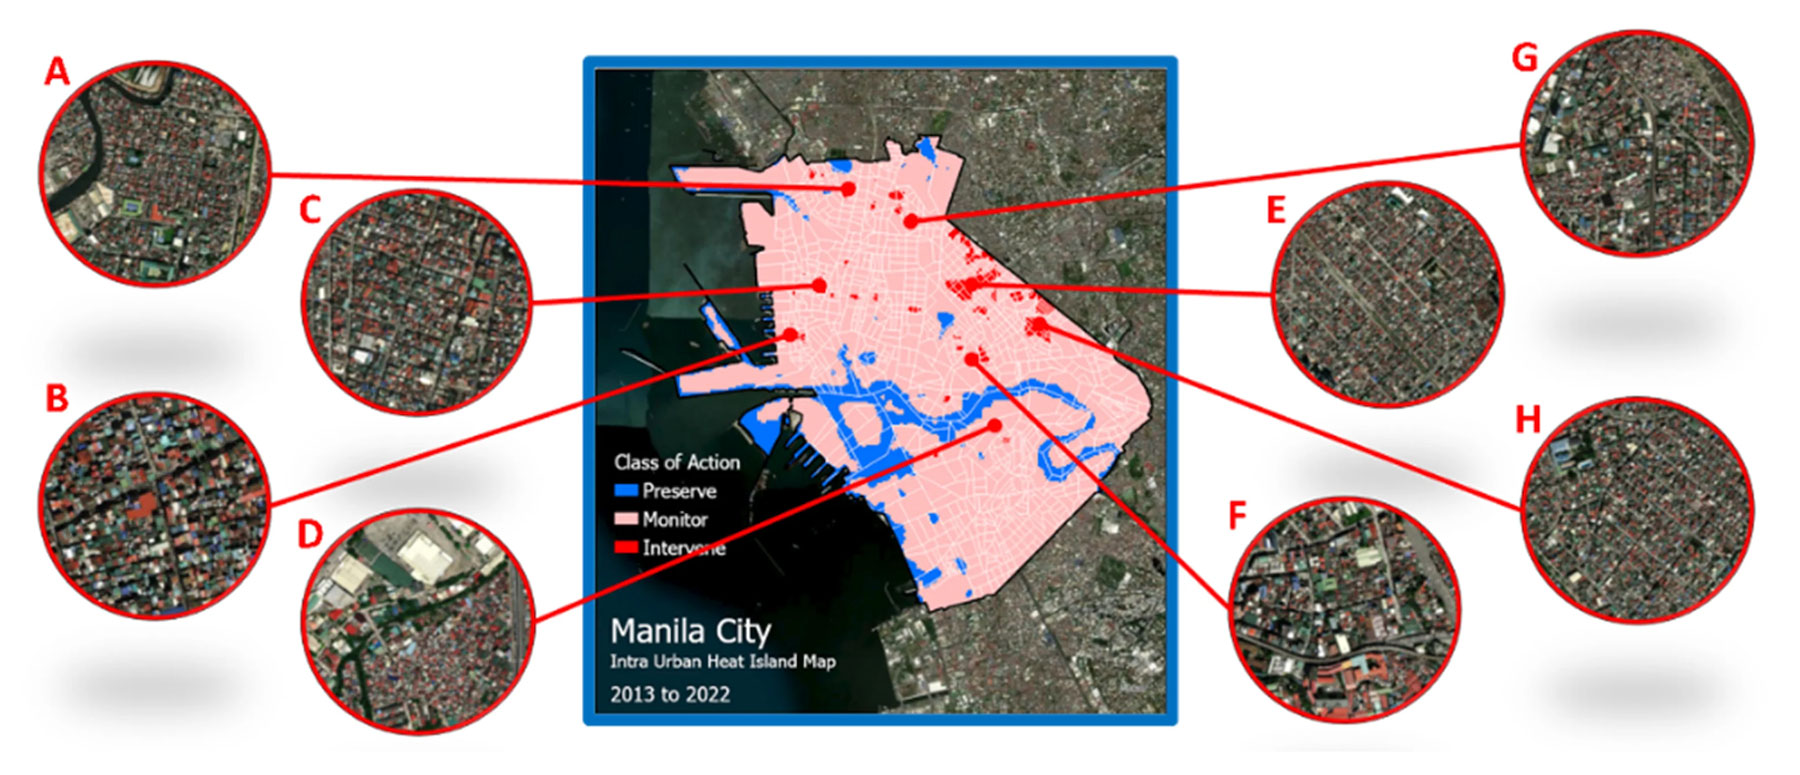
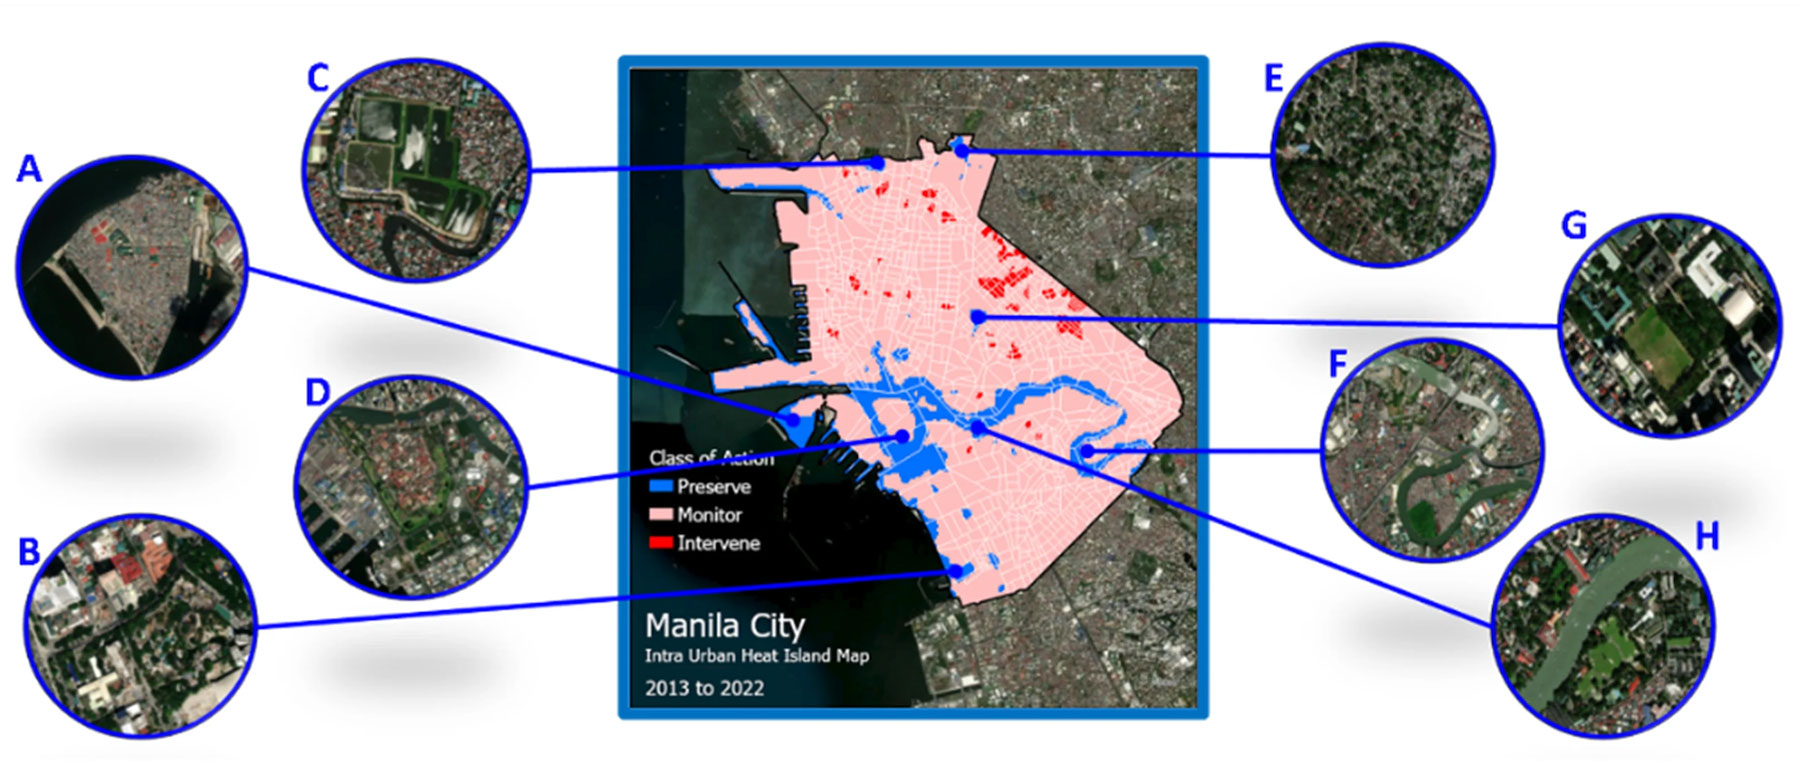
► Manila. Intra-Urban Heat Island map of Manila City derived from satellite remote sensing and spatial analysis (2013–2022), highlighting:
|
|
|
© Mark Angelo C. Purio, Tetsunobu Yoshitake et Mengu Cho (2022) |
Application site(s)
Philippines: the cities of Manila, Makati, and Quezon City
Data
Satellite
Landsat 8–9
MODIS Terra/Aqua
- Sentinel-2 and Sentinel-3 SLSTR
Other
- Socioeconomic and ancillary data from the Philippine Statistics Authority (PSA), NAMRIA, OpenStreetMap, PAGASA meteorological Observations, LGU datasets.
Results – Final product(s)
The HEATMAP-PH Web Portal, an open-access, interactive platform will provide:
maps, dashboards, and analytical tools for heat-vulnerability assessment
downloadable raster and vector layers
temporal heat-trend graphs
an API for integration with local government GIS systems.
The portal will thus enable LGUs and researchers to translate Earth-observation insights into actionable urban-planning and public-health strategies.
Moreover, because the project uses open-source software and freely available data, it can be readily adapted for other tropical cities in Southeast Asia such as Jakarta, Bangkok, and Ho Chi Minh City. The modular processing chain and published documentation will allow external researchers and agencies to replicate or extend the methodology with minimal cost.
References
T. R. Oke, “The energetic basis of the urban heat island,” Quarterly Journal of the Royal Meteorological Society, vol. 108, no. 455, pp. 1–24, 1982, doi: 10.1002/qj.49710845502.
Intergovernmental Panel on Climate Change, Climate Change 2022: Impacts, Adaptation and Vulnerability. Cambridge, U.K.: Cambridge University Press, 2022. https://www.ipcc.ch/report/ar6/wg2/
S. L. Harlan and D. M. Ruddell, “Climate change and health in cities: Impacts of heat and air pollution and potential co-benefits from mitigation and adaptation,” Current Opinion in Environmental Sustainability, vol. 3, no. 3, pp. 126–134, 2011, doi: 10.1016/j.cosust.2011.01.001.
M. A. Purio, T. Yoshitake, and M. Cho, “Assessment of intra-urban heat island in a densely populated city using remote sensing: A case study for Manila City,” Remote Sensing, vol. 14, no. 21, Art. no. 5573, 2022, doi: 10.3390/rs14215573.
C. E. Reid, M. S. O’Neill, C. J. Gronlund, S. J. Brines, D. G. Brown, A. V. Diez-Roux, and J. Schwartz, “Mapping community determinants of heat vulnerability,” Environmental Health Perspectives, vol. 117, no. 11, pp. 1730–1736, 2009, doi: 10.1289/ehp.0900683.
T. Wolf and G. McGregor, “The development of a heat wave vulnerability index for London, United Kingdom,” Weather and Climate Extremes, vol. 1, pp. 59–68, 2013, doi: 10.1016/j.wace.2013.07.004.
Philippine Atmospheric, Geophysical and Astronomical Services Administration, “Climate monitoring and extreme temperature reports,” 2023. https://bagong.pagasa.dost.gov.ph
Philippine Statistics Authority, “Census of population and housing,” 2023. https://psa.gov.ph
Related project(s)
SCO projects addressing urban heat:
- 🇫🇷 Thermocity: algorithms for processing urban thermal spatial data to monitor land use and vegetation, detect thermal anomalies (urban heat islands and thermal gaps), and model the urban climate.
- 🇫🇷 SatLCZ: Algorithms for processing large volumes of satellite data to automatically classify and map a city’s local climate zones (LCZs).
- 🇫🇷 ALTELYS: Real-time detection and monitoring of urban heat islands using satellite imagery. Developed in France and Brazil, and adaptable to other contexts.
- 🇫🇷 Sat4BDNB: Quantification of the urban heat island effect and generation of four urban overheating indicators, integrated into the Franch Building Database (BDNB): indices for mitigation strategy, investment cost, and effectiveness of heat vulnerability mitigation
- 🇫🇷 SCOPE: Simulation of comfort and overheating in public spaces