

SCOFrance
15Participants logged in
PartenairesCLS
SIRS
LEGOS
CNES
BRGM
Duration of experiment12 months
Next Steering Committee meetingMarch 2021
KeywordsRising sea levels, coastal flooding, MNT, MNS, MNE, Gâvres, Palavas-les-Flots
Littoscope, deeply SCO
Three pillars based on spatial mapping
Littoscope uses satellite data for information and decision-making related to the impacts of rising oceans in coastal areas. Its concept is based on three pillars:
- Mapping the hazards using Pleiades satellite data to estimate future flooded areas,
- Assessing flooding risks based on local challenges,
- Establishing an IT tool dedicated to local areas.
Two local areas for experimentation
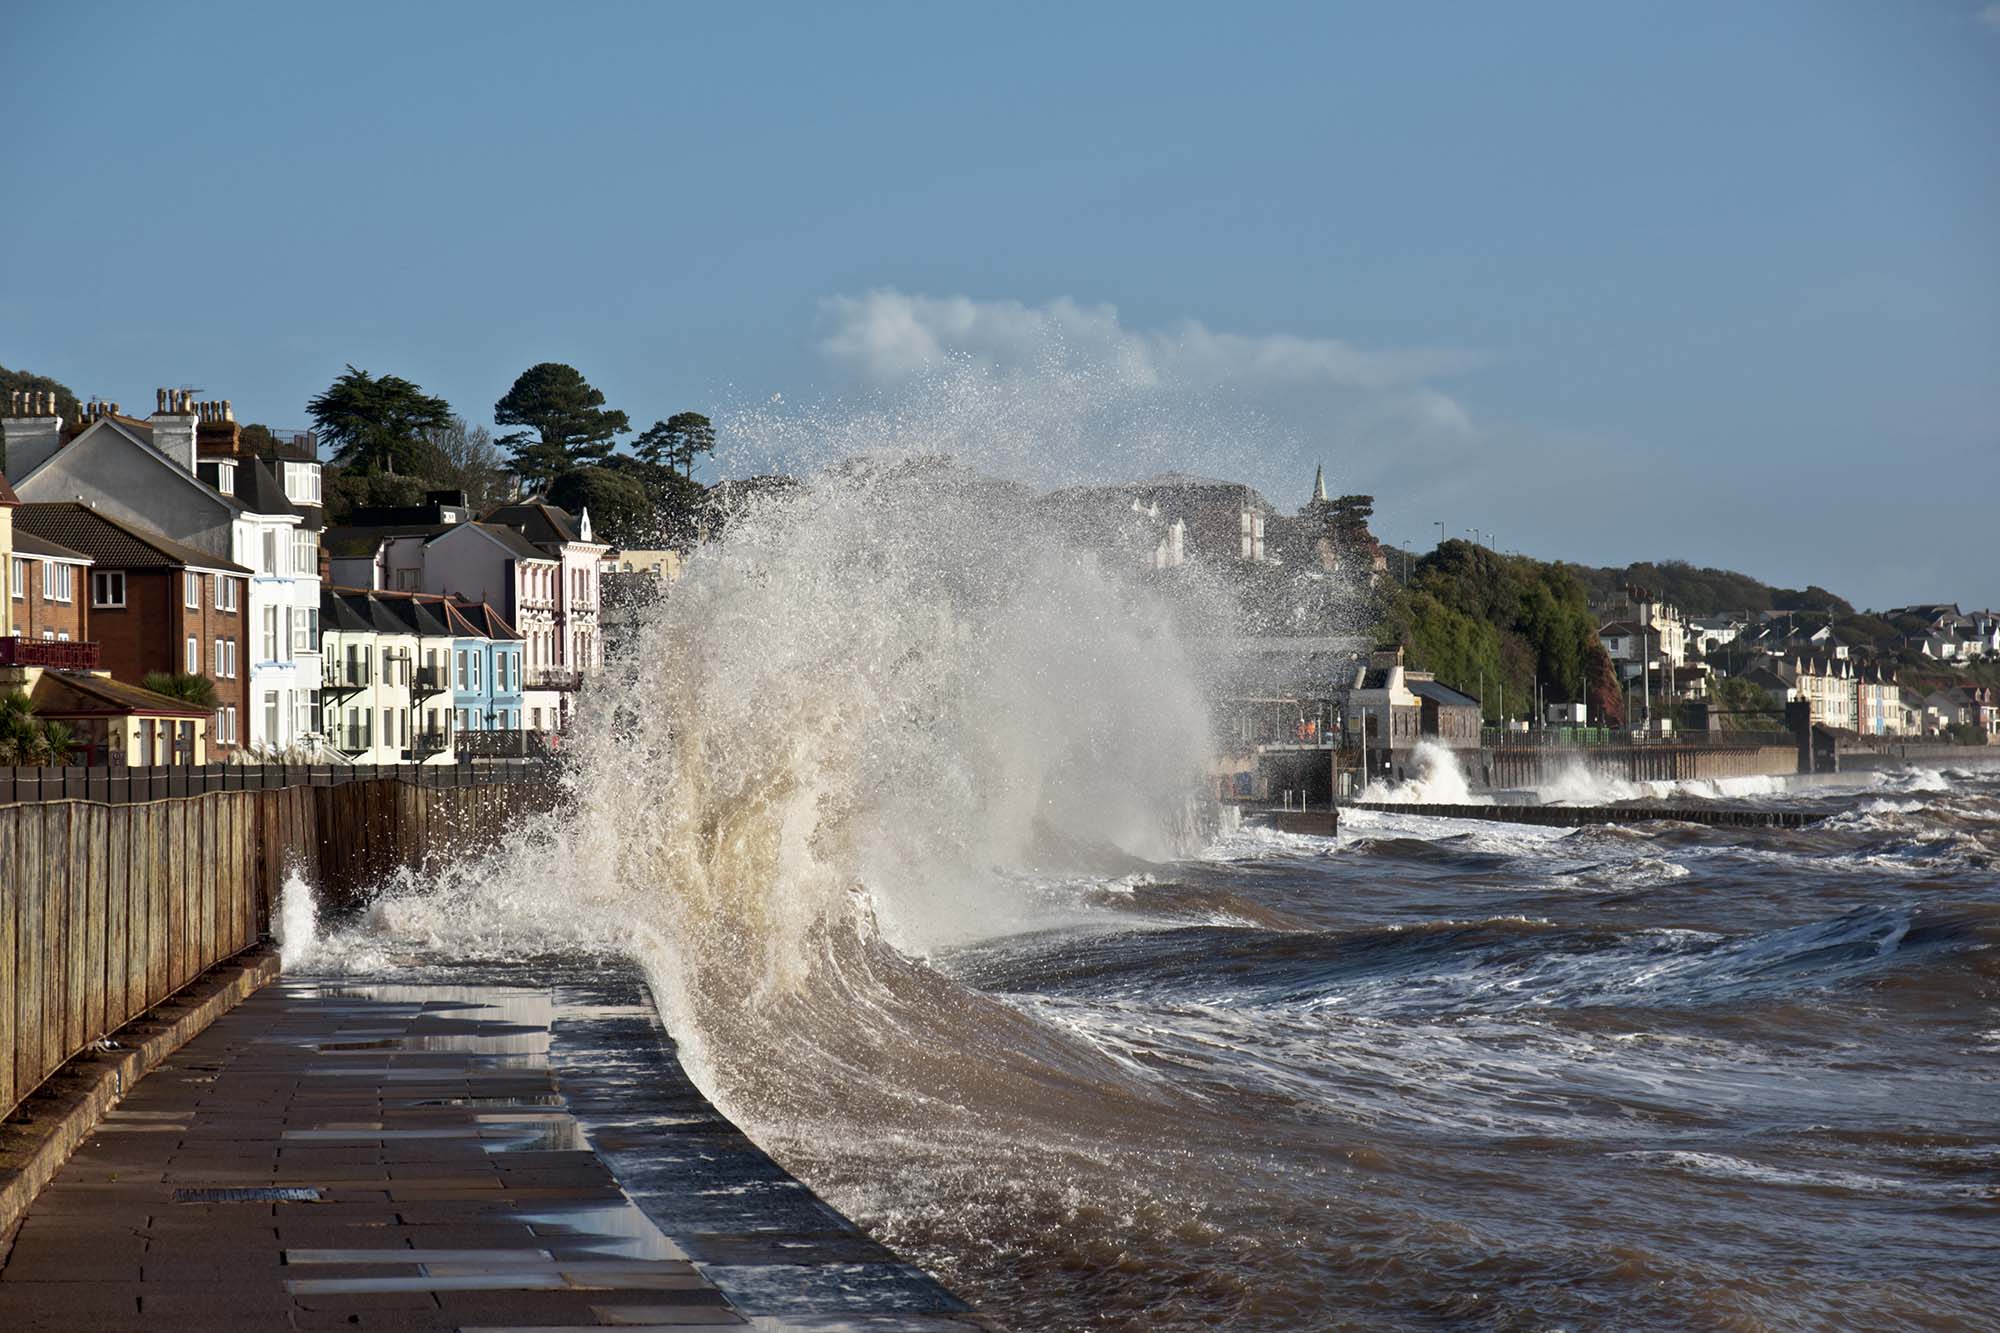
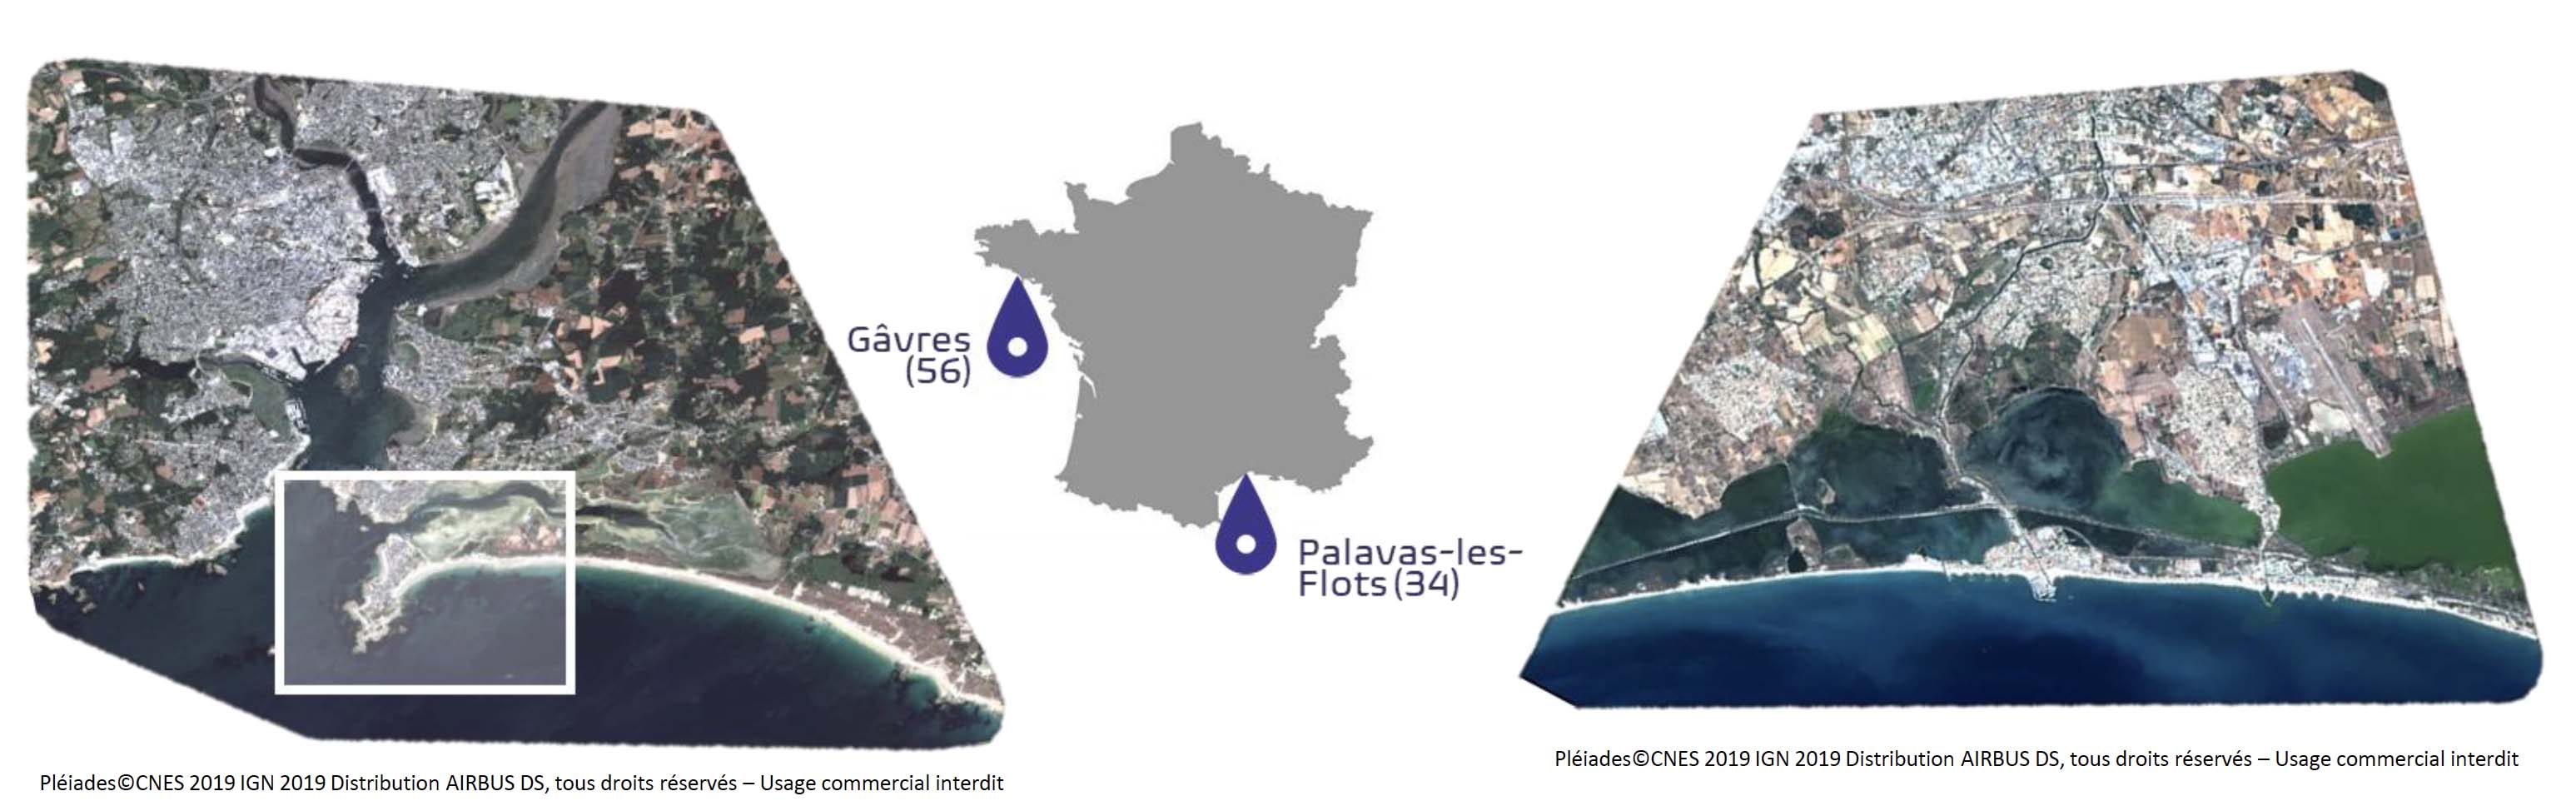
To develop an operational, reproducible tool, the consortium is focusing its work on two coastal areas in mainland France: the village of Gâvres (4.5 km2) on the Atlantic coast and, in the Mediterranean region, a broader area (102.4 km2) around Palavas-les-Flots, including a part of the Montpellier-Méditerranée conurbation and the municipalities of the Etang de l’Or.
Consultation of local stakeholders
Firstly, the consortium approached local stakeholders in October: two in Gâvres and four in the Palavas-les-Flots region. These future users of the tool were able to express their needs and expectations and also share their experiences on coastal flooding. They all showed significant interest in the project, which, for most of them, will be their first experience using satellite data. Some also expressed satisfaction regarding the link the project is creating between local government institutions, technicians and decision-makers.
Satellite data processing
The products generated are delivered in the form of maps, using various algorithms applied to Pleiades satellite images. By mid-December, the team had tested various mask and adjustment methods to provide the best possible results with a process applicable everywhere.
Geographical modelling of areas
- Input data: Pleiades triple stereoscopy, i.e. three images (before, nadir, after) used to produce a 3D image of the region.
- Pre-processing of images using Orfeo Toolbox (CNES open-source software package) and production of the DSM (digital surface model) using CARS (CNES open-source software).
- Part of the ground surface is then removed (vegetation, etc.), retaining obstacles to the flow of water (buildings and walls). At this point, the team faced the stumbling block of plant-covered structures, identified as vegetation by the satellites' optical sensors.
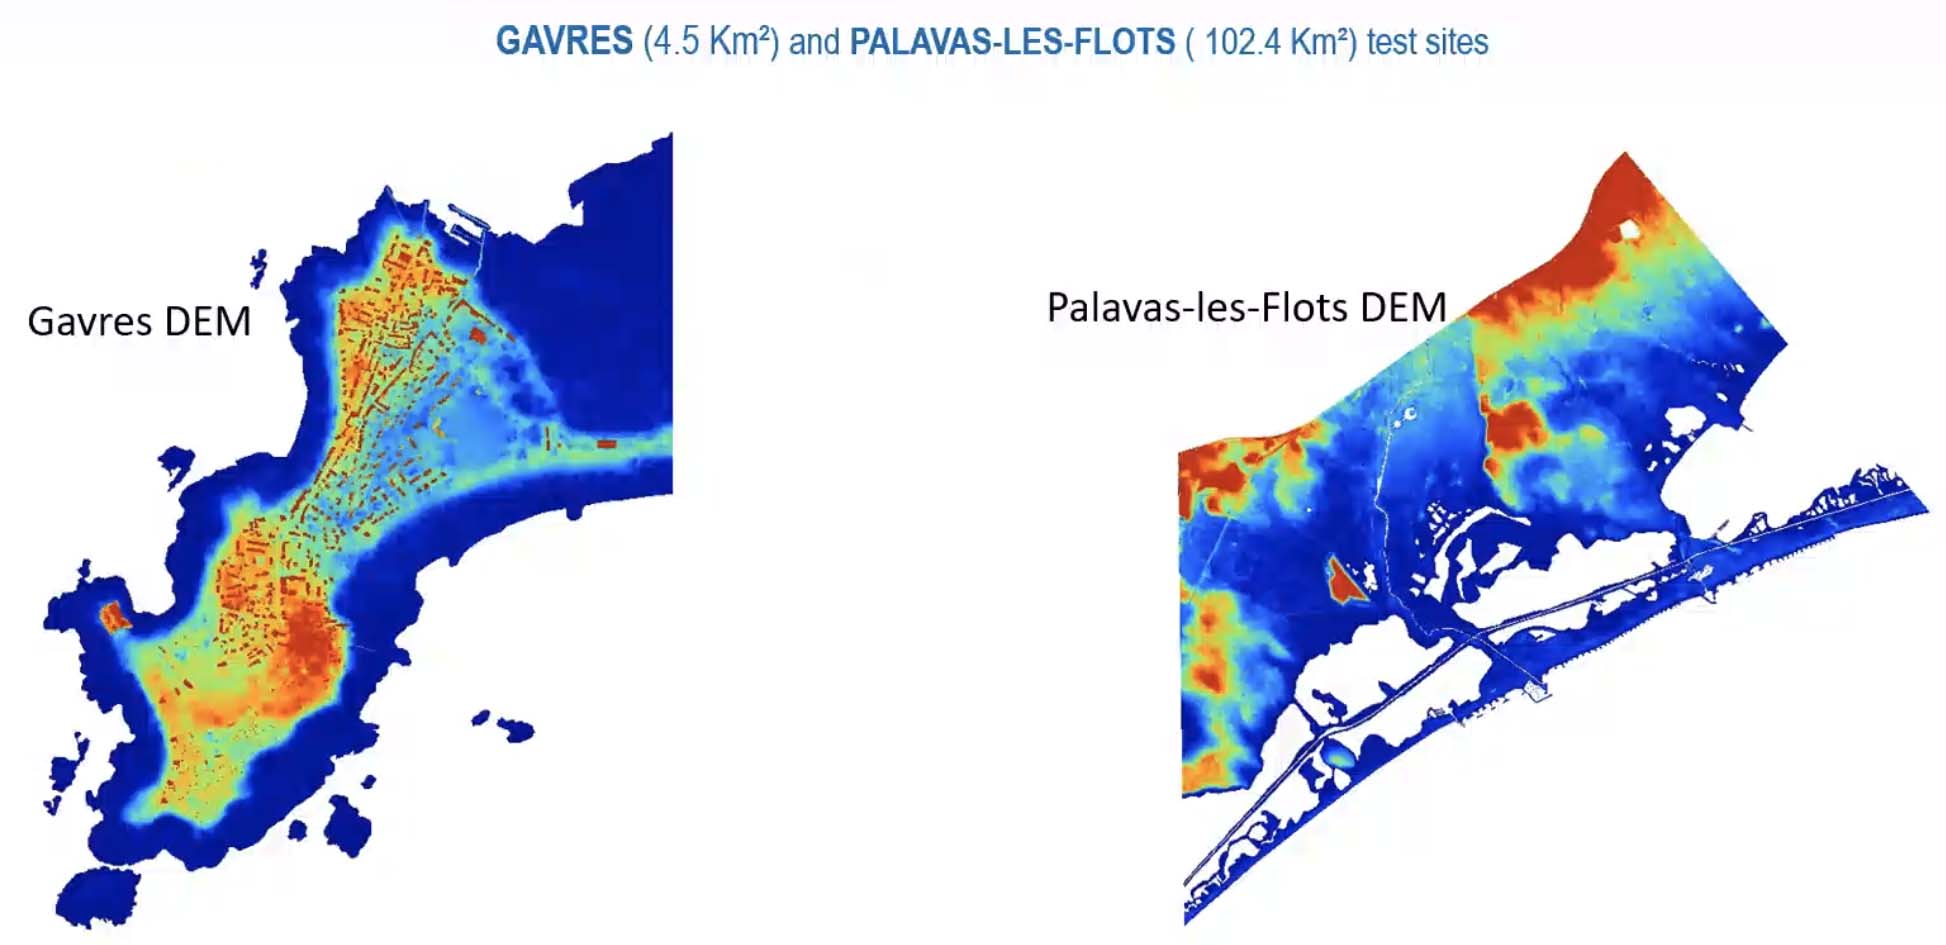
- => Production of DTM (digital terrain model) then DEM (digital elevation model) with spatial resolution of 0.5 m. These were then "adjusted" with respect to a local reference system (measurement points provided by BRGM for Gâvres and collected at the IGN site for Palavas-les-Flots).
© Littoscope
Characterisation of socioeconomic challenges
For large areas such as the Palavas-les-Flots area, the tool has three processing levels. Adapted to large areas, the low level (use of ground) and intermediate level (addition of information about the population, habitats and economy) are automatically and reproducibly classified. On a regional scale, the high level offers comprehensive analysis of the image.
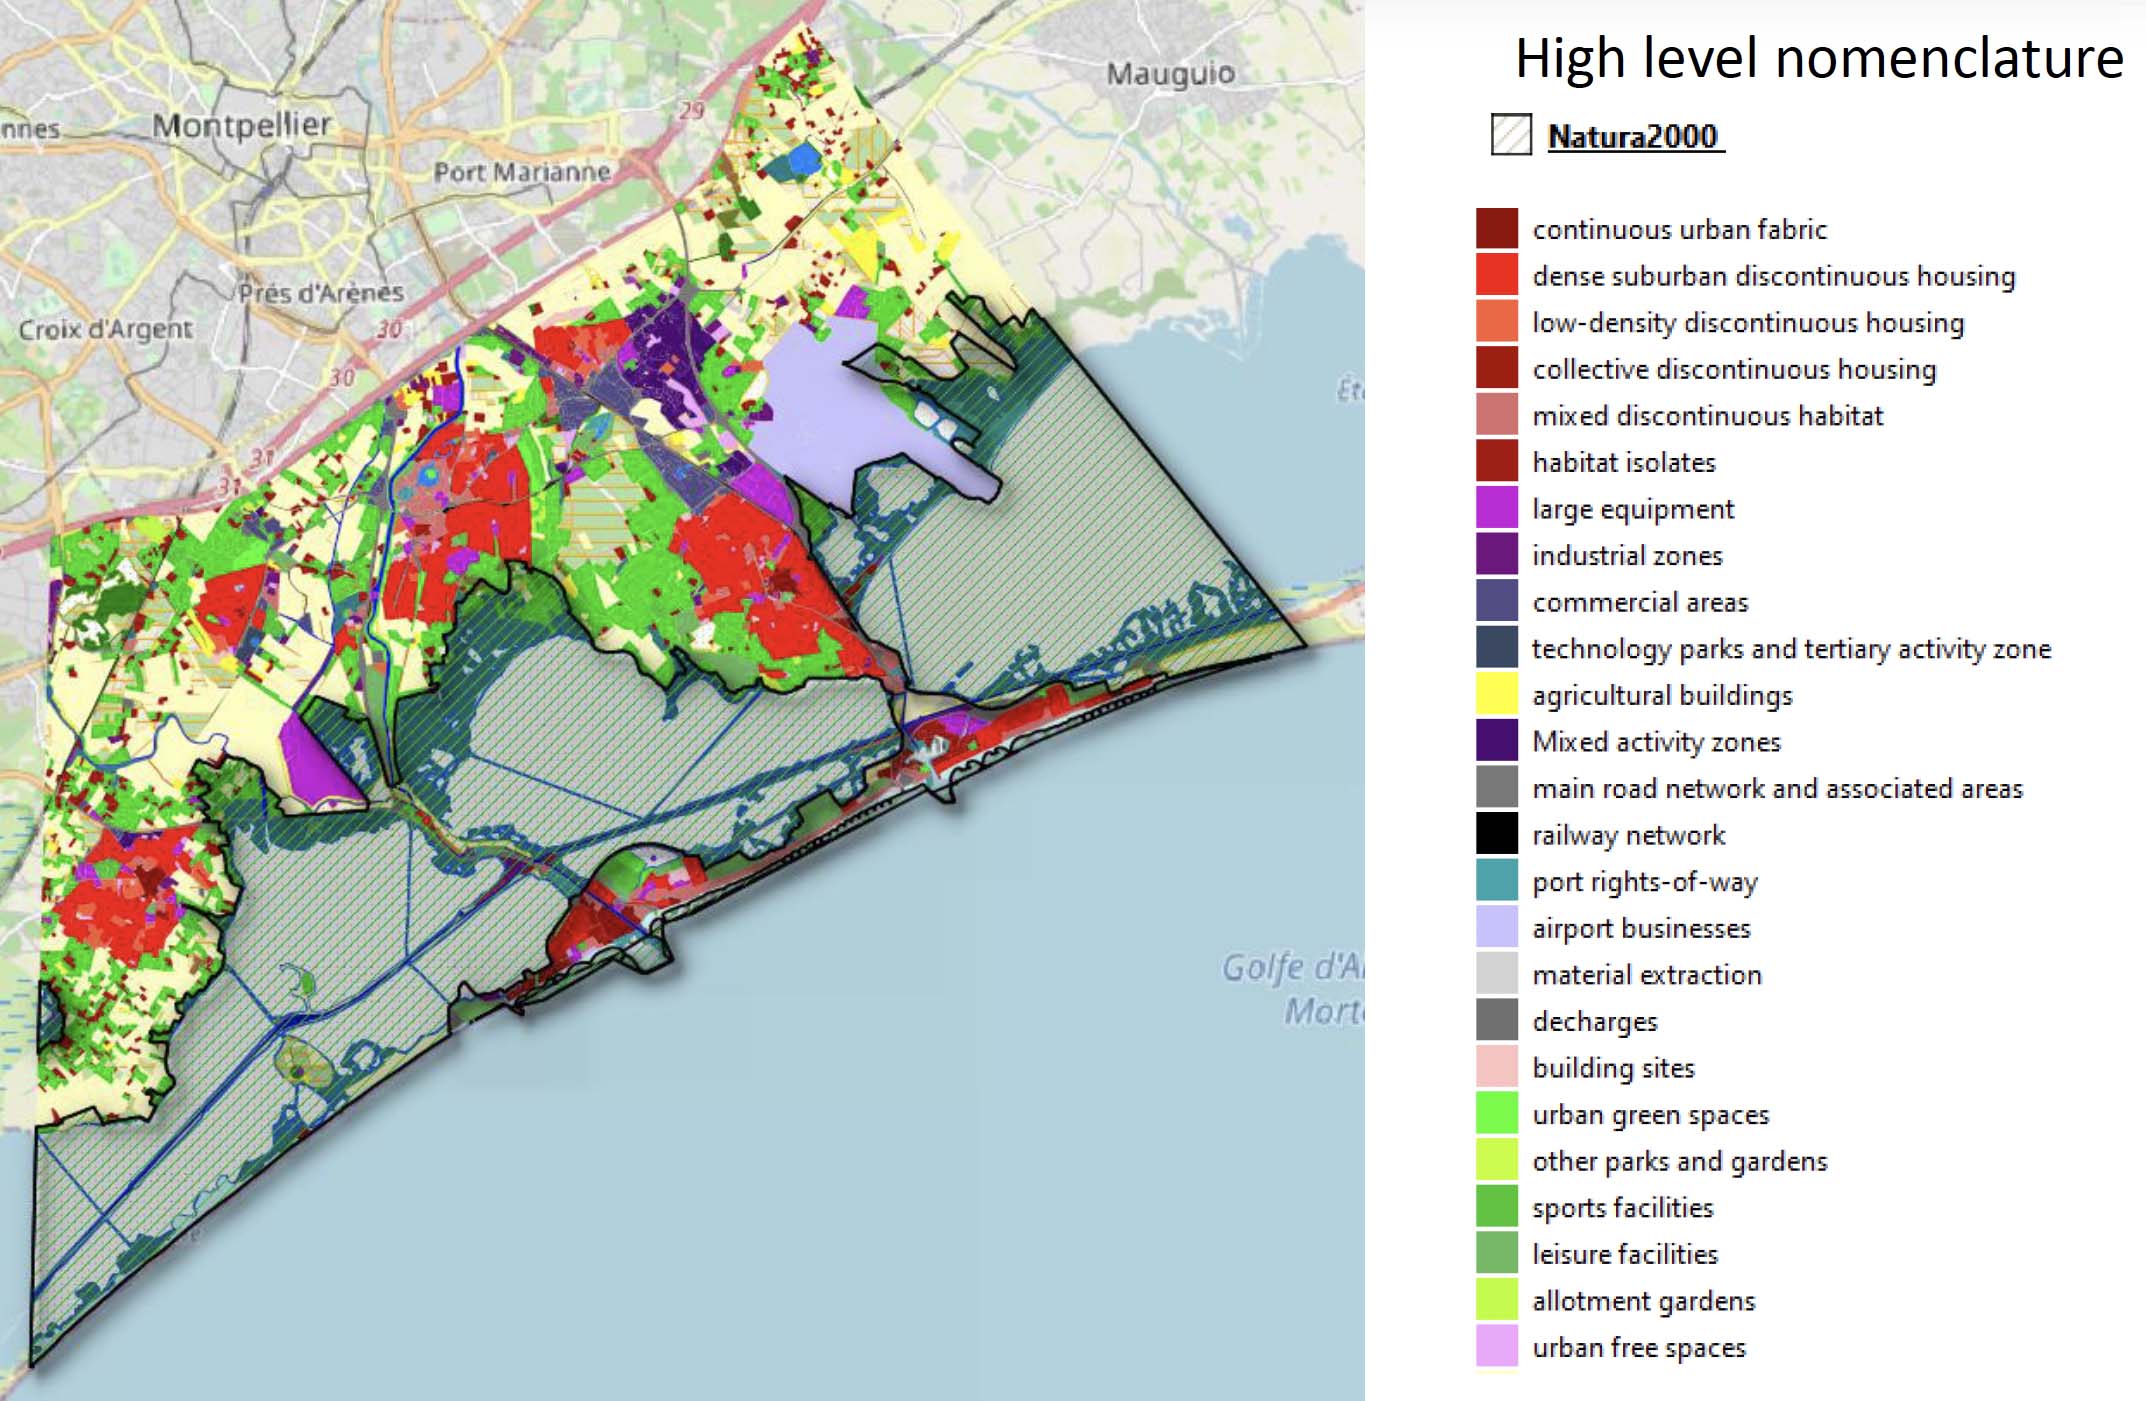
The highest level of processing combines a customised map of ground occupancy at a detailed level as regards socioeconomic components and exogenous themed data (environment, industrial risks, tourism and the population). ©Littoscope
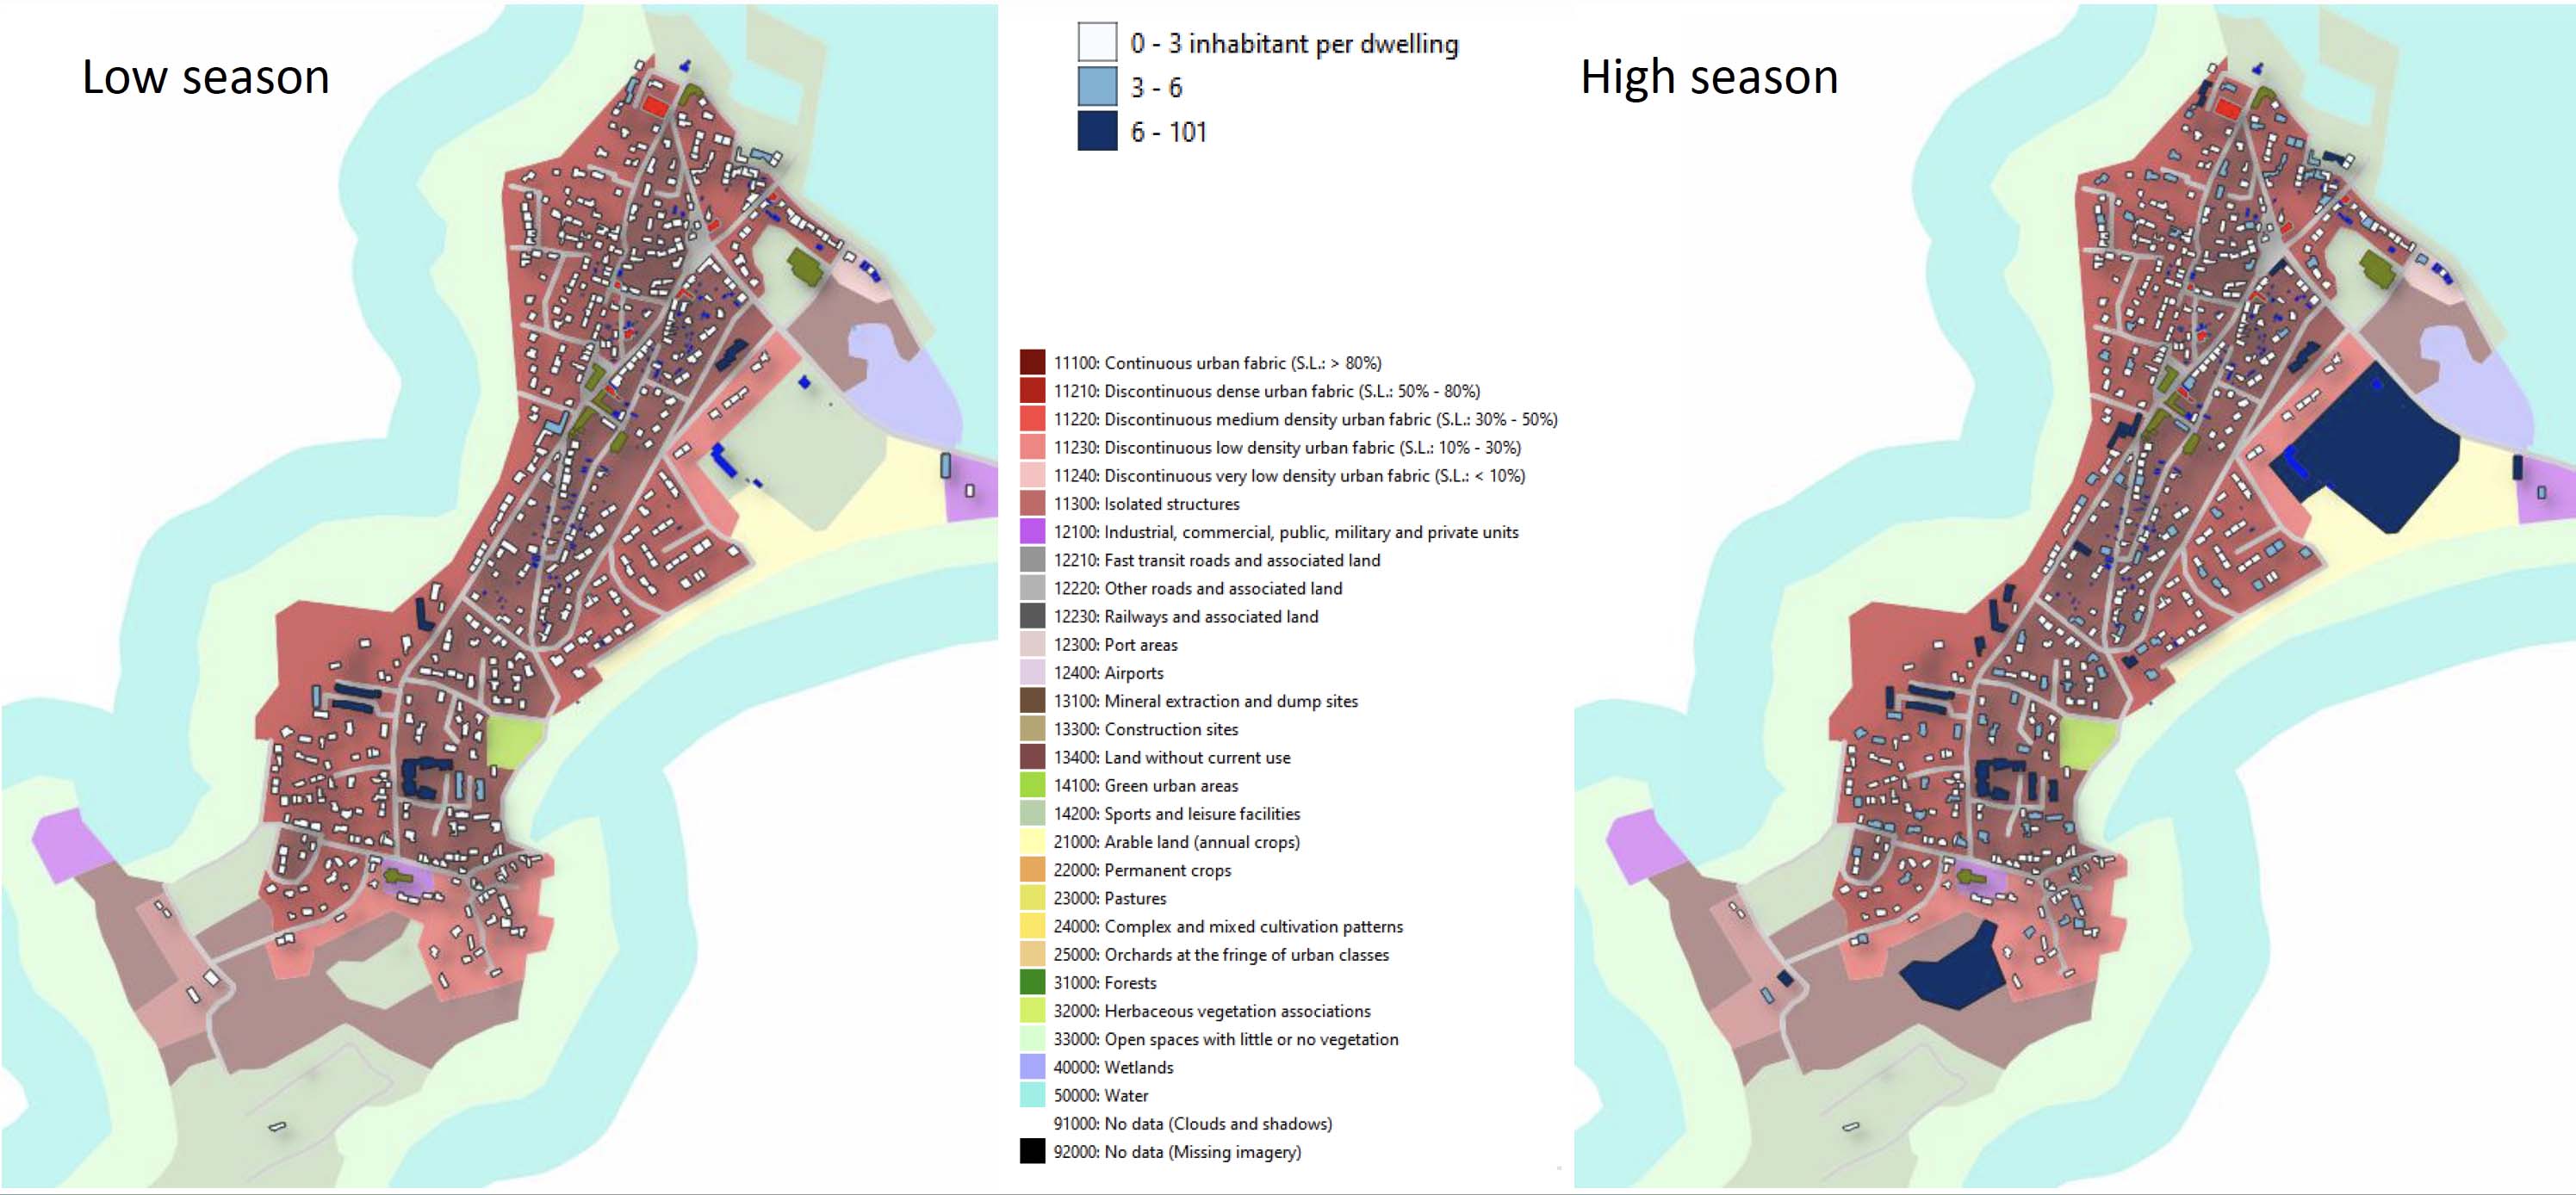
For a small village such as Gâvres, the tool offers a detailed view per season, providing the population at the spatial resolution of buildings. © Littoscope
Estimation of the flooding risk
By crossing the estimation of land elevation with the intensity of the abnormally high tides resulting from rising sea levels (observed or predicted), as well as by the tide and storms, the team compiled 15 scenarios of flooding risks for each zone to outline forecasts for 2030, 2070 and 2100.
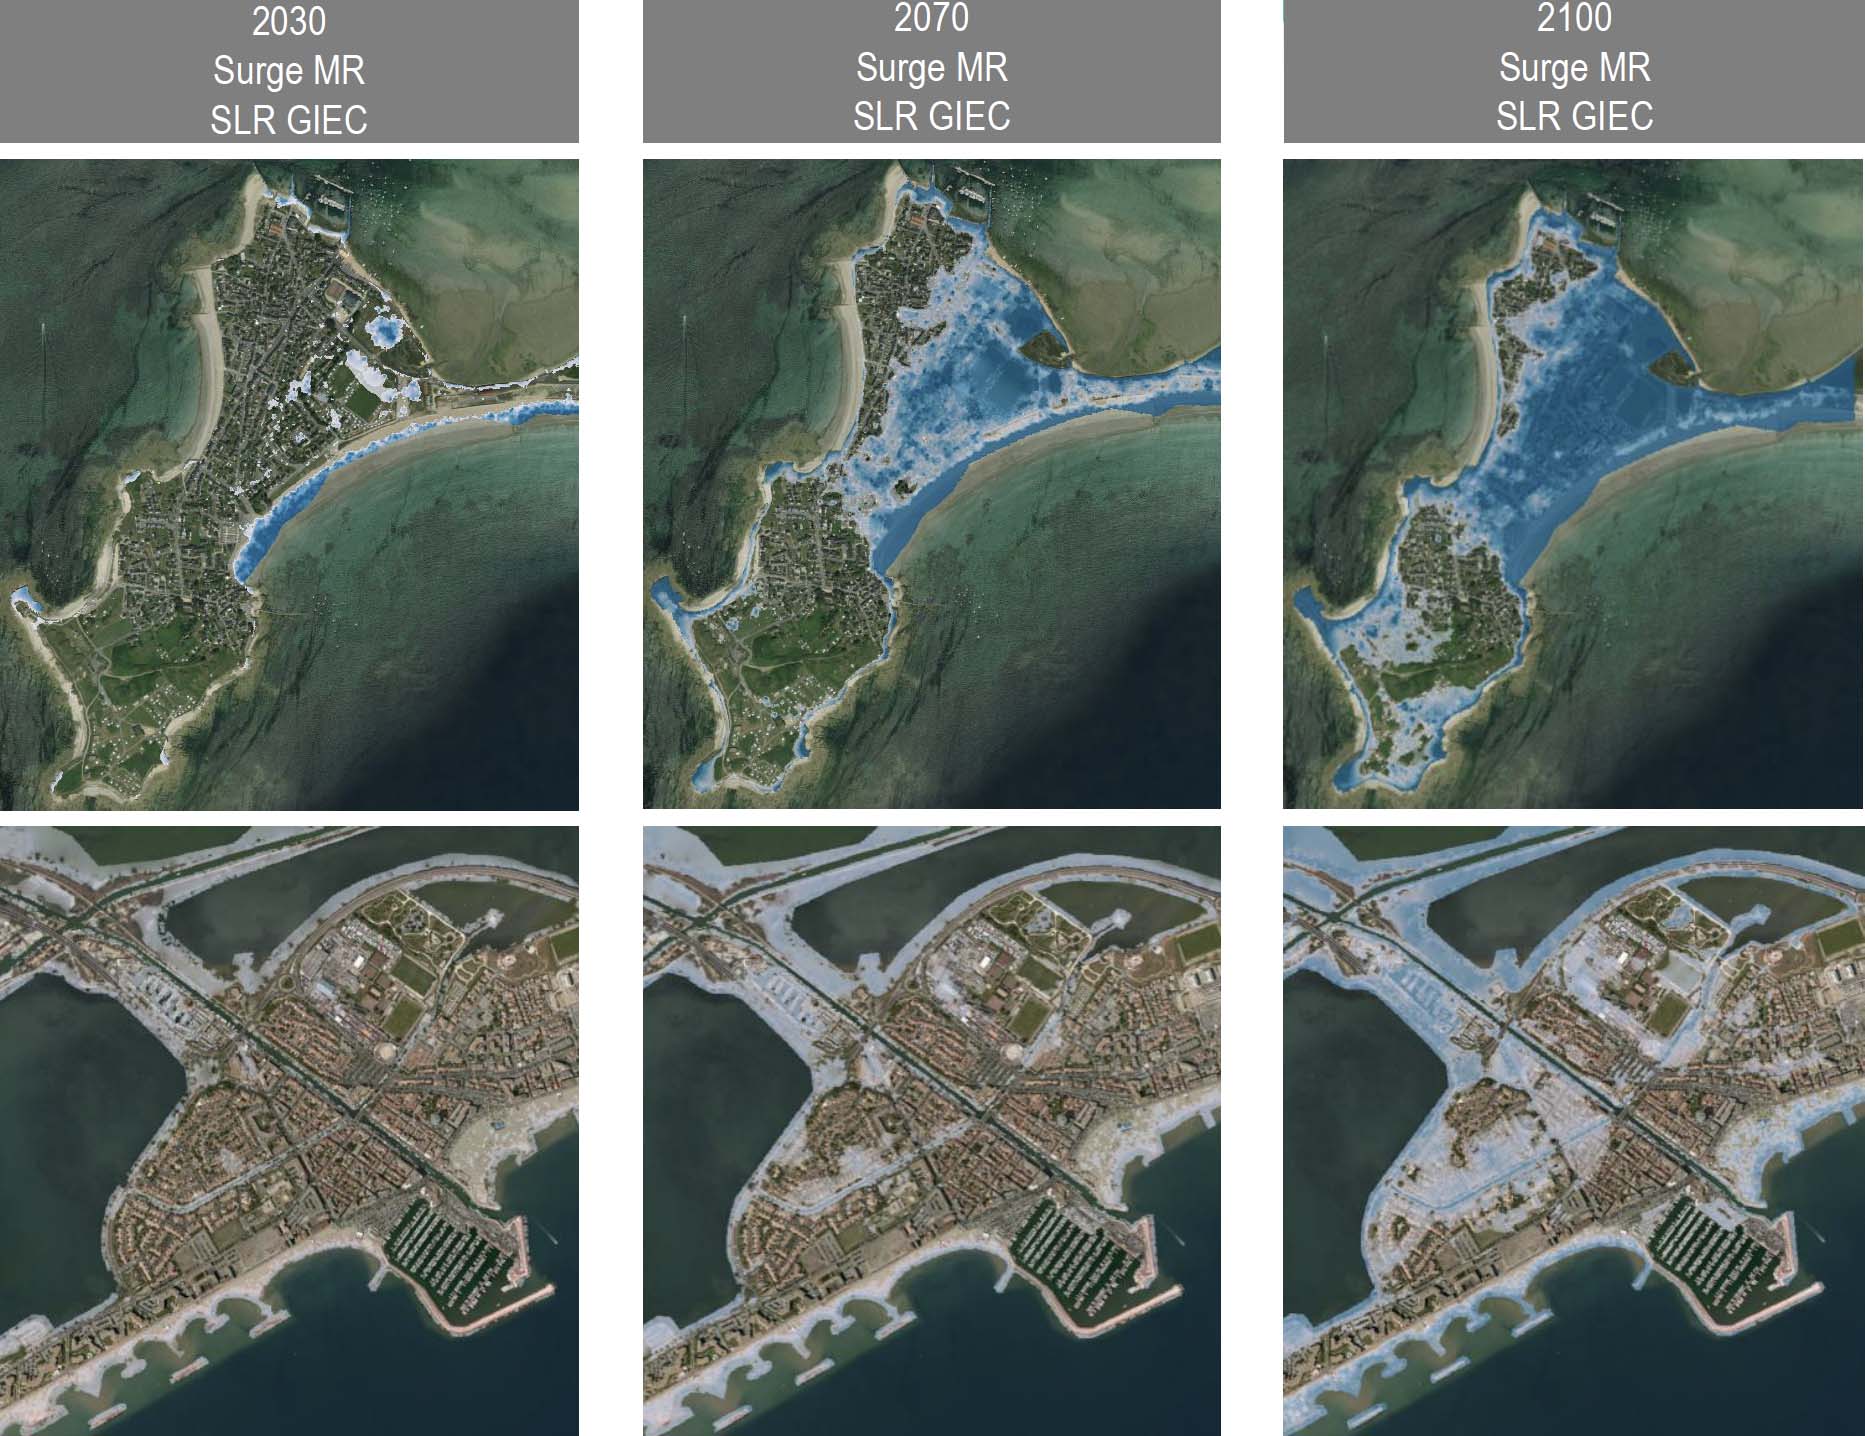
Forecast of long-term flooding risks. ©Littoscope
The next stages will involve compiling challenges, distributed into three classes (human, socioeconomic, and environmental and property-related) and calculating the risk index (degrees from 1 to 5, population affected, costs/damaged property). These elements, combined with the flooding risk scenarios, will produce a risk map.
Development of an interactive online platform
Planned for delivery in late March 2021, an initial version of the online platform was presented to the participating local stakeholders in mid-December. A questionnaire and/or interviews will be used to gather feedback on use in June 2021.
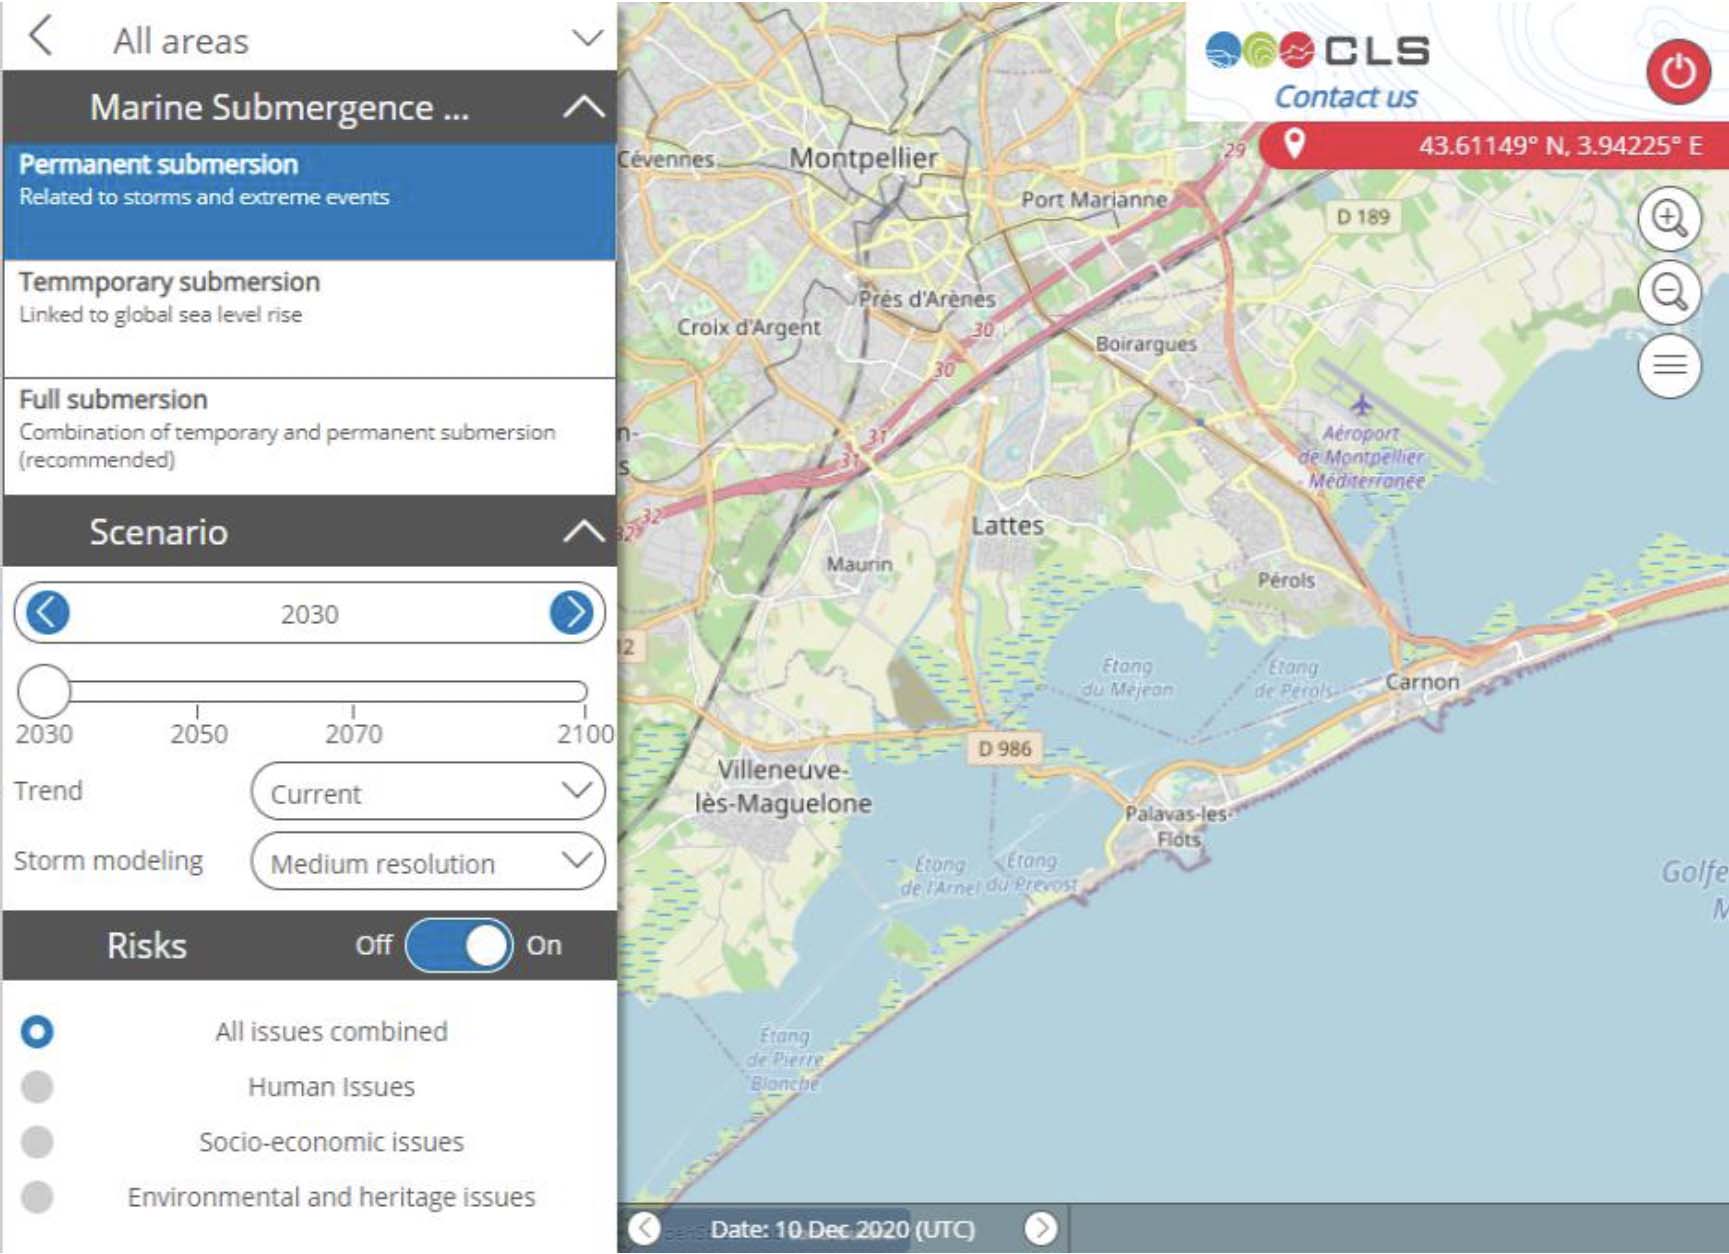
The online platform will be used to view permanent and temporary flooding hazards in a region and estimate the risks associated with these hazards. ©Littoscope
What is next?
When the tool is fully operational, it will be provided to SCO International to be promoted so it can be applied to other coastal areas in France and worldwide.