

LITTOSCOPE

Estimating coastal flooding
Project completedThought since 2019, LITTOSCOPE is born from the desire to reduce the vulnerability of coastal cities due to mean sea level rise, and especially against coastal flooding. The team is now proud to present a functional solution, able to estimate the flooding risks on any coast: at France’s scale and more.
 |
 |
Mapping of flooded areas around Gâvres in 2030, 2050, 270, and 2100, based on GIEC RCP 8.5 predictions ; with (left) and without (right) the modeling of a decadal storm. © CLS
OVERVIEW
Coastal flooding is defined as a dry land being submerged by seawater. A coastal flooding can be caused by different phenomena (swell, waves, ocean rise) that result in a temporary or permanent submersion. Since 2021, LITTOSCOPE assesses the effects of climate change on coastal activities and inhabitations by combining observation of sea level rise and extreme events, together with the geomorphology and local stakes of the studied region.
Estimating the flooding hazard
Precise identification of the coastal areas facing permanent flooding because of the rising sea level, and quantification of the amount of water introduced on lands is done through finely tuned Digital Terrain Modelling (DTM) on the mean sea surface (MSS). MSS is based on altimetry and gravimetric data, and DTM is estimated from Pleiades high-resolution satellite data.
The solution also uses a global storm surges and tides models developed in the framework of the altimetry ground segment. to identify the coastal areas subject to temporary flooding caused by extreme events.
Coastal changes are estimated for 2030, 2050, 2070, and 2100 following different trends for the sea level rise:
- The trend observed by altimetric satellites since 1992 (Copernicus Climate, Copernicus Marine Services)
- The most optimistic trend from GIEC reports (RCP 2.6), in relation with Paris agreements (2015)
- The most dramatic trend from GIEC reports (RCP 8.5), based on the possibility that no ecological measure will be taken.
By comparing the altitude of lands with the intensity of the surge induced by the rise of sea levels, at different timescales, LITTOSCOPE allows its users to discover 24 different case scenarios of coastal flooding.
Risks characterization
Using socio-economic data to characterize the target area, the project developed a synthetic, intuitive, and easy to represent risk indicator combining the intensity of the flooding hazard with local stakes. Based on the CVI method (Gornitz et al.,1992), this indicator provides a quantified assessment of the risk level related to four different categories: human, economic, environmental, and cultural heritage.
A method inspired by the DIVA tool (Hinkel, 2005; Hinkel and Klein 2010) was also developed to estimate the costs and damages associated with the flooding hazard.
Application site(s)
- Municipalities around the Palavas-Les-Flots’ pond, France
- Gâvres, France
DATA
Satellite
- Pléiades tri-stereo data
- Altimetry data from Copernicus Marine (CMEMS) and Copernicus Climate (C3S) services mapping the trends of sea level rise.
- Mean Ocean Surface CNES-CLS 2015
Other
- Socio-economic data (from INSEE, land occupation, …)
- Tidal modeling FES2014
- Surge modeling MOG2D-TUGO
RESULTS - FINAL PRODUCTS
All the produced data and maps are available on an interactive web interface, which allows the decision makers of the coastal territory to familiarize themselves with the possible risks faced by their region, sensibilizing them and easing the decision-making process.
The interactive and intuitive platform allows its users to easily visualize the different case scenarios and offers a simple understanding of the local challenges.
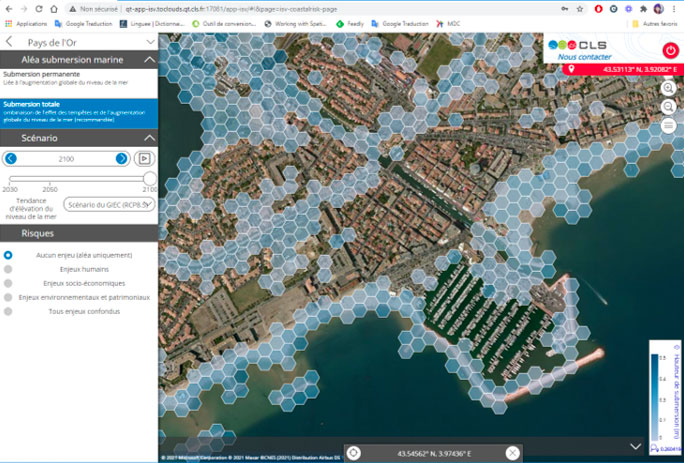
LITTOSCOPE online platform, Mediterranean coastline ©CLS
Summary of the studied parameters:
- Four timescales: 2030, 2050, 2070, 2100.
- Three trends for ocean rise: altimetry observations, GIEC RCP 2.6, GIEC RCP 8.5.
- Decadal storm modeling.
- Four risk indicators: human, economic, environmental, heritage.
💡 Useful Link: France Ville Durable, Webinar "Solutions for the energy resilience of territories" (in French)
Market place
 |
Littoscope on GEO Knowledge Hub, a long lasting digital repository created by the Group on Earth Observations: https://gkhub.earthobservations.org/marketplace/items/x5qdz-0tk70 |
👉 Littoscope on the CLS Data Store
RELATED PROJECT(S)
- CORISCLIM, Littoscope's move to a global scale
- SCOast-DT, Coastal Zone Digital Twin
- OSS St Louis
PROJECT NEWS
- 26/09/2024: Littoscope goes to scale with Corisclim: become a test user
- 13/07/2022 : Presentation of the Littoscope project and its progress at the 5th Quarterly Meeting of the SCO France on the theme Pleiades data in SCO projects
- 13/09/2021: Littoscope: final delivery!
- 07/01/2021: Littoscope, deeply SCO