

SCOFrance
29Connected participants
OrganizerCLS
Duration of the project12 mois
Acronyms of the articleDTM: Digital Terrain Model
DSM: Digital Surface Model
DEM: digital elevation model
Key wordsSea surges, sea level rise, climate projections
Littoscope : final delivery!
In January 2021, we presented you the Littoscope method, a deeply SCO project, just after the first follow-up meeting of the project. Since then, the team has delivered its interactive web platform to the two experimentation territories, namely Gâvres (Atlantic coast) and the area around Palavas-les-Flots (Mediterranean), and then collected feedback from these users in order to identify future improvements. On Monday, September 13th, all the actors met for a last debriefing around the final version with the following functions:
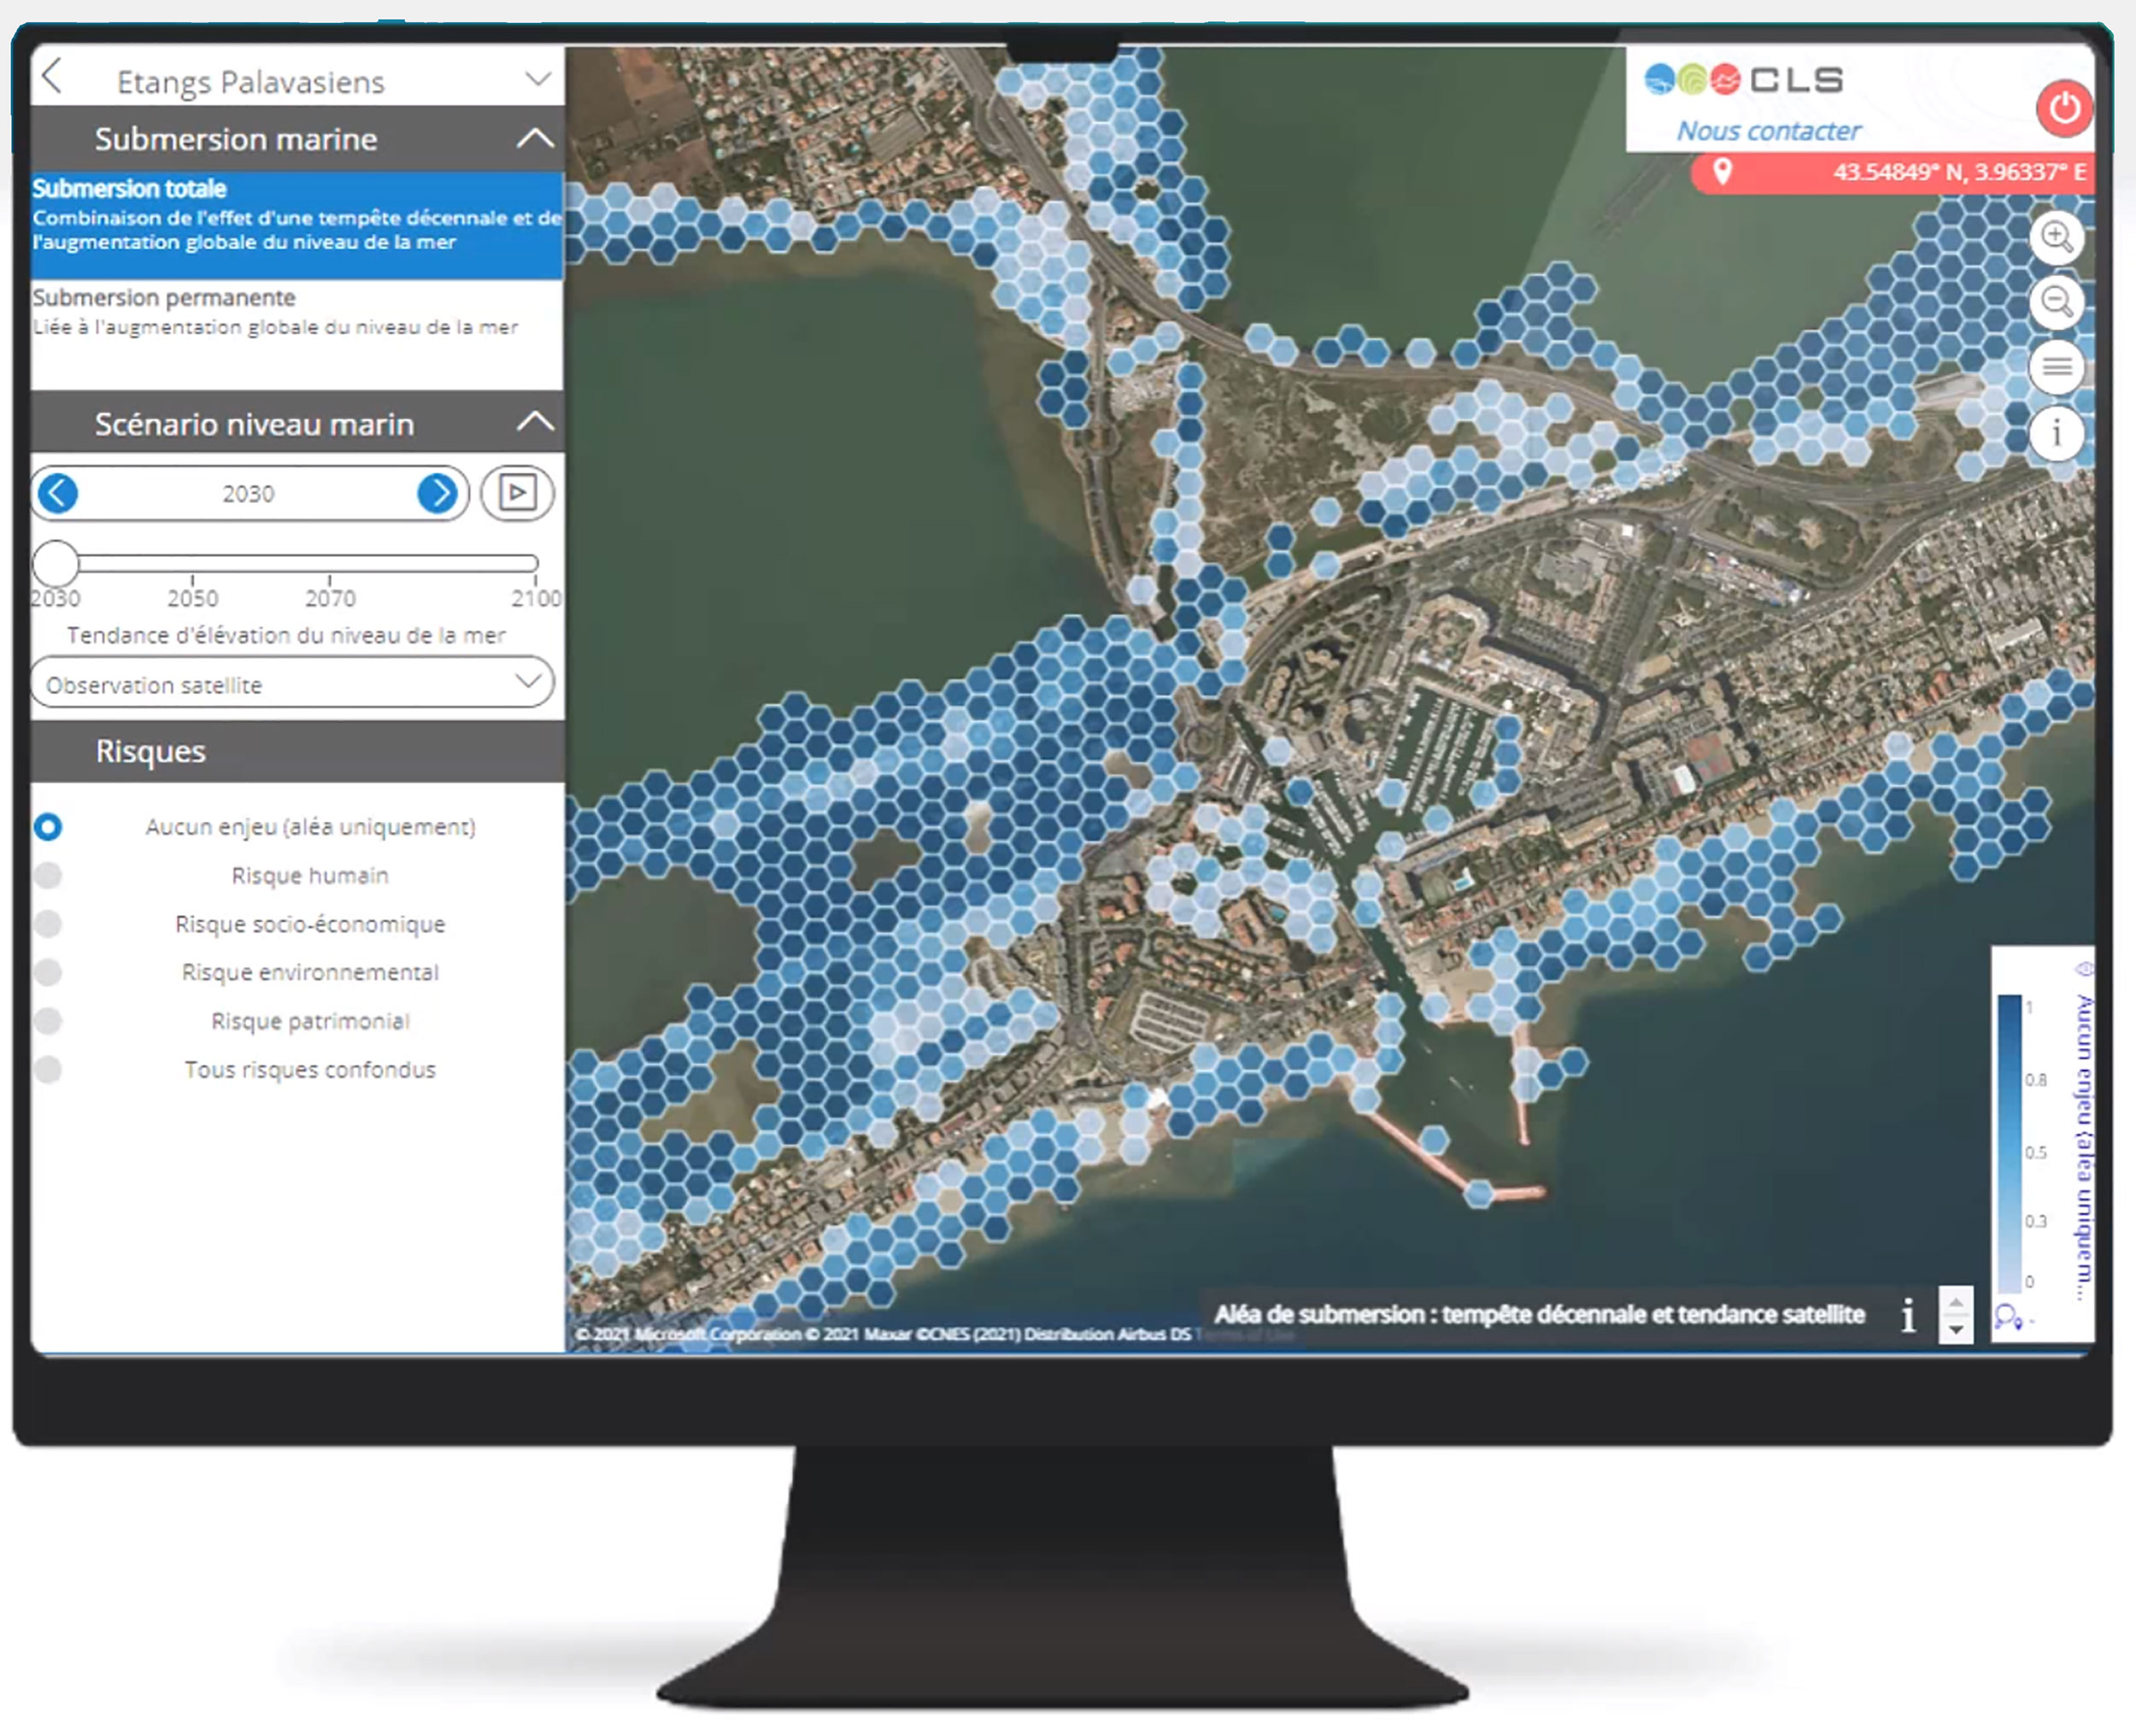
- Visualization of the marine submersion hazard (water height in meters)
- Visualization of risk indicators
- 24 customizable scenarios
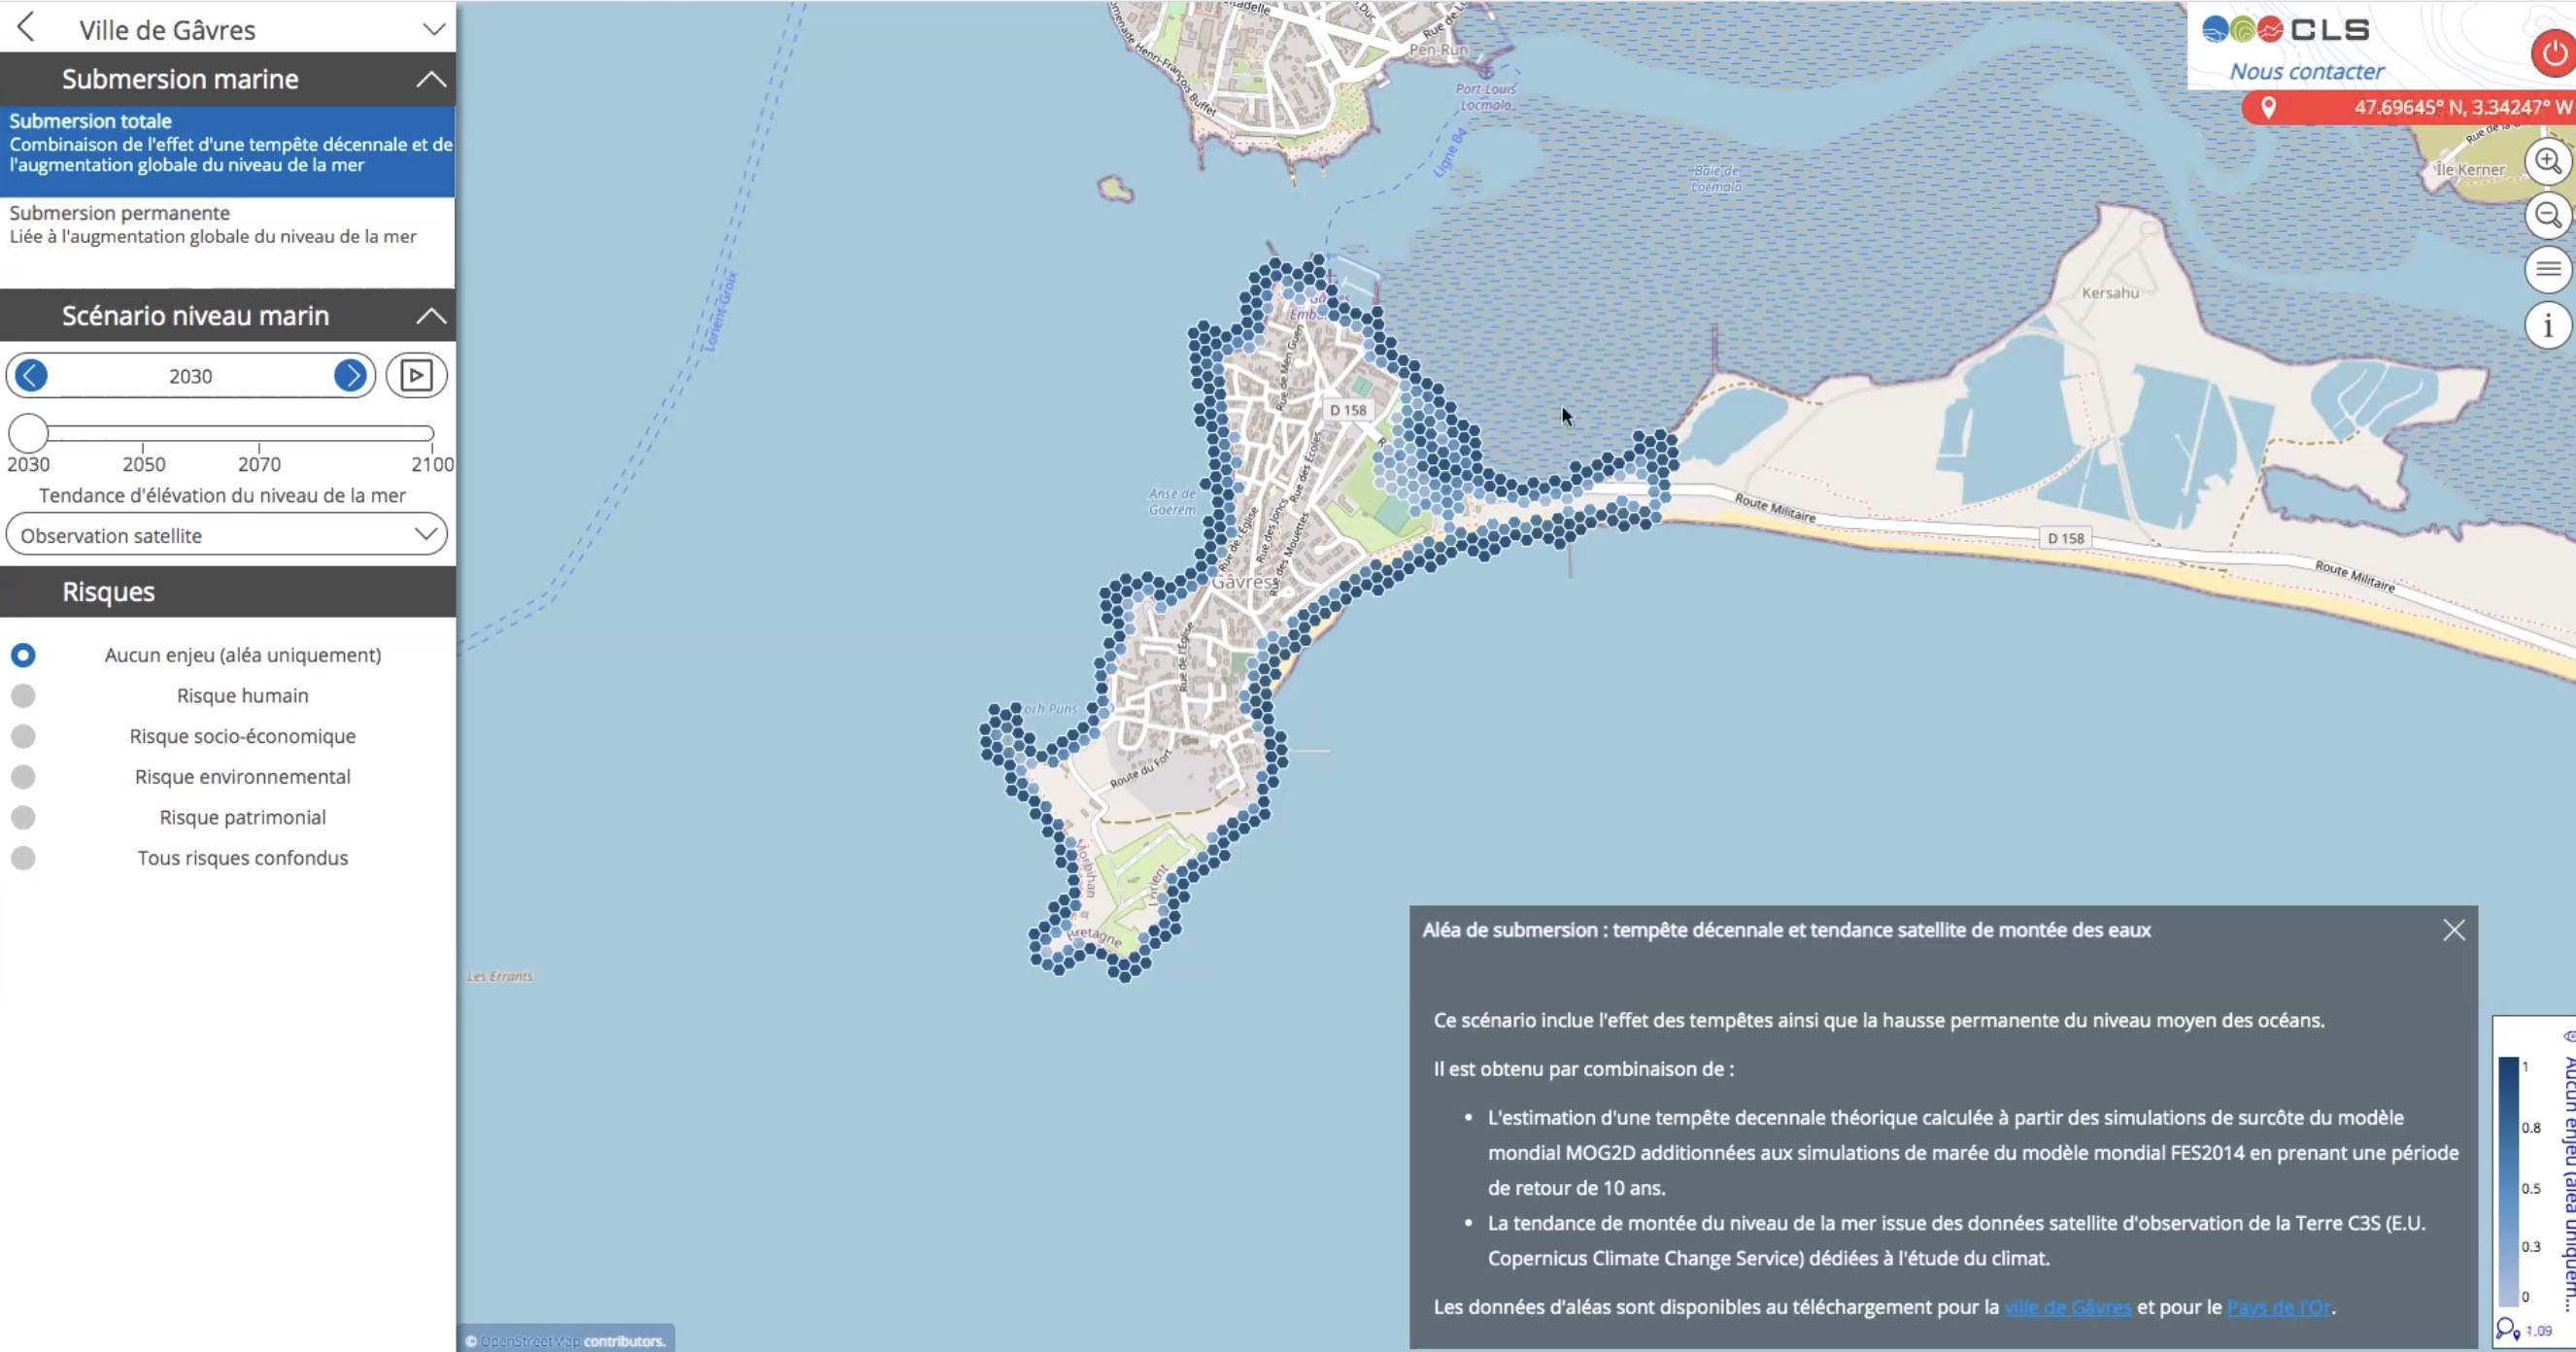
Simulation of the rise in water level in the town of Gâvres that would be produced by a ten-year storm in 2030, taking into account the global rise in sea level. © Littoscope
Feedback from users
It should be remembered that the territories have been integrated throughout the project to be as close as possible to their problems and needs.
Whether it is the municipality of Gâvres, the agglomeration of Lorient, the « Pays de l'or » or « Montpellier-Métropole », all representatives have appreciated the innovative way to address the problem of marine submersions. Although they regret that the elevation accuracy of satellite measurements (of the order of 1m) is insufficient compared to other measurement methods available on French territory, the tool already provides them with answers to identify risk areas in their territories in the long term. They also mention a very educational tool in terms of communication and awareness.
Towards a post Littoscope?
While access to the Web platform is maintained for both territories, the project is now closed. However, users are clearly expecting a follow-up: on the one hand in terms of accuracy, which ever more powerful satellite sensors will provide in the near future, and on the other hand to integrate hydrodynamic data such as swell into the projections.
Benoît Meyssignac, a representative of LEGOS, recommends that the maps produced should evolve to provide, beyond the "simple" visualization of the calculated scenarios, the differential, i.e. the difference in sea level rise, between two scenarios based on IPCC projections (drastic reduction of GHGs or not, for example). This would make it possible to "weigh up the efforts in terms of adaptation and the return on investment with regard to the risks".
Concluding the session, Laurence Monnoyer-Smith, representative of the SCO France at CNES, did not hide her interest in going beyond the demonstrator: "Today's discussions show the interest of the Littoscope method, which is capable of changing the situation for the territories. The SCO is ready to support a final phase to ensure the sustainability of the tools and the definition of a profitable service in order to deploy it internationally. Thank you all!"
Technical immersion
For those of you who are particularly interested in the Littoscope project, here is a non-exhaustive overview of the adjustments the team has made in recent months. The reports will soon be available on the SCO website.
- Generation of the Digital Elevation Model or DEM: to obtain a reliable elevation profile, the team first produced a DEM from Pleiades data using CARS software. From this DEM, a DTM is extracted by applying a "Drap Cloth" method. The final DEM is obtained by removing the wooded vegetation (extracted by supervised classification) and keeping the elevation of the DTM over the buildings. The performances of the DEM and DTM obtained were evaluated by comparison with Litto3D data (SHOM/IGN) on Palavas and BRGM Lidar data on Gâvres.
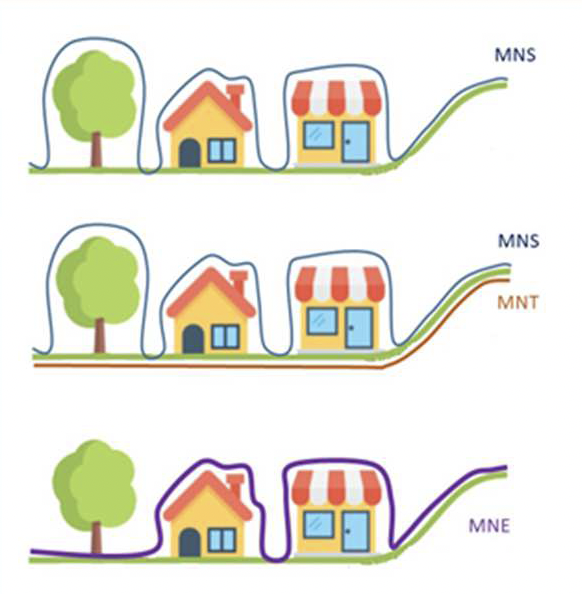
Since the satellite sees "from above", it interprets the surface of the canopy of a plant to the ground where, in reality, only the trunk obstructs the water. The DSM from the satellite data must therefore be related to the DTM to deduce the actual elevation profile.
- Vertical adjustment land/sea: by comparison of the DTM with the average ocean surface, it appears that the DTM must be lowered by 54 cm for Palavas and 44.8 cm for Gâvres to calculate a realistic long-term flood height.
- HR modelling of submersions with the DEM: in order to evaluate the contribution of a DEM derived from spatial data, BRGM injected it into its wave propagation simulation models and measured the impact in the context of a scenario recreating the oceanographic conditions of the last major submersion at Gâvres, storm Johanna on 10 March 2008, and then these same conditions + one metre rise in mean sea level. By comparison with the same simulations using a DEM derived from in-situ and LIDAR data, it appears that the Pleiades DEM induces an overestimation of water heights on land during the 2008 event. Avenues for improving the construction of the DEM have been identified. A DEM derived from satellite data remains relevant for areas where more accurate field data are not available.
- Hazard mapping: in addition to the HR modeling, the team mapped the hazards using a method based solely on satellite data, which can therefore be deployed on any coastline. It completed its simulations, calculating a total of 24 scenarios of marine submersion on each territory: on 4 dates from 2030 to 2100, with or without storms, and according to the 2 extreme scenarios of the IPCC (RCP2.6, the most optimistic, and RCP8.5, the most pessimistic) in addition to the trend of sea level rise observed over the last 30 years by satellite altimetry.
- Risk mapping: risk maps have been calculated by crossing the stakes of the territories with the hazards, according to 5 indicators: human, economic, environmental, patrimonial and all risks combined.
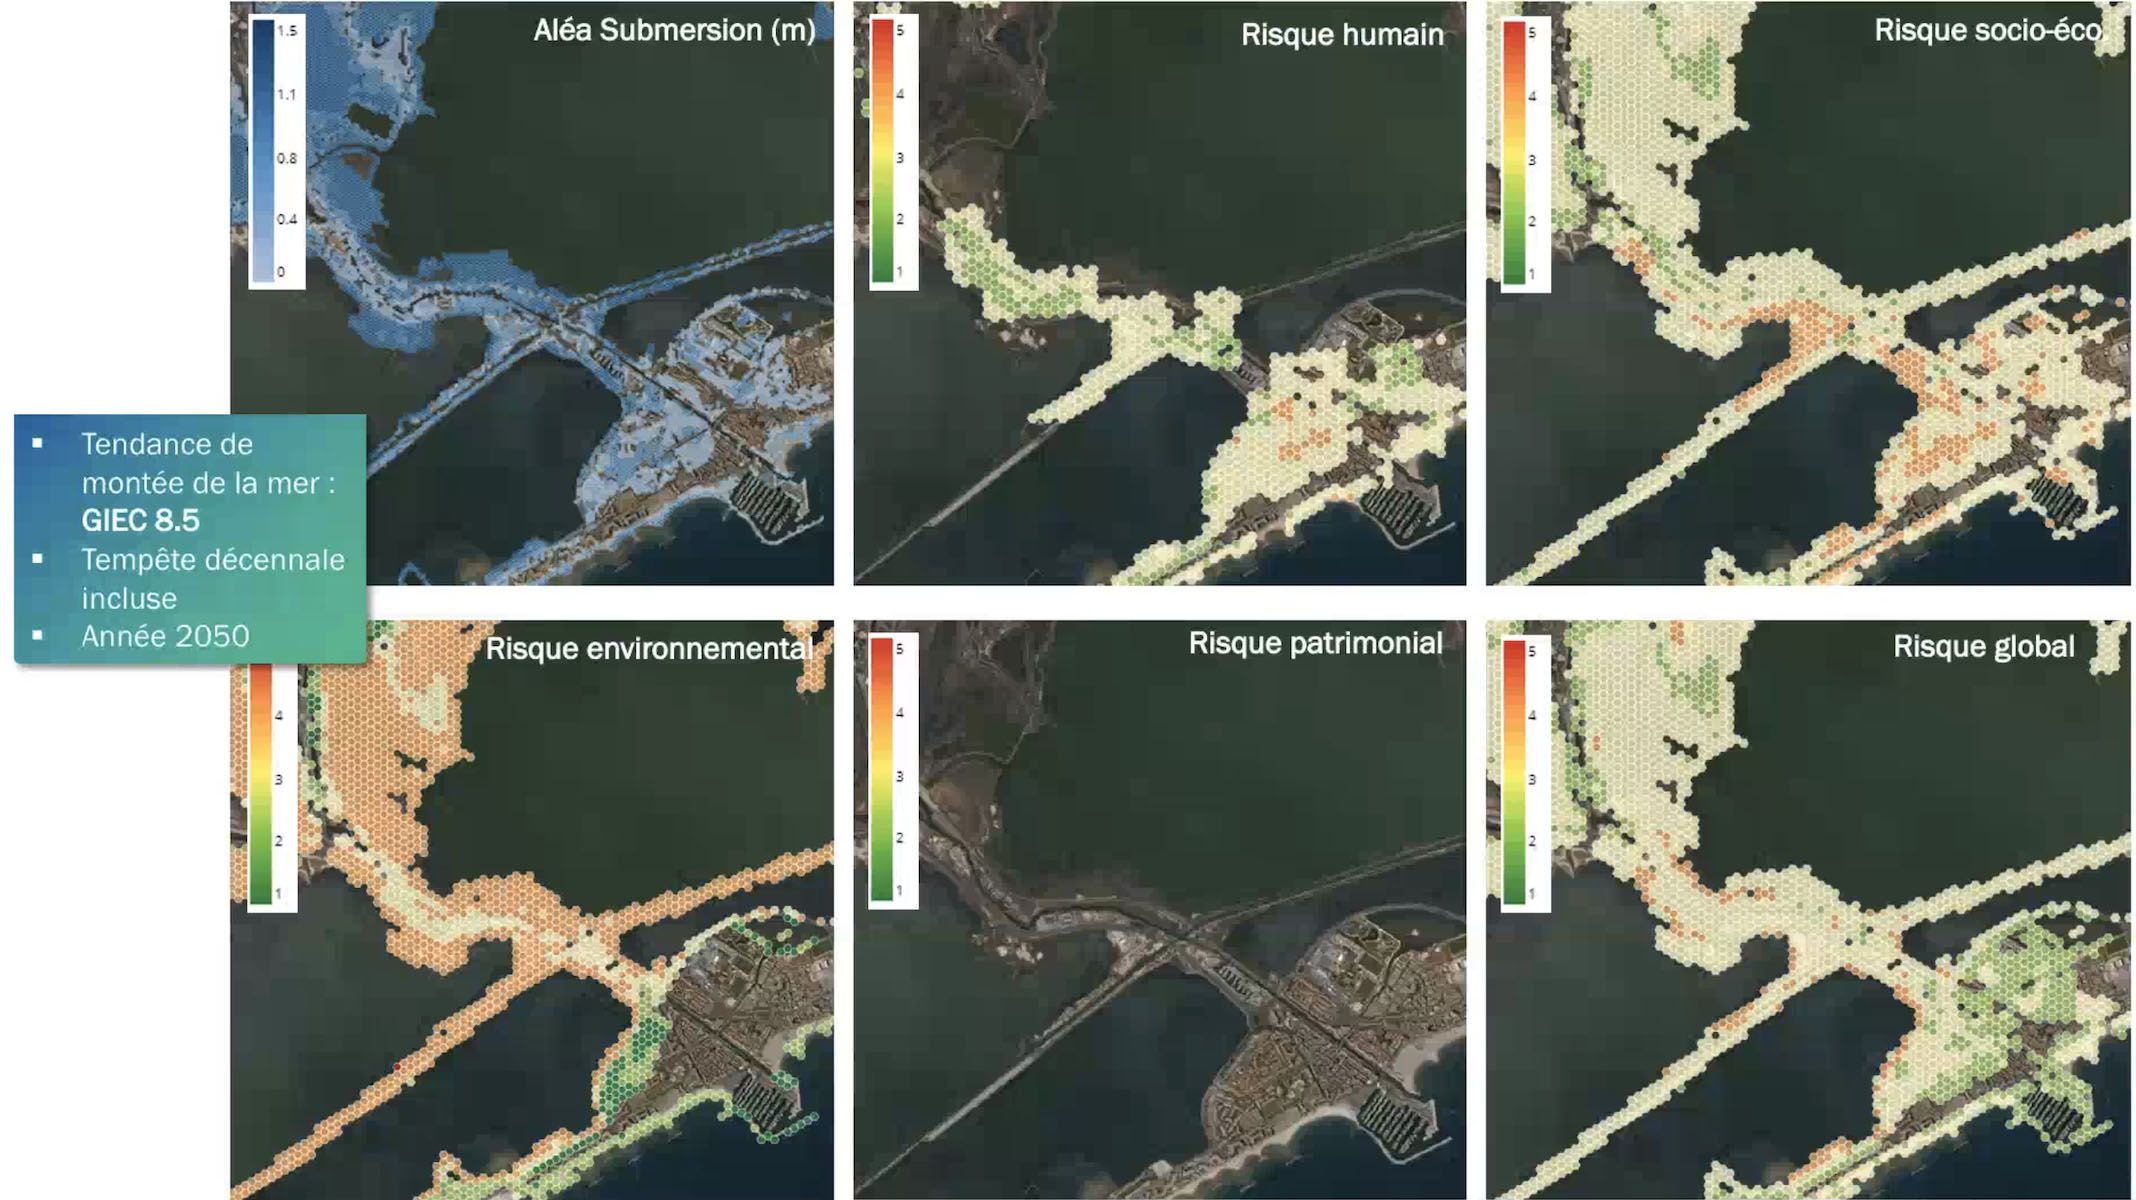
Since each risk has its own units (km2, rate...), the degree of risk was normalized on a scale of 1 to 5. © Littoscope
To go further and provide numerical estimates rather than degrees of risk, the team also sought to estimate the affected population and the costs involved, taking into account the demographic and economic growth of the territories.
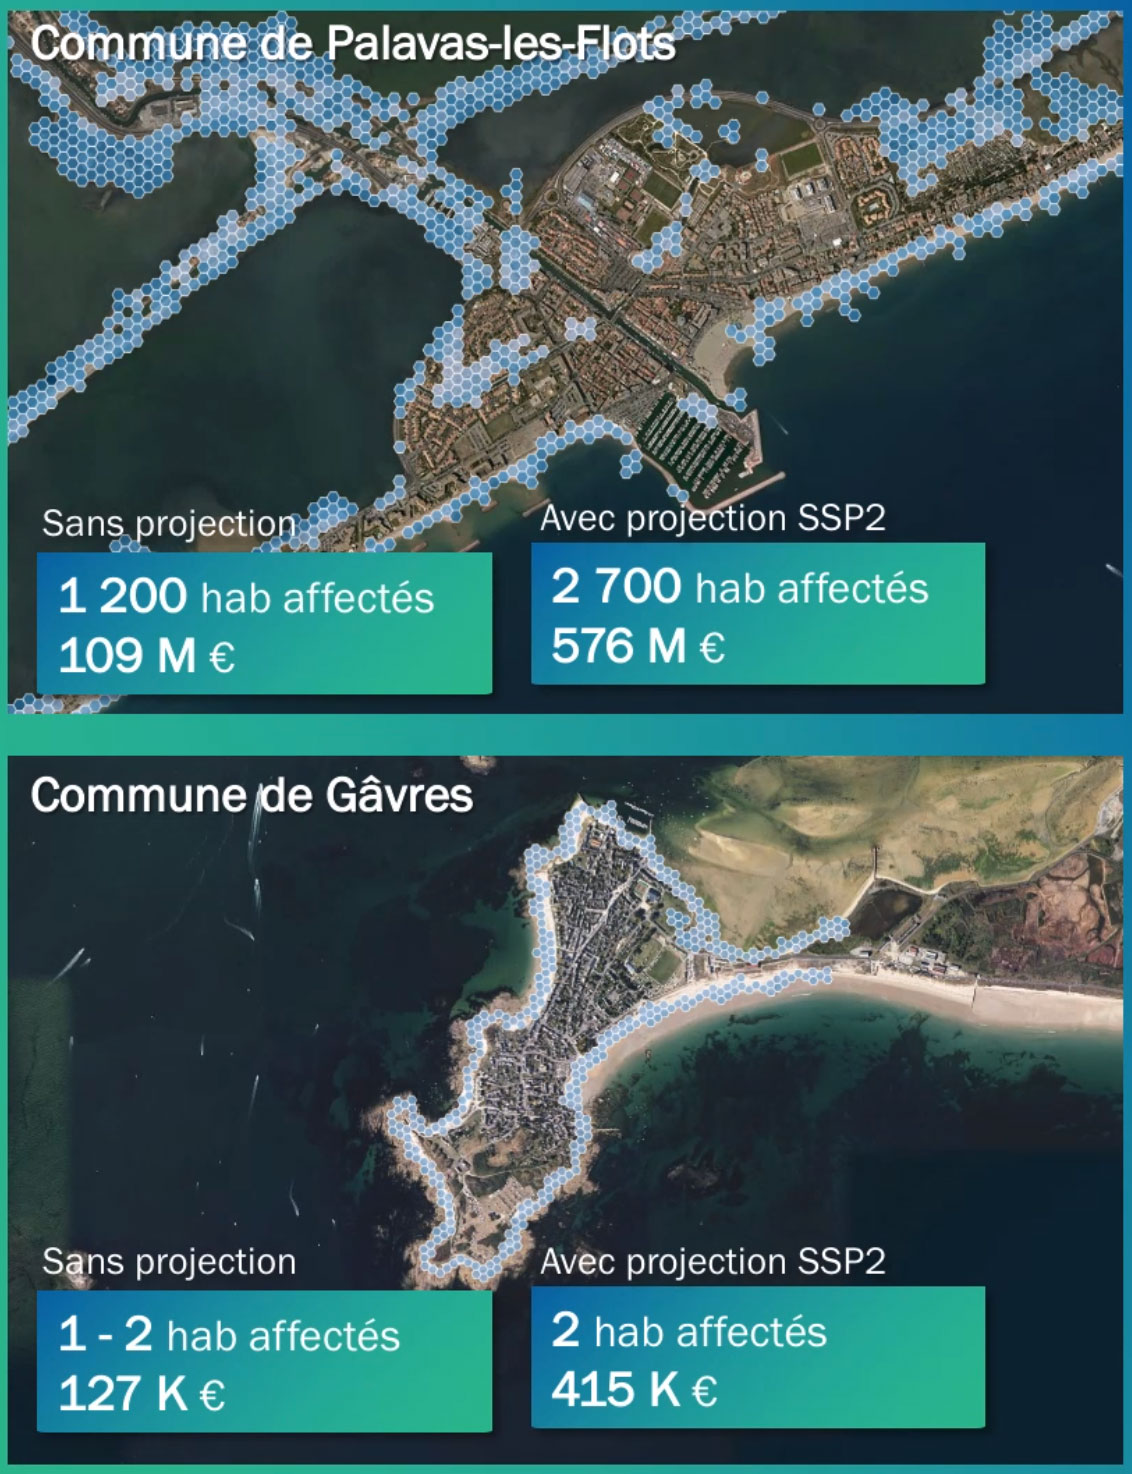
Evaluation of the affected population and costs for a sea level rise in 2070, according to the IPCC worst-case scenario and without storm. © Littoscope