

Pleiades data in SCO projects
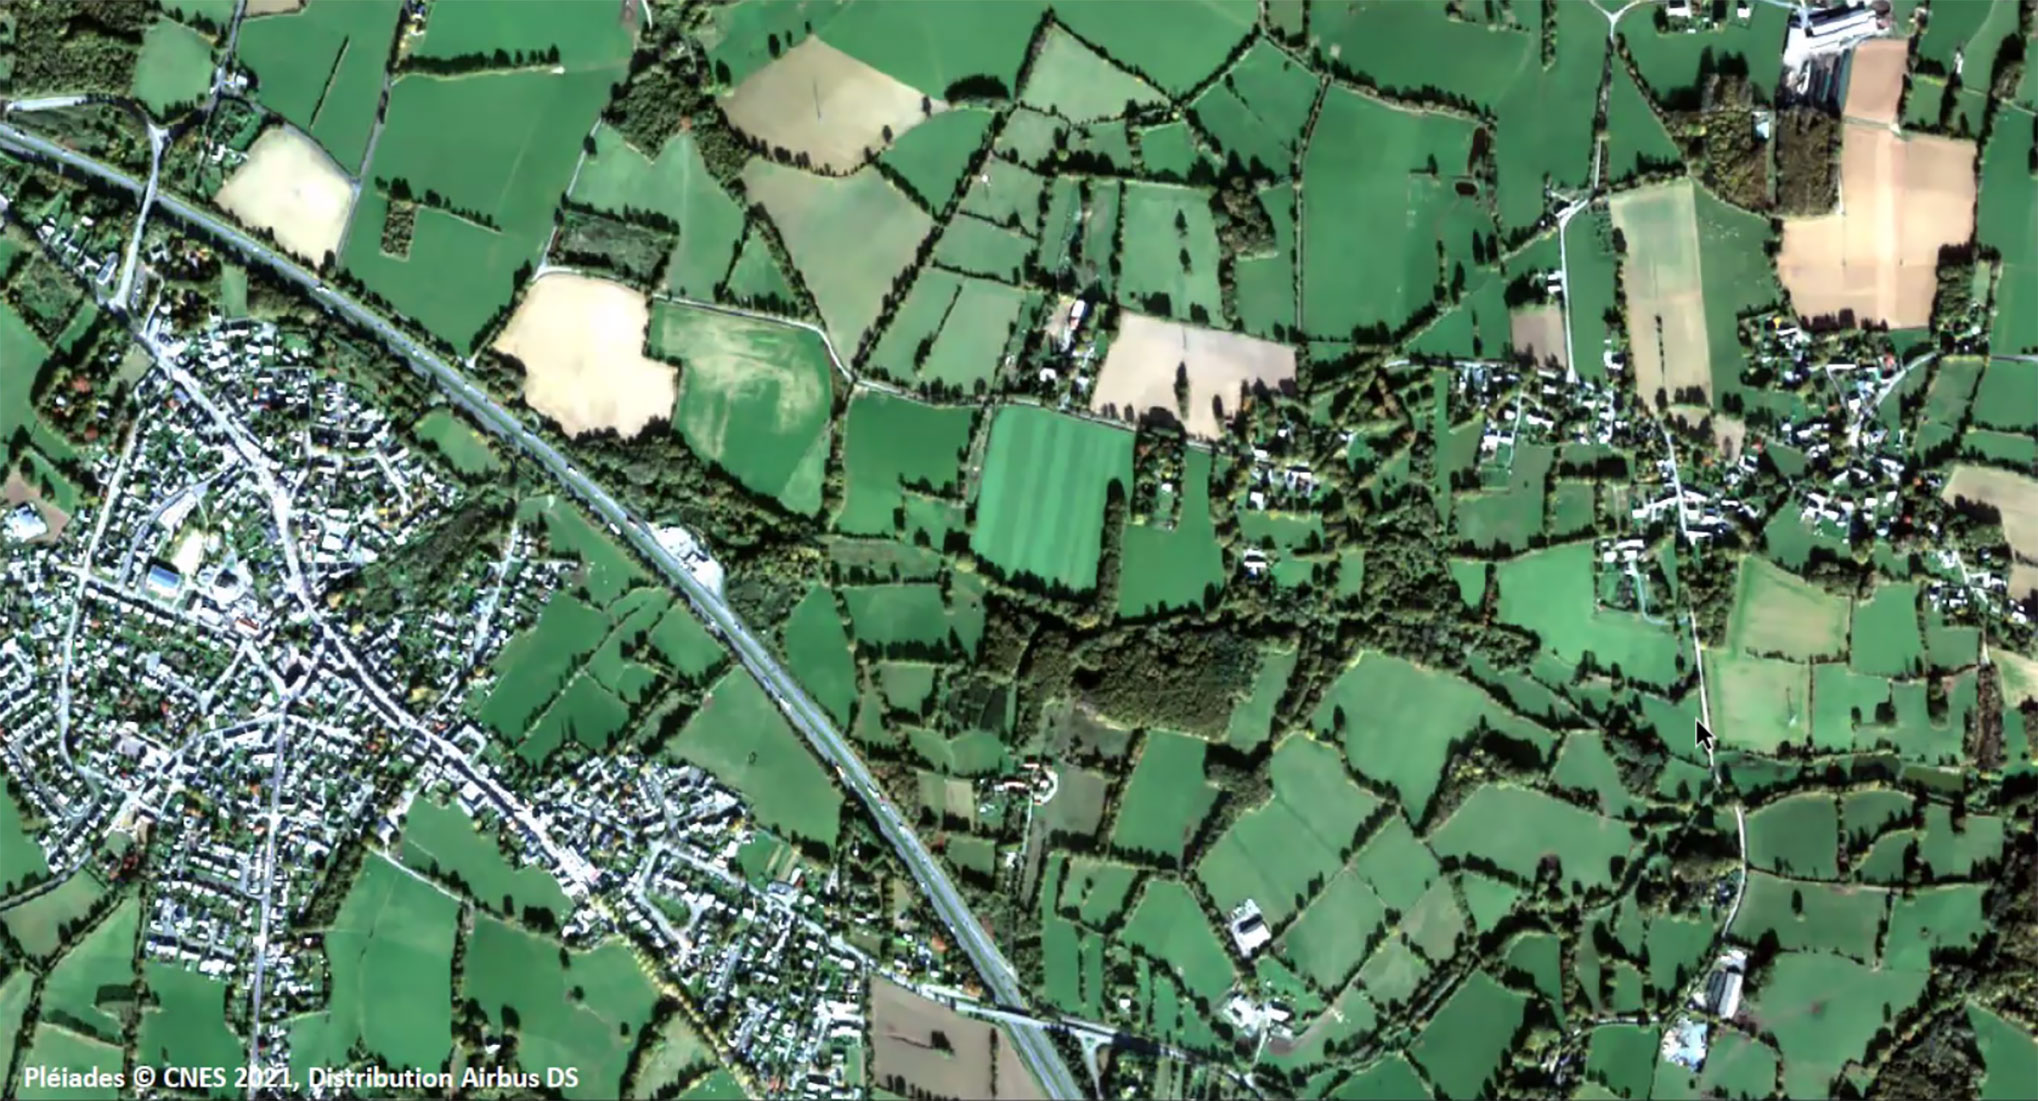
From the coast to urban and rural areas, the sharp, stereoscopic view of the Pleiades satellite pair perfectly scans all types of landscape. Behind these remarkable images lie data rich in information, provided that one knows how to handle them, starting with knowing where to find them!
On Thursday 30 June 2022, the 5th Quarterly of the SCO France focused on Pleiades data. Below is a video review (in French) of the 4 highlights of this session which won over the audience.
If you have any questions about this quarterly, please send an email to seminairesco.fr@capgemini.com.
Dinamis
The Dinamis platform was created to provide a unique and simplified access to EO images, mainly Pleiades and Spot 6/7, but also to support users in their image request process. In a remarkably clear summary, Delphine Fontannaz, Dinamis Project Manager at CNES, explains the conditions of use and the workings of this system.
To remember
- Authorised Institutional Users: French scientists (and European scientists under certain conditions), French public actors, private entities for their R&D needs.
- Dinamis provides raw images, including pre-processing and delivered in different formats.
- All data in the Dinamis catalogue is free of charge.
- Possibility of acquiring new data with an evolving free quota depending on the nature of the user.
- Dinamis is negotiating with various suppliers to offer new images, including Pleiades Neo and CO3D.
- Benefit from free Pleiades Neo images by participating in the Pleiades Neo Challenge call for projects launched by Airbus DS.
Littoscope
Climate change is increasing the risk of coastal flooding. The Littoscope project, which is being tested in the Mediterranean (Palavas-les-Flots and Montpellier) and Atlantic (Gâvres) areas, is studying a method based entirely on satellite data to predict coastal areas at risk of flooding in the event of a rise in mean sea level and strong storms. Presentation by Solange Lemai-Chenevier, engineer at the CNES Lab'OT.
To remember
- The project uses optical tri-stereoscopic Pleiades images to generate the Digital Terrain Model of the coastline, and a rectified nadir ortho image (corrected for distortions to appear as acquired from the vertical) to produce the land cover map.
- In addition, Littoscope uses altimetry data, in particular the sea level rise indicator provided by the Copernicus CMEMS and C3S services.
- Following its request via Dinamis, the team obtained an acquisition schedule with a low tide constraint.
- Using atmospheric surge and tidal height models, as well as the addition of human and financial risk estimation data, 24 scenarios were simulated, with or without a 10-year storm, on the most optimistic and pessimistic IPCC projections.
- The methodology applied on French territories can be applied worldwide.
Green Urban Sat
Nature-based solutions strengthen the resilience of territories to climate change. Presented by Mathilde Segaud from CEREMA, the Green Urban Sat project is developing a method for generating a geospatial database from satellite images that provides a detailed description of vegetation and evaluates the ecosystem services provided. The result is a decision-making tool for local authorities in terms of land use planning and biodiversity preservation.
To remember
- Exclusively using Pleiades imagery, including Pleiades Neo, the project produces a detailed map of the urban area's vegetation heritage, from which indicators characterising the vegetation are calculated.
- Multitemporal images are used to obtain seasonality and vegetation type, while tri-stereo images are used to generate a digital height model, including vegetation.
- In addition, the project mobilises GIS data from the IGN on a national scale and Copernicus on a European scale. The method has been validated thanks to the business databases provided by Nancy (tree management) and Strasbourg (vegetation height), the two pilot territories.
- In order to calculate realistic indicators, the project takes into account the structure of the vegetation but also the landscape in which it is located.
EagleHedges
Ecological corridor, biodiversity refuge, fight against flooding and soil erosion... The hedgerow network is an ally of the ecological transition in many ways. EagleHedges is the result of an alliance between public and private structures and research. Its objective is to automatically detect and monitor the national hedge network. Presented in tandem by Maïlys Lopes (Terranis) and David Sheeren (Institut national polytechnique de Toulouse), the project is also developing an open source tool to characterise hedges from a morphological, structural and functional point of view via standardised business indicators.
To remember
- The project uses optical data at different spatial resolutions: BDOrtho (IGN) at 20 and 50 cm, Pleiades at 50 cm or 2 m, Pleiades Neo perspective at 30 cm and SPOT-6/7 at 1.5 m or 6 m.
- From this data, a hedge surface layer is automatically extracted and changes in hedges (such as cutting or new planting between two vintages) are detected.
- HedgeTool, a QGIS toolkit, allows the characterisation of hedgerows and the calculation of business indicators based on the needs of the territory and coordinated by the French agroforestry association (FAC).
- The generated maps allow the visualisation of hedge networks and their connections or the individualisation of hedges (every 30 metres) by average width and/or by vegetation level.