

SCOFrance
8léiades and Pléiades Neo images from 2012 to 2024
PartenersCerema, Agenium IT Systems, TerraNIS, Airbus DS, CNES
Useful linksPléiades4UrbanFlood Demonstrator
KeywordsUrban environment, land use, flooding, runoff, hydraulic modeling, risk management, forecasting
P4UF has automated satellite-based hydraulic modeling
You don't need to be a scientist to see that flooding is on the rise; you just need to listen to the news. In France, as elsewhere, these floods, which are often sudden, are the result of surface runoff exacerbated by increased rainfall combined with growing urbanization.
In this context, would it be possible – and relevant – to use high- and very high-resolution satellite imagery to produce a detailed assessment of urban vulnerability to flooding? This is the question that the P4UF project, launched in the summer of 2023, sought to answer using monoscopic Pléiades (50 cm) and Pléiades Neo (30 cm) images. To do this, it focused on the pilot city of Grabels (France, Hérault), taking into account the urban growth of this small town and the natural disasters it has suffered, including an exceptional flood in 2014 and a fire in 2017.
With convincing results, the project partners now offer a rigorous methodology validated by field data. Detailed in our article of 19 May 2025, this methodology is based on:
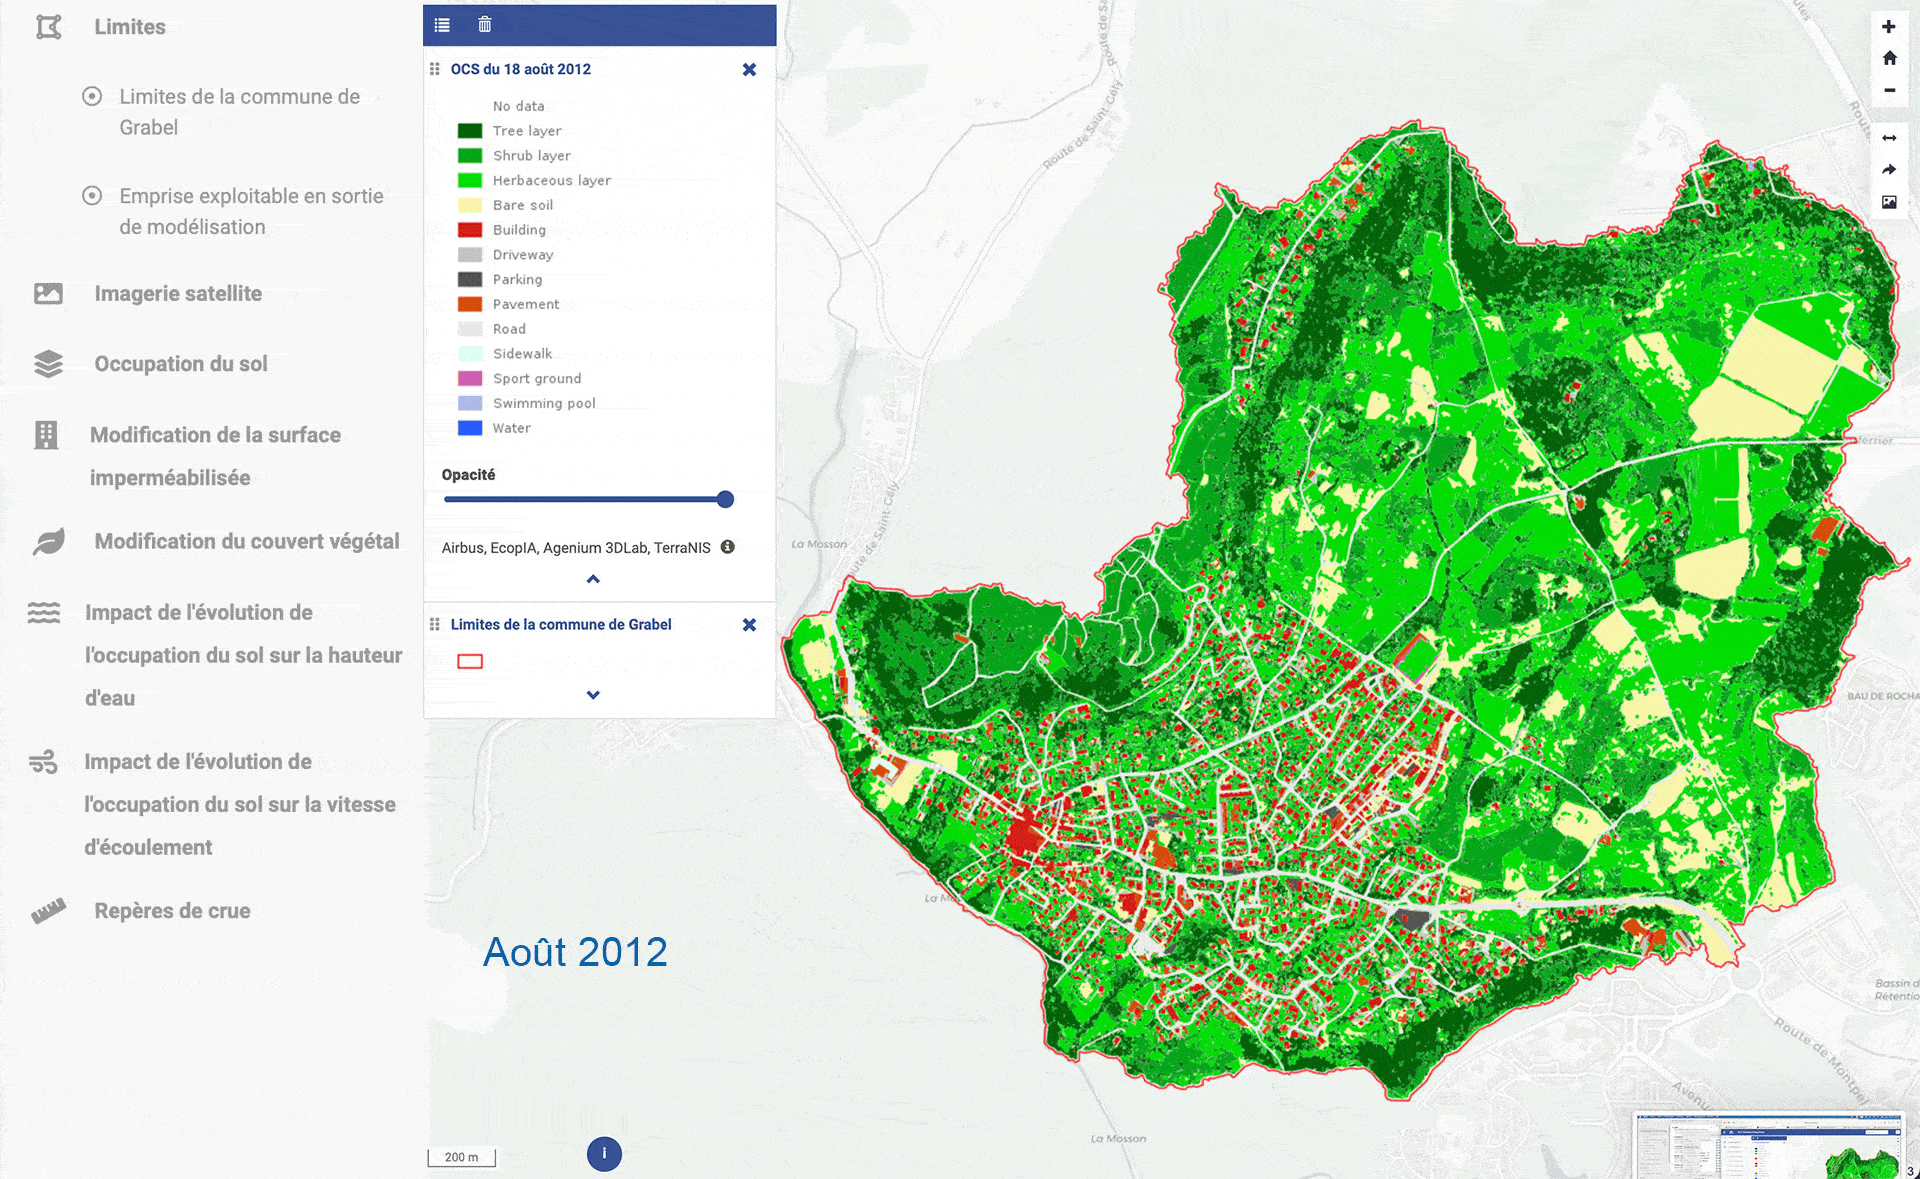
- 8 monoscopic Pléiades and Pléiades Neo (2D) images of Grabels at key dates: the "initial" situation in 2012, flooding due to the flash flood of 2014, the fire of 2017, and the situation in 2024.
- From these, preliminary land use maps were generated with six major categories, including buildings and vegetation.
- These were used as input data for a hydraulic model to estimate surface runoff (height x water velocity), taking into account soil infiltration coefficients and friction (rough or smooth surfaces).
- To highlight the changes and impacts of each event and simulate future scenarios.
A platform open to all
|
Built using 100% open-source tools, the SCO Pléiades4UrbanFlood mapping platform makes it easy to contextualize and visualize the project results via layers that can all be superimposed. In particular, you can display the eight Pléiades and Pléiades Neo satellite images, each with: |
The P4UF application is accessible via the Greencity visualization platform, developed as part of the SCO GreenUrbanSat project, which, also led by Cerema/TerraNIS, has automated detailed mapping of urban vegetation. |
- Land use maps.
- Changes in impervious surfaces and vegetation cover.
- The impact of changes in land use on water levels and flow velocity.
👉 High water levels make it possible to identify areas that are almost permanently submerged or affected during flash floods.
👉 High velocities highlight corridors of rapid and destructive flow.
👉 The combination of these two factors makes it possible to determine flood risk, guiding both impact analysis and the design of targeted adaptation strategies and warning systems.
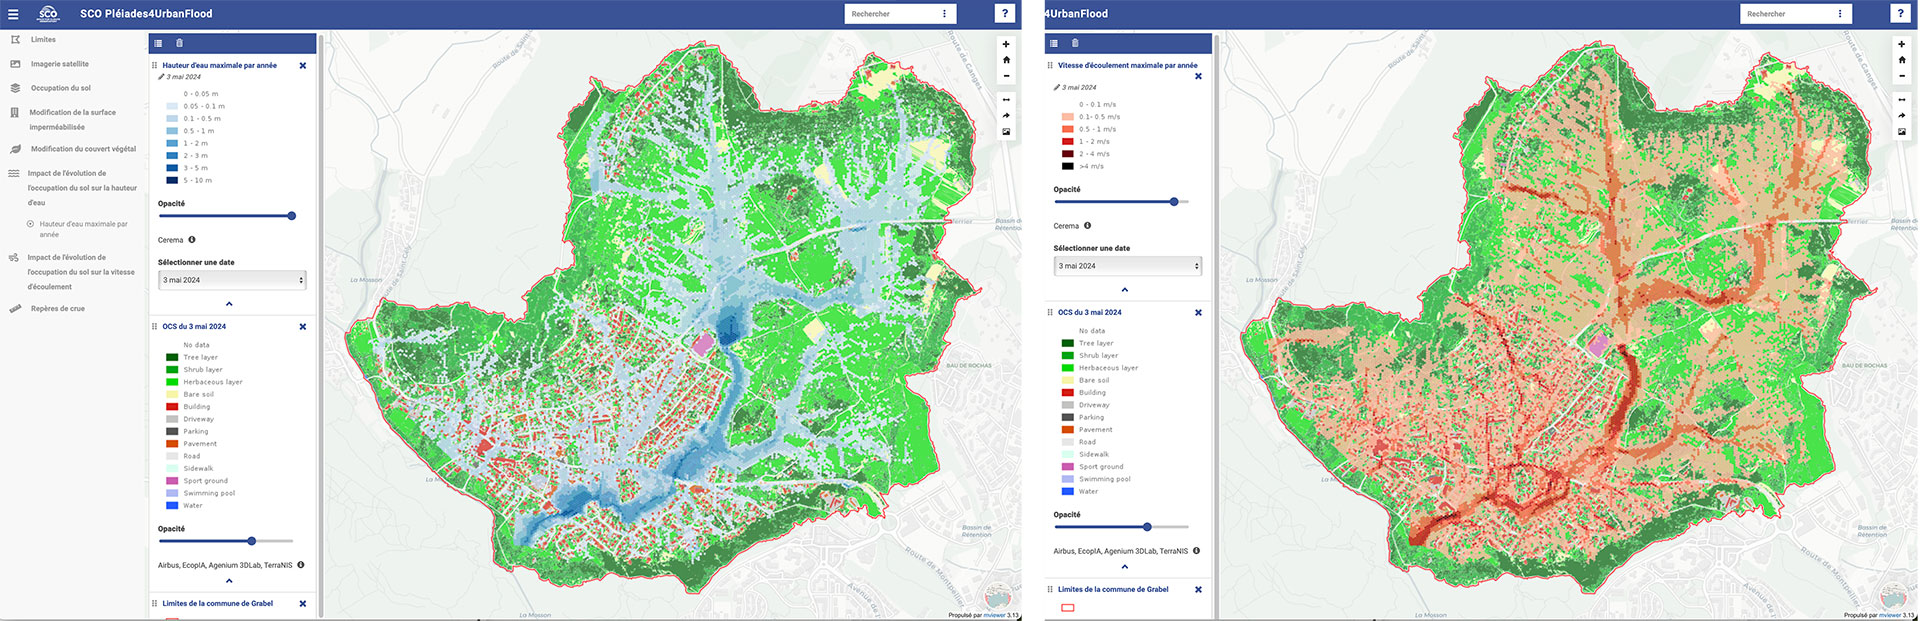
Overlay of land use in May 2024 and, by applying the hydraulic model to this map, the impact of the latter on water levels (left) and water flow velocity (right), based on the characteristics of the 2014 flash flood. © Cerema/TerraNIS
🖱️ Go to the SCO Pléiades4UrbanFlood demonstrator
See the detailed results on the project page.
A core method that can be transposed
We would like to acknowledge the excellent cooperation between the private partners, who provided the satellite images (Airbus DS), generated the land use maps (Agenium IT System, TerraNIS, Airbus DS) and developed the visualization platform (TerraNIS), and Cerema, a French public body, which carried out the hydraulic modelling work. Together, they have overcome technical and scientific obstacles that will pave the way for the creation of new operational services.
As Vanessya Laborie, head of hydraulic modelling at Cerema, explains, "thanks to P4UF, we now have an integrated hydraulic modelling chain that opens up exciting prospects for going further and implementing pre- and post-processing chains to simulate other climate change events. This is excellent news because, in my opinion, modelling specific events cannot be envisaged with tools other than satellites." Her enthusiasm is shared by her colleague Teodolina Lopez, P4UF project manager: "Full satellite modelling, using CO3D data for example, will save a considerable amount of time when creating and updating hazard maps in different environments, such as estuaries and overseas territories. It will also enable various simulations to be carried out based on several climate scenarios, making it a powerful tool for forecasting and decision-making."
For their part, the project's industrial partners, who created the various land cover layers and the visualization platform, envisage services that are particularly relevant at the international level.
Focus on the Built layer
Agenium IT & System has developed a complete automatic chain for detecting buildings in satellite images and generating building footprints that can be used directly in mapping solutions. The core of the system is based on an artificial intelligence model that produces a precise mask of the building after analyzing the image. Next, a vectorization step transforms this mask into vector contours, which are suitable for mapping and GIS uses. This vectorization is generated using simplification and orthogonalization techniques to obtain cleaner and more consistent shapes. Although some cases remain complex (terraced buildings, irregular shapes or highly detailed contours), the model has been trained on a variety of images to improve its robustness and ability to handle different types of buildings.