

TropiSCO
, where dense forest has been transformed into a structured expanse of farmland (fields of about 20 km2 each). But unlike other forests, tropical forests do not regrow when destroyed and, because of their composition, their soils are not suitable for long-term agricultural use.")
Monitoring tropical deforestation using spatial data
The tropisco.org platform has been online and freely accessible since 27 June 2022.
OVERVIEW
Forests cover about 30% of the Earth's land area and provide humanity with many ecosystem services, such as climate change mitigation (carbon sinks) or soil erosion control. In particular, tropical forests - which constitute only 6% of the land area - possess more than half of the Earth's biodiversity. This biodiversity is itself very rich for humanity: a reserve of molecules for the pharmaceutical industry, pollination, cultural and social services...
However, forests are disappearing at an alarming rate. Between 1990 and 2020, an area of forest equivalent to more than three times that of metropolitan France has disappeared. Tropical forests, which account for half of the world's forests, are seriously threatened: in 2019, the equivalent of a soccer stadium is destroyed every two seconds (FAO, 2020). In addition to the loss of ecosystem services associated with the forest, deforestation has other negative effects: for example, a link has been established between deforestation and the emergence of infectious diseases, through the contact of wild animals and habitats with domestic animals and human populations (Guégan et al. 2020). The tropical forest must therefore be protected and monitored.
Obtaining information on global deforestation activities is of considerable importance.The first and only global forest monitoring program, Global Forest Watch, based on Landsat optical images, was developed in 2013 in the United States (Hansen et al., 2013). Each year, a global deforestation map is updated and distributed for free on the Global Forest Watch platform. Weekly maps have also been published since 2016, but they are based on optical satellite data that are highly disrupted by extensive cloud cover. To overcome this problem, new alternative methods based on the use of radar imagery have been studied for a few years.
The TropiSCO method
Thanks to the collaboration of CNES, the CESBIO laboratory and the startup GlobEO, an innovative approach has been developed, implemented and tested on many territories. Based on the use of time series of radar images from the European Sentinel-1 system, this approach has the advantage of detecting deforested areas rapidly, systematically and in all seasons. This new method has been operationally proven in regions and countries such as Guyana, Gabon, Vietnam, Laos and Peru. The next step is to implement these algorithms on a large scale, over the entire tropical belt.
TropiSCO therefore proposes to develop a platform for monitoring tropical deforestation on a global scale using Sentinel-1 radar images. The main advantage of this project lies in the short delay between the event in the forest and the detection by the algorithm, between 6 and 12 days depending on the area considered.
TropiSCO will benefit from a close collaboration with some partner countries of the programs led by France in the Amazon, Congo and South-East Asia basins to adapt the detection tool to their needs.
TropiSCO data will have many uses: fighting illegal logging and mining, illegal agricultural crops and wildlife trafficking, but also providing easily usable data and statistics. Many users would be interested: governments, NGOs, fire monitors, universities, the general public or companies wishing to reduce the risk of deforestation in their supply chains.
Application site(s)
- In the first phase (phase A), the experimental territories are:
- Territory 1: the Guiana Shield (French Guiana, Suriname, Guyana)
- Territory 2: Southeast Asia (Laos, Cambodia, Vietnam)
- Territory 3: Gabon
- In the final phase (Phase B), the project will cover all tropical forests in South America, Africa and Asia
👉 October 2024: Thailand
👉 November 2024: Brazilian Amazon
DATA
Satellite
Sentinel-1 (radar)
Other
In-situ deforestation data and analysis of recent high-resolution optical images will be used to validate the products.
RESULTS - FINAL PRODUCTS
- Tropical deforestation map at 10 m resolution every 6 to 12 days (depending on the Sentinel-1 observation frequency which varies with the continents)
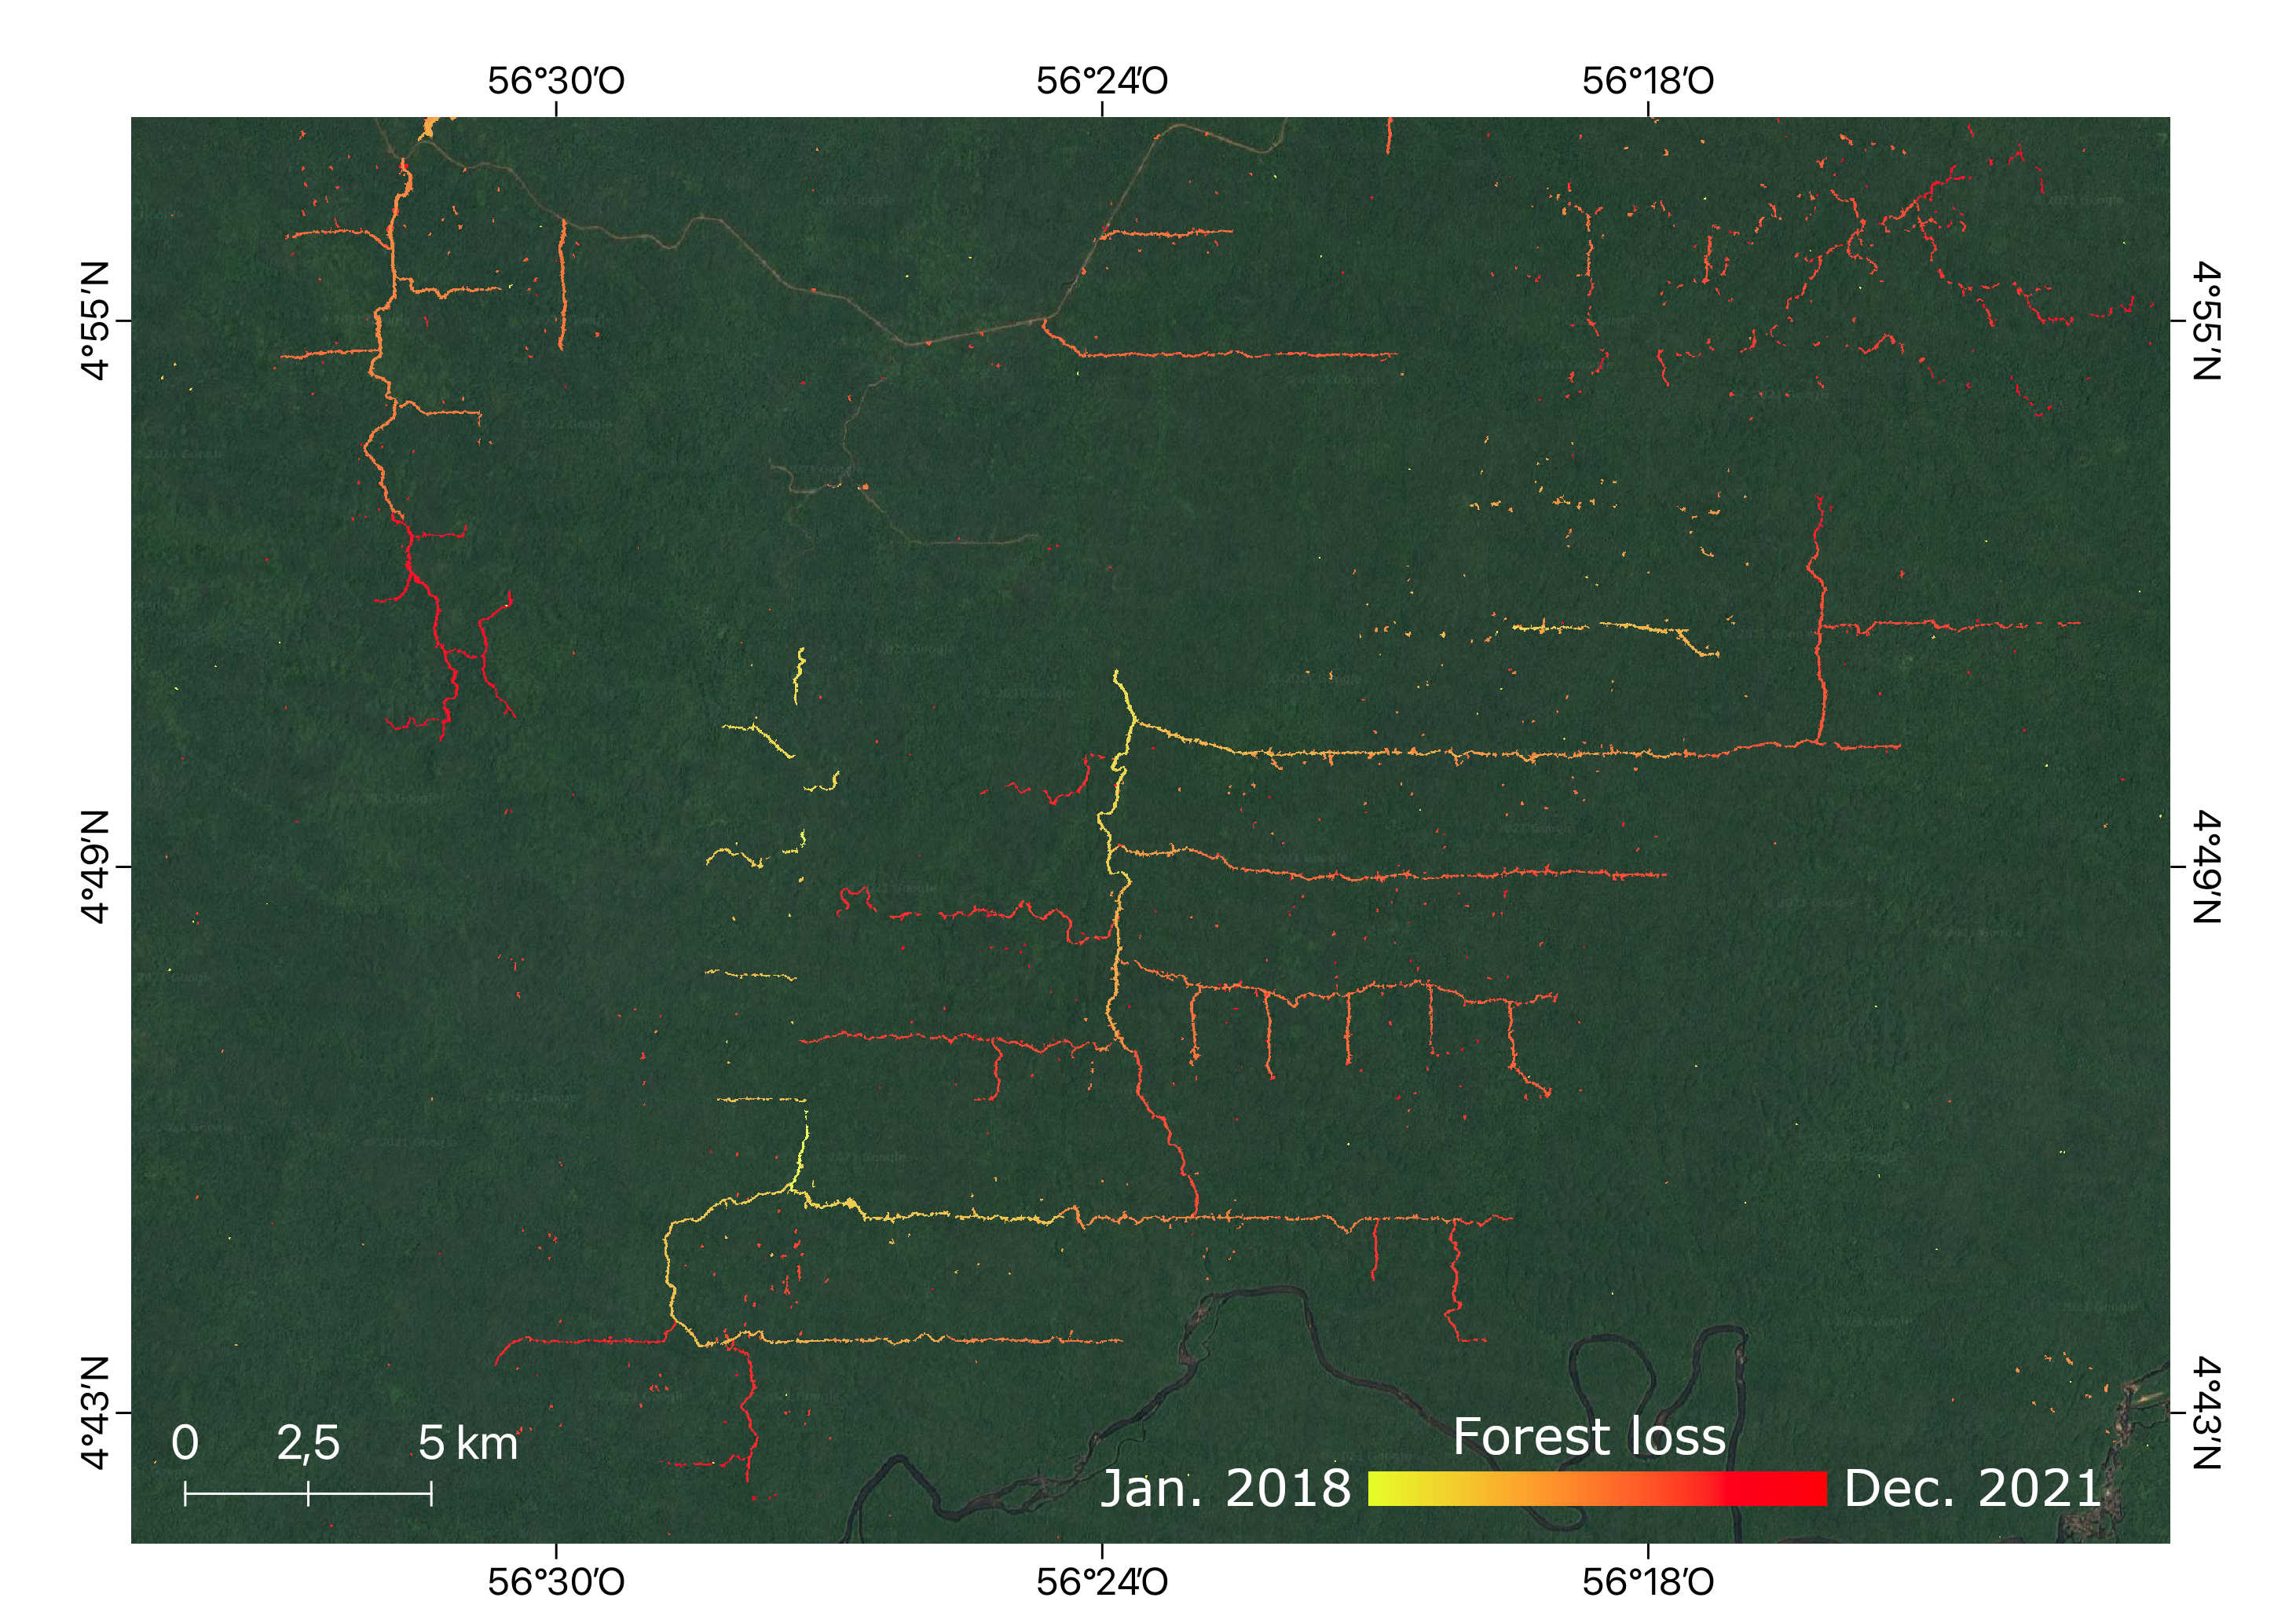
Zooming in on Suriname's deforestation on a very fine scale from 2018 to 2021. © GlobEO
- Web-based platform for free data viewing and downloading. Able to analyze these data dynamically to make them easily usable, the tool also allows to calculate statistics by geographical area
The tropisco.org platform has been online since 27 June 2022.
In less than two years, the TropiSCO project will be able to implement a unique operational observation tool, potentially covering all tropical forests at high spatial and temporal resolution.
Focus on South East Asia
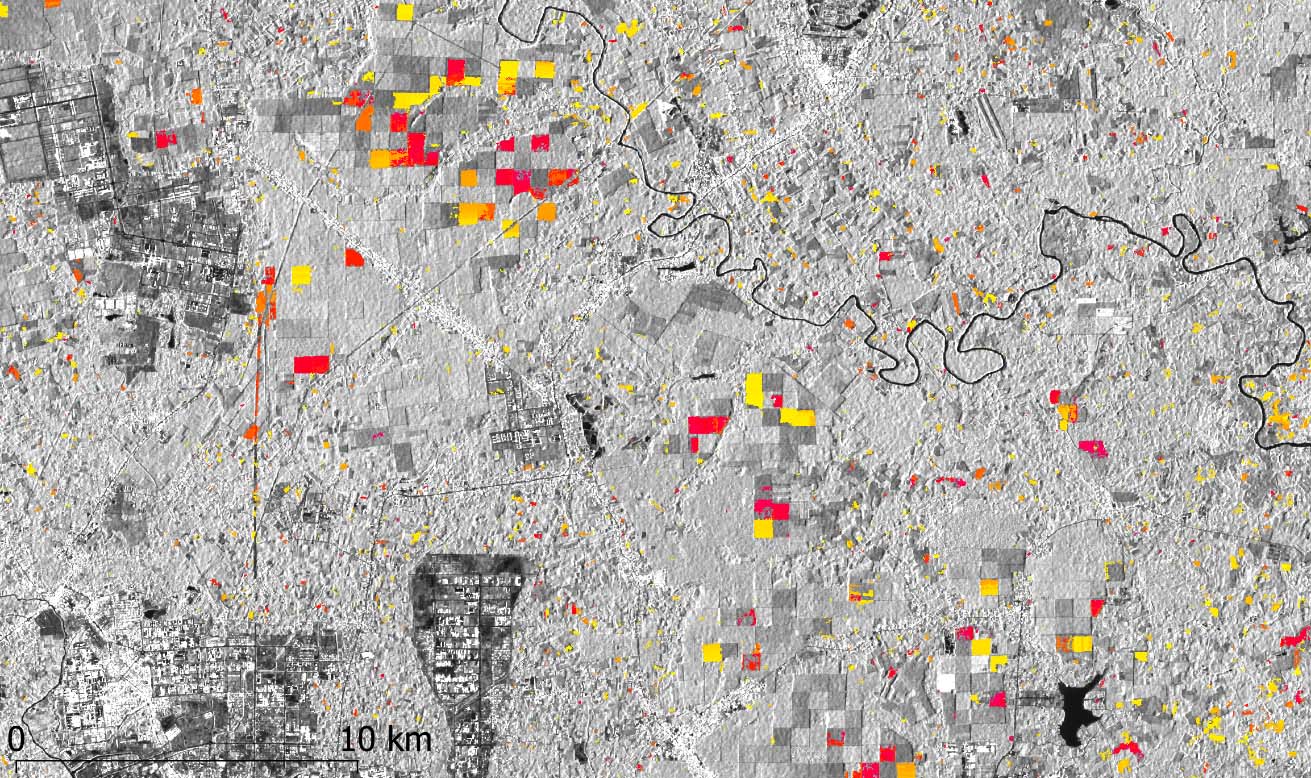 |
◀︎ Monitoring of rubber tree harvesting in the north of Ho Chi Minh City in Vietnam between 2018 (yellow) and 2020 (red). In grey, the areas that were not cut during the period. © GlobEO 2020 |
In the frame of the TropiSCO project, the production is performed in two steps: 1) we first produce weekly forest loss national maps from 2018 to 2021 in one shot, and 2) automatize the process so that the forest loss maps are updated every week. In December 2021, we completed the production of the forest loss maps over Vietnam, Cambodia, and Laos (>750,000 km2 in total).
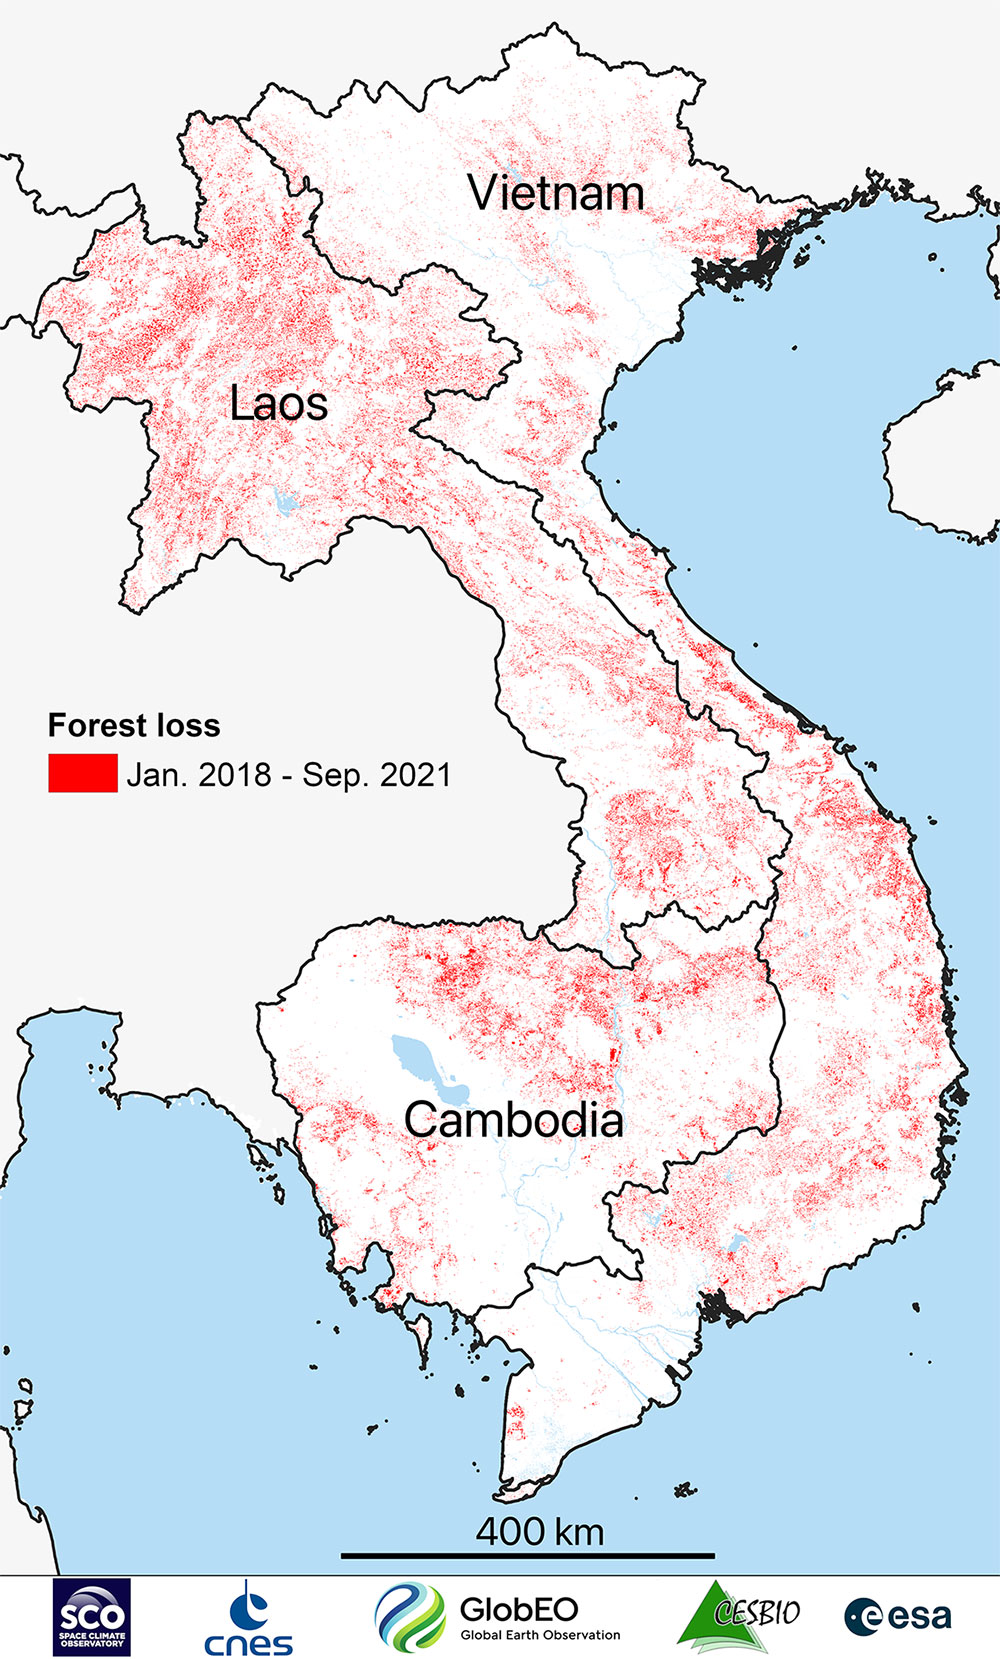 | This map shown below provides clear hints of the spatial and temporal distribution of forest losses. Note that the map was thoroughly validated in Mermoz et al. (2021). The estimated user accuracy of the forest loss map was 0.95 for forest disturbances and 0.99 for intact forest, and the estimated producer’s accuracy was 0.90 for forest disturbances and 0.99 for intact forest, with a minimum mapping unit of 0.1 ha. These results highlight the fact that the method provides not only quick alerts but also reliable detections that can be used to calculate weekly, monthly, or annual forest loss statistics at a national scale.
◀︎ Spatial distribution of deforestation. For example, the map highlights the fact that forest losses are prevalent in the three countries and occur everywhere. The map also demonstrates the striking difference between the low forest loss rates in Vietnam (northern Vietnam was severely affected in the last few decades and its more efforts are being made to preserve its forests now) and the high forest losses currently happening in northern Laos. (Ingalls et al., 2018). |
Specific areas of the whole forest loss map are shown in the figure below. Northern Laos recently experienced the largest deforestation rates as compared with the rest of Laos, Cambodia, and Vietnam. In northwestern Laos, forest was cut mostly for commodities, as seen in subfigure 1 and is also experiencing a rubber boom (Xiao et al., 2020). Subfigure 3 shows infrastructure construction at the border between north and central Laos, whereas Subfigure 5, in central Laos, shows cashew plantations (Hurno et al., 2018). Compared to the plantations located in northern Laos, the cashew plantations in the center of Laos are much more numerous and far smaller. Pulp tree, sugarcane, coffee, and rubber plantations can be found in southern Laos (Subfigure 7). In this region, land concessions are mostly conceded to Vietnamese investors in rubber. Figure 5.8 shows an area where pulp trees have been planted en masse, which is the center of a huge area of plantations that extends roughly from 13°N to 18°N; the forest loss in this area corresponds mostly to plantation logging. Logging roads are visible in Subfigure 11, whereas large areas of timber and particularly rubber plantations can be seen in Subfigures 9 and 11–13. Although southwestern Cambodia has been partially preserved thus far, as in the Cardamom mountains that constitute one of the last remaining natural forests in southeast Asia, Subfigure 10 shows that forest loss occurs in this region.
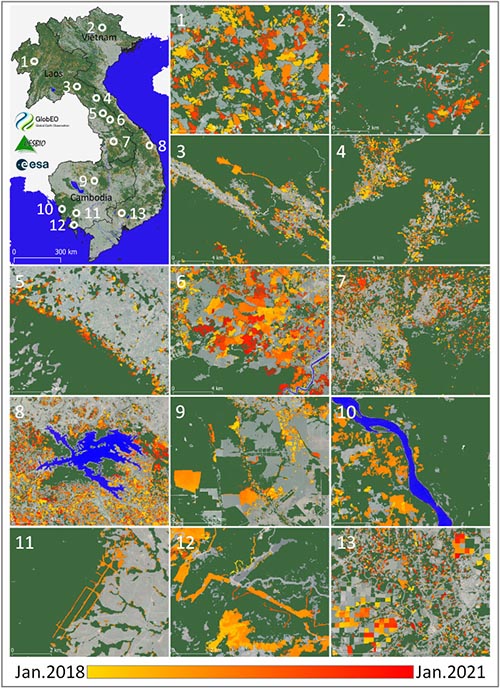
Mapping deforestation in Vietnam, Laos and Cambodia based on Sentinel-1 data. © GlobEO
The temporal distribution of detected forest loss over Vietnam, Cambodia, and Laos from January 2018 to July 2021 is shown in the Figure below. Forest loss is detected throughout the year in Vietnam, with an expected and systematic peak of losses occurring during the dry season between December and April in the three countries. Note that this finding may be exacerbated by the fact that soil moisture can lead to an underestimation of forest loss. During the wet season, the amount of forest loss is higher in Vietnam whereas during the dry season, the amount of forest loss is higher in Laos.
Estimated monthly logging area in Vietnam, Cambodia and Laos, January 2018 to July 2021. © Globeo
References
| TropiSCO on GEO Knowledge Hub, a long lasting digital repository created by the Group on Earth Observations: https://doi.org/10.60566/f14we-8tq13 |
- FAO. 2020. Global Forest Resources Assessment 2020 - Key findings. Rome.
- Guégan, J.-F., Ayouba, A., Cappelle, J., Thoisy, B. de, 2020. Forests and emerging infectious diseases: unleashing the beast within. Environ. Res. Lett. 15, 083007.
- Hansen, M.C., Potapov, P.V., Moore, R., Hancher, M., Turubanova, S.A., Tyukavina, A., Thau, D., Stehman, S.V., Goetz, S.J., Loveland, T.R., Kommareddy, A., Egorov, A., Chini, L., Justice, C.O., Townshend, J.R.G., 2013. High-Resolution Global Maps of 21st-Century Forest Cover Change. Science 342, 850–853.
Project news
🎥 23/06/2026: Presentation by the French Guiana Amazonian Park on its growing use of TropiSCO during the “Tropical SCOlutions” webinar (in French)
🎥 27/10/2025: Presentation of the TropiSCO project and its progress at the 2nd ClimateSCOpe “Eyes on the forests”
- 22/11/2024: Quantifying illegal deforestation in French Guiana: TropiSCO's invaluable help
- 01/11/2024: TropiSCO covers the Brazilian Amazon
- 01/10/2024: TropiSCO covers Thailand
- 09/03/2023: SCO at the One Forest Summit to present TropiSCO
- 30/08/2022: www.tropisco.org: follow tropical deforestation in real time
- 31/01/2022: European data at the heart of SCO projects, including a video on how the TropiSCO project uses Sentinel data
- 06/01/2021 : TropiSCO is making great strides