

SatLCZ

Identifying the vulnerability of urban environments during summer heat waves
Project completedThanks to the SatLCZ project, in 2025 CEREMA launched the LCZ portal for French urban areas with more than 50,000 inhabitants. This portal makes it possible to estimate and visualise the vulnerability of urban areas to heat waves and thus support strategies for adapting to and mitigating these phenomena.
The project has developed a methodology for classifying Local Climate Zones based exclusively on very high-resolution satellite images. The application's coding is open source and can be transposed to any city
OVERVIEW
The project uses very high resolution (VHR) satellite imagery from the Pleiades mission. Using a detailed description of the urban fabric, the aim is to implement a reproducible methodology to develop indicators based on the Local Climate Zone (LCZ) concept developed by the international urban climatology community [Stewart & Oke 2012]. Reproducible in any city, this method segments areas into homogeneous elementary typo-morphological units based on their climatic behaviour. The project’s objectives relate to the vulnerability of the urban environment during summer heat waves, as well as to local efforts to adapt and attenuate heat peaks through better urban design. Identifying LCZs involves producing geographical layers describing urban morphology (four indicators) and land use (three indicators). A study [Leconte et al. 2018] shows that the intensity of the heat island and these indicators can be correlated to the surface scale of the LCZ.
To better support public planning policies in their fight against the urban heat island phenomenon, LCZ mapping can deliver underlying indicators such as imperviousness and vegetation rates but also, when sufficiently fine data exist, a socio-economic vulnerability index.
Validated and internationalized methodology
The project follows up the DIACLIMAP project financed by the ADEME (French environment and energy management agency) between 2015 and 2017 on the Greater Nancy metropolis, SatLCZ demonstrates that the use of VHR imagery makes it possible to produce and update LCZ indicators for any type of urban fabric, with or without such rich geographical databases as those in France. Indicators are calculated using 3D frames with layers of “impermeable surfaces” and “permeable surfaces” taken from the imagery as well as a digital surface model also taken from satellite imagery.
In the first instance, this method will be applied to the area of Greater Lille which experienced a heatwave with temperatures of over 41°C in 2019. This territory having allowed to validate the results, the project has in the second instance integrated a city on a foreign territory, in this case Rayong (Thailand), confirming the transposability of the method.
Application site(s)
- Lille, France
- Rayong, Thailand
DATA
Satellite
- Pleiades
Other
- Digital Terrain Model
- Land use map
- Classification in Local Climate Zone
- CopernicusUrbanAtlas Classification
RESULTS - FINAL PRODUCTS
-
LCZ app freely accessible on the CEREMA Cartagene portal with LCZ maps of French urban areas with more than 50,000 inhabitants
-
Final report describing the methodology and main results (in French, available for download in the Resources section below)
-
Source code on CEREMA's GitHub
-
Outputs during project development:
👉 LCZ classification in shapefile format for Lille and Rayong
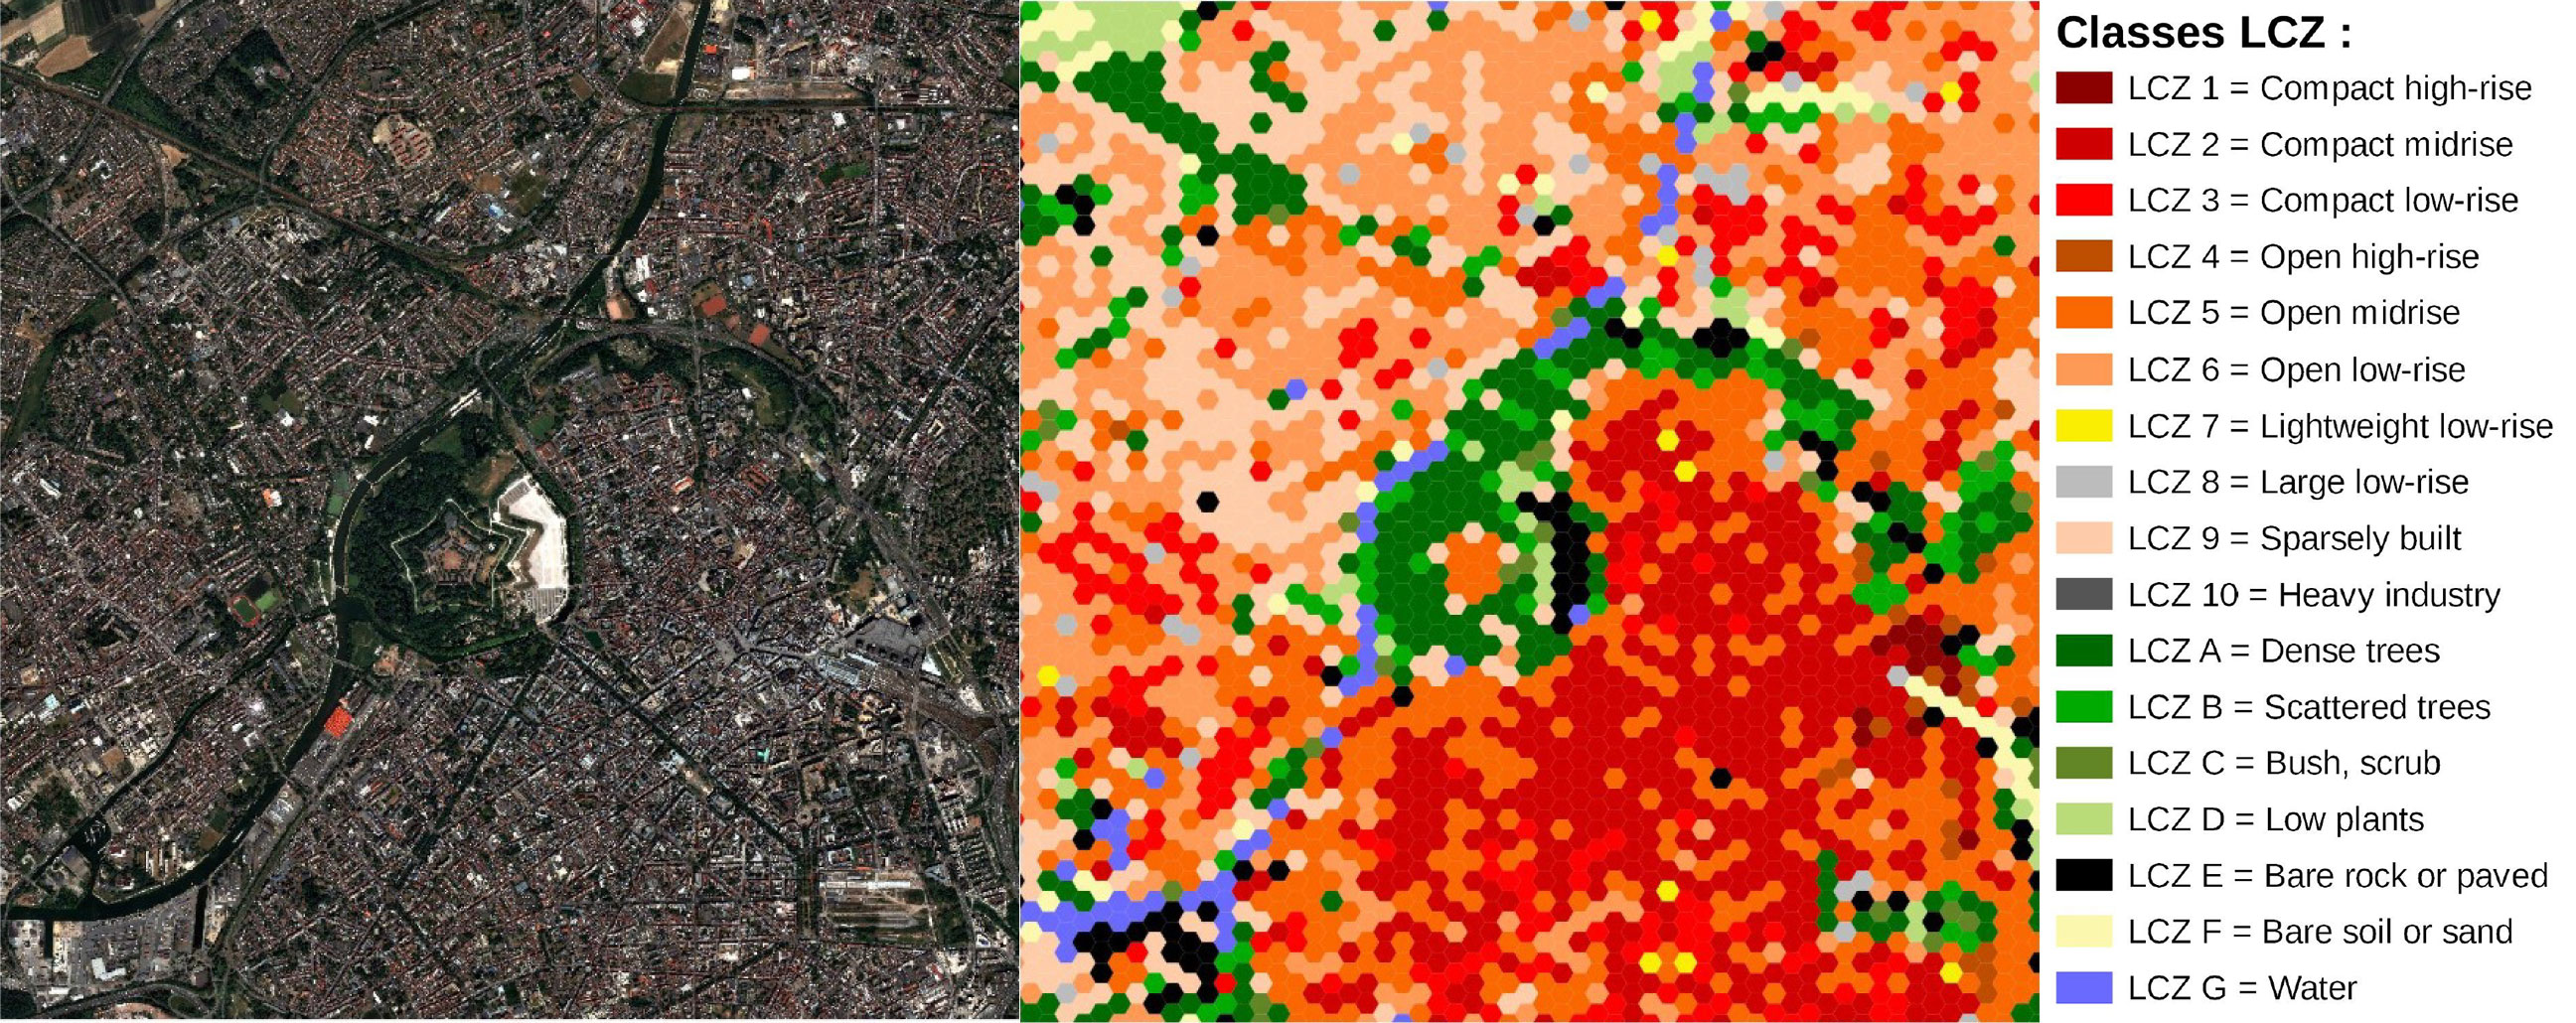
Pleiades satellite image of Lille (left) and associated LCZ mapping (right).
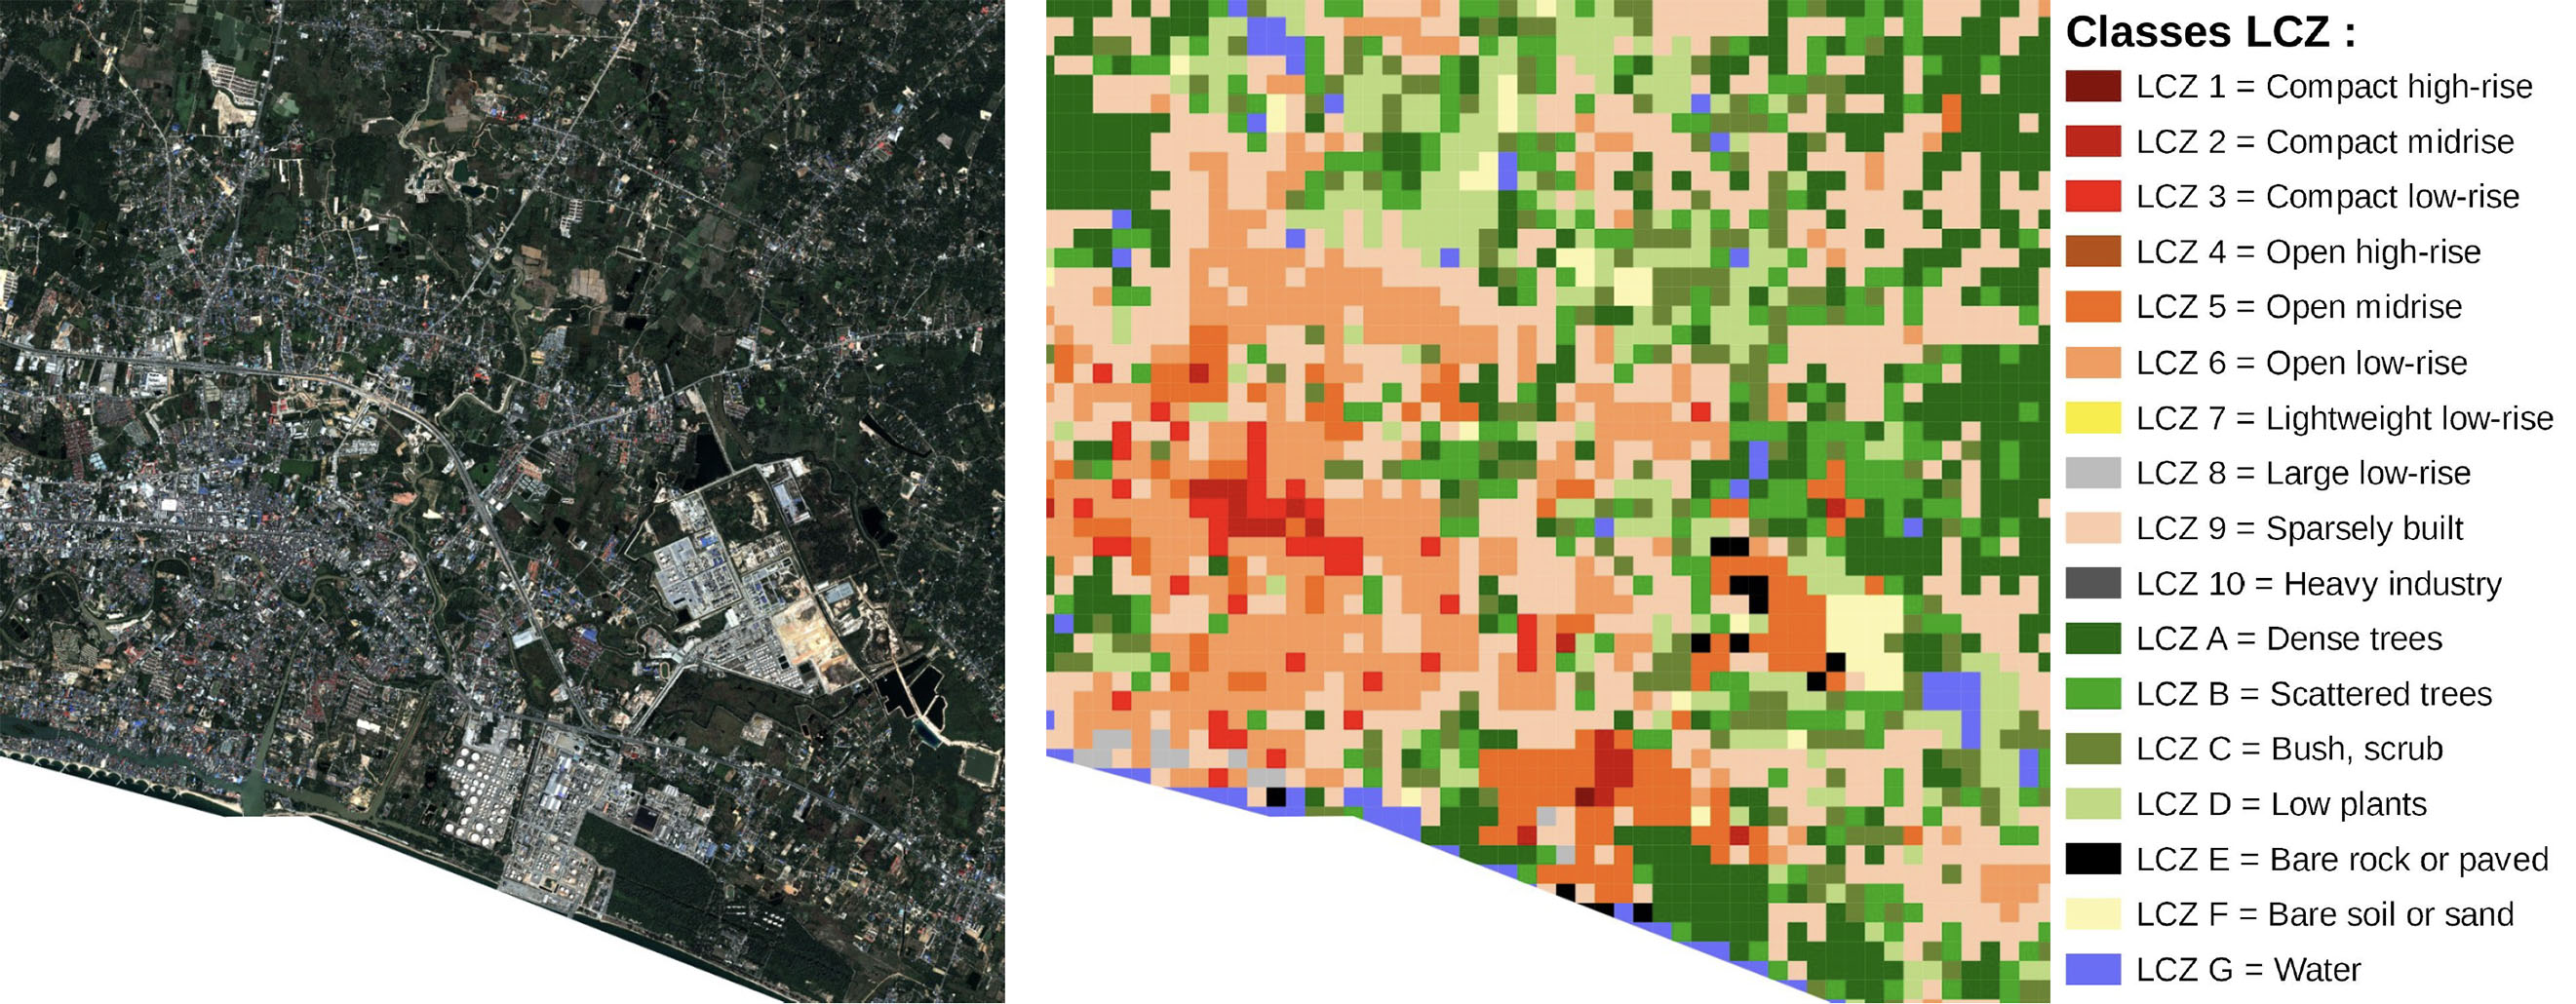
Pleiades satellite image of Rayong (left) and associated LCZ mapping (right).
👉 Indicators of imperviousness rate and vegetation rate in Lille
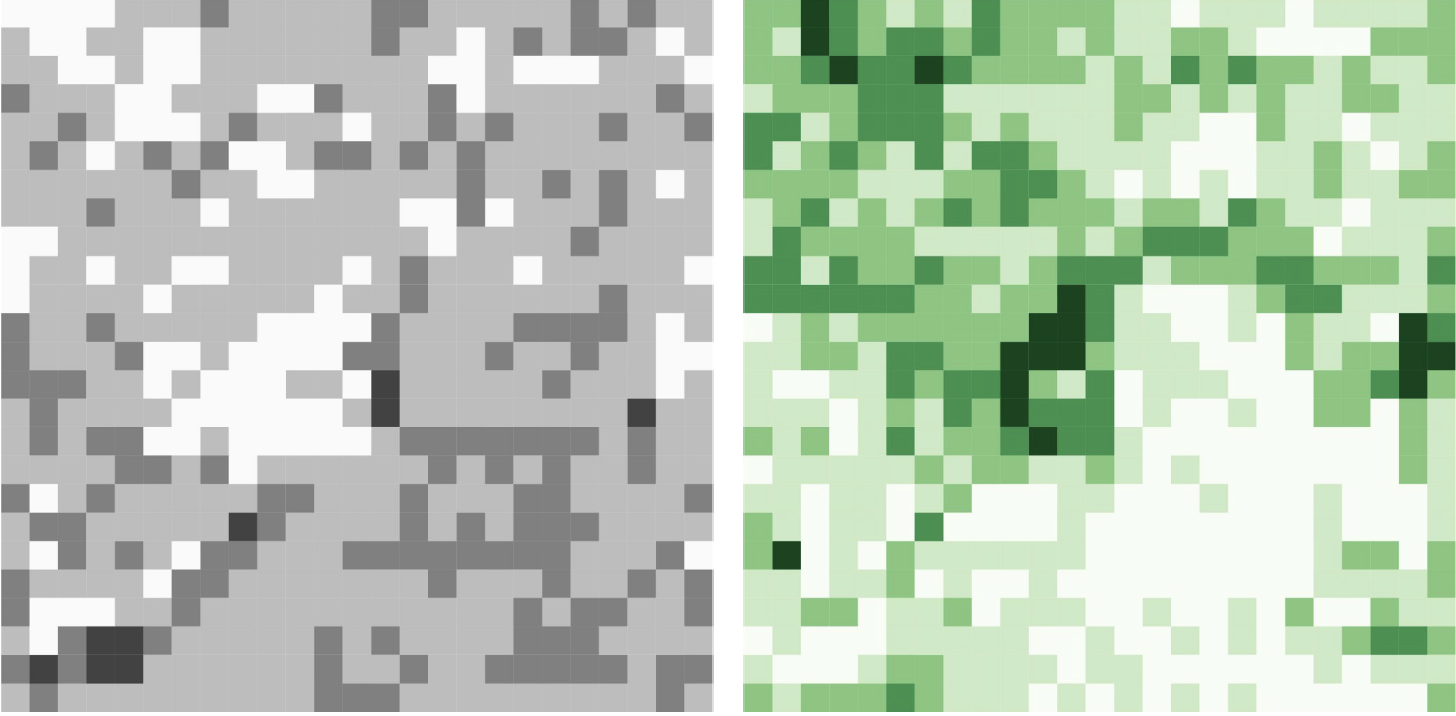
Lille: Indicators of impermeability rate (left) and vegetation rate (right), two potential levers to reduce the impact of the UHI phenomenon. Indeed, on the one hand, removing the impermeability of soils allows to reduce the storage of heat during the day (by the nature of the materials) and to reduce its release at night. On the other hand, the vegetation allows a cooling of the ambient air, by the phenomenon of evapotranspiration
👉 Socio-economic vulnerability index in shapefile format for Lille
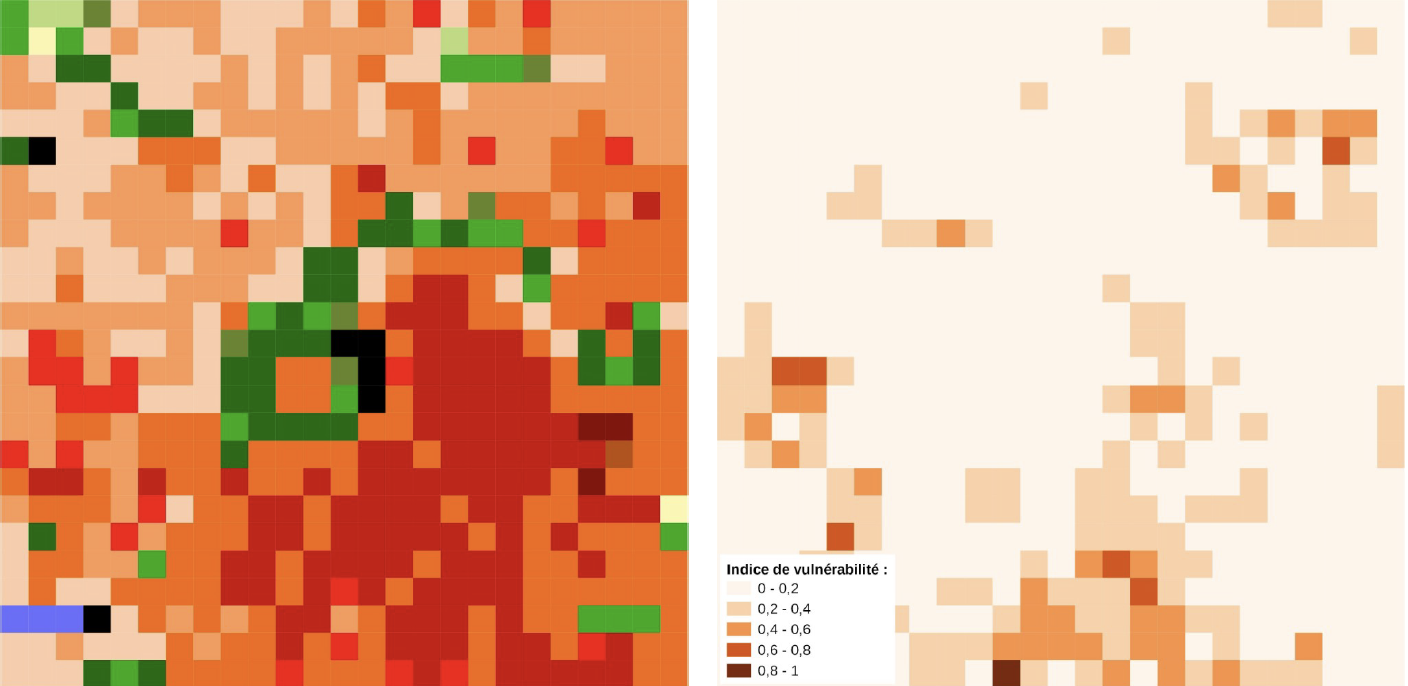
Lille: LCZ mapping (left) and socio-economic vulnerability index (right) from INSEE data (health index of people with poorer health and social index of poor households). In this example, we note a potentially increased risk for people living in the south of the zone: set of polygons classified as LCZ 2 and 3, and high vulnerability index.
=> Shapefile files for Lille and Rayong are available for download in the Resources section below.
References
| SatLCZ on GEO Knowledge Hub, a long lasting digital repository created by the Group on Earth Observations: https://doi.org/10.60566/1dgxb-0zy20 |
Related SCO projects
Project News
-
09/10/2025: SatLCZ has given rise to the Local Climate Zone Mapping portal in France
-
2024: The LCZ mapping produced for the Greater Nancy Metropolitan Area has been used as input for the SCO Green Urban Sat project.
-
09/06/2021: Video (YouTube, in French) SatLCZ, THR optical imaging to identify local climate zones: extract from the First Quarterly of the SCO France, where the project is presented under the angle "use of satellite data" followed by a progress report.
- 21/12/2021 : The SatLCZ tool is operational, a cross interview of the three partners Cerema, Airbus DS GEO and CNES