

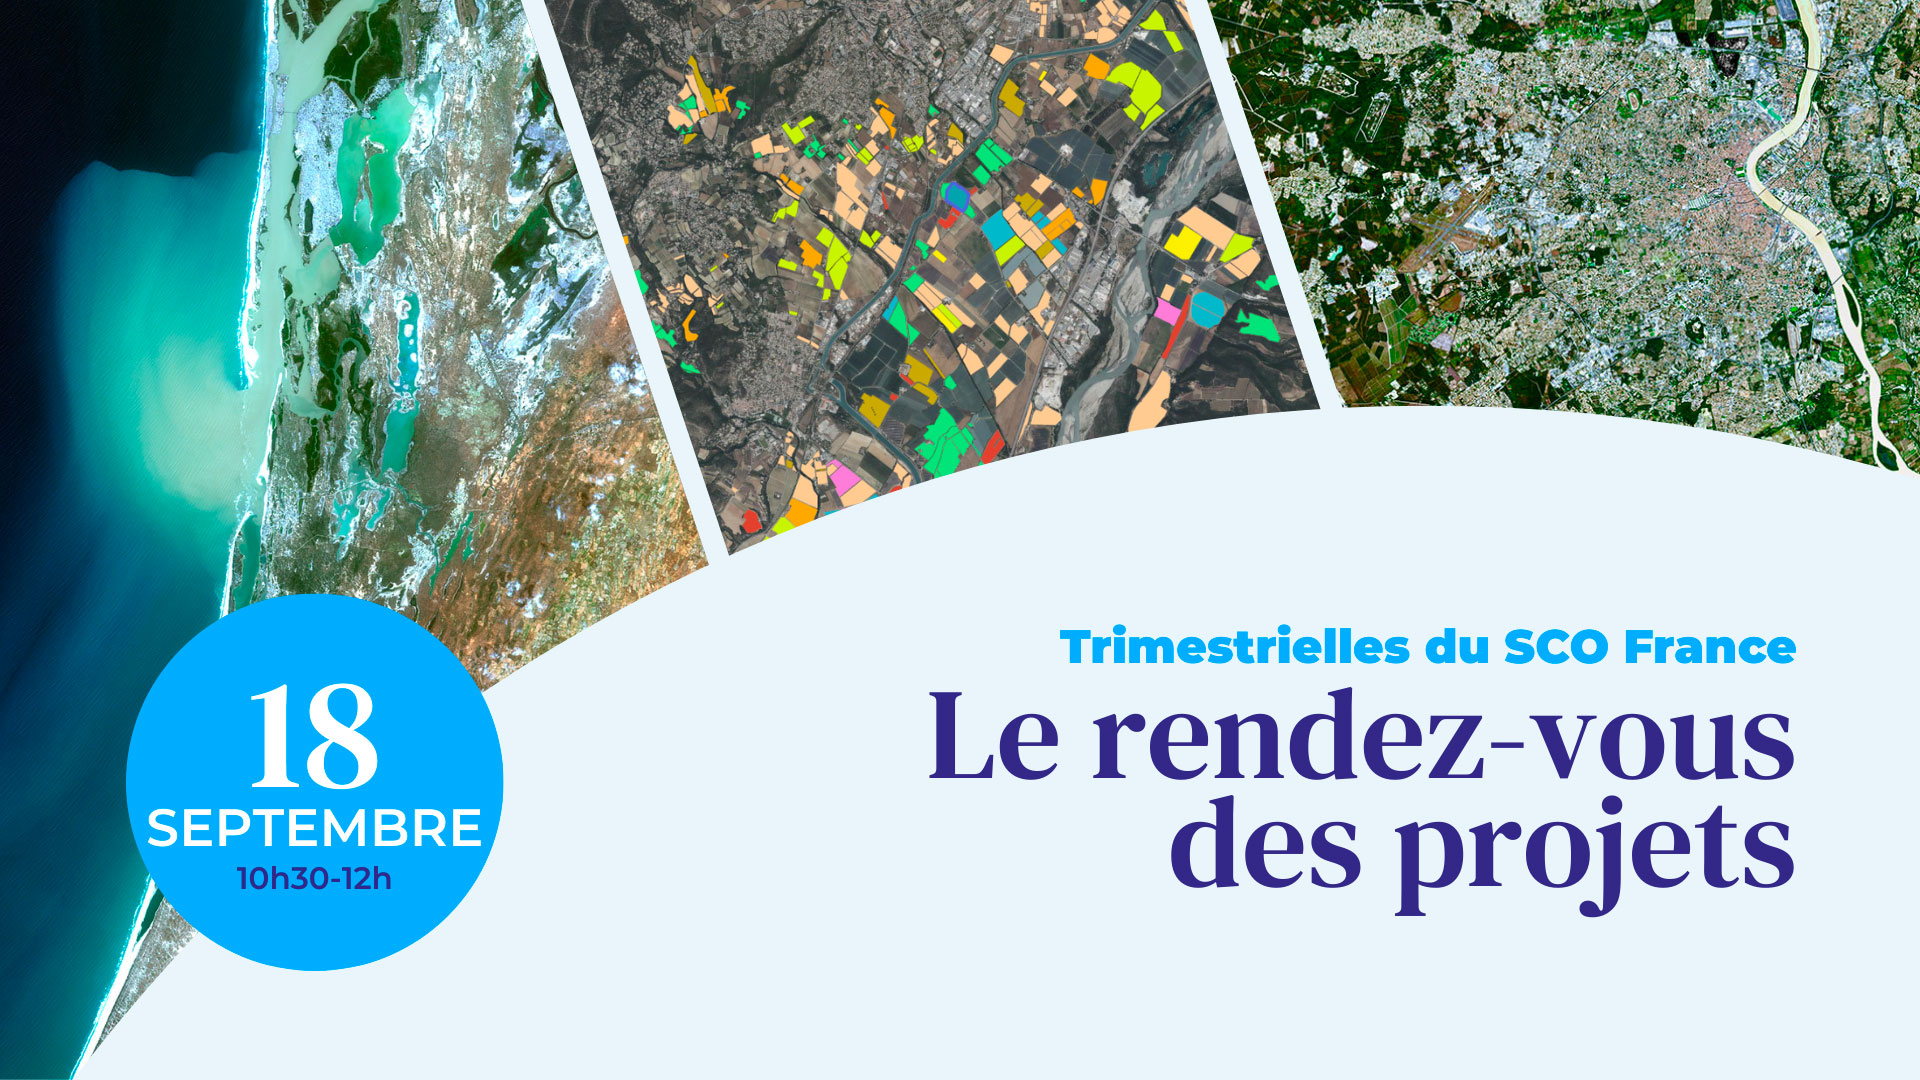
18th Quarterly Meeting of SCO France
Heat records are being broken year after year, and now month after month. In their wake, all territories have no alternative but to adapt: here to better manage water resources that are becoming scarce but which crops need to grow, there to lower the thermometer that is exploding in certain urban neighbourhoods, or even to compensate for the rise of the ocean that is eroding coastlines and their infrastructure.
On Thursday 18 September 2025, during the 18th Quarterly Meeting of SCO France, three SCO projects demonstrated how they use satellite data to design tools that will enable cities and regions to plan, design and implement adaptation strategies.
Preamble: the International Charter on Space and Major Disasters
By Émilie Bronner, CNES representative to the Charter's executive secretariat
|
An iconic space service dedicated to humanitarian aid, the International Charter on Space and Major Disasters brings together 17 space agencies which, free of charge, mobilize their satellites to provide images and maps of major disasters as quickly as possible to help organize relief efforts. With nearly 1,000 activations in 143 countries, it bears witness to the consequences of climate change, with the number of disasters skyrocketing in recent years. 75% of activations concern hydrometeorological phenomena. |
Operational for 25 years, CNES, which founded the organization with ESA, will hold the rotating presidency from October 2025 to April 2026. |
By Rafael ALMAR (IRD) and Christophe Brière (EGIS)
|
A collaboration between the worlds of research and engineering, WACA-VAR is the space component of the World Bank's WACA programme. It uses satellites to provide reliable, accessible and up-to-date data on coastal dynamics in West Africa in order to improve management and resilience to the effects of climate change.
|
|
To remember
- Various public and private satellites used to test different sensors: Sentinel-2, Venµs, Pleiades and Pleiades Neo, satellite video (JILIN, Satellogic, Planet).
- The project works on two scales:
- Construction of a regional coastal vulnerability indicator to better guide action, enrich field data, or even replace it in areas that are difficult to access.
- Application to the design of engineering structures (particularly coastal defenses) at the local level by producing a detailed cartographic atlas of coastal bathymetry.
- All this data, interactive maps and derived indicators will be pooled and made available on a web dashboard currently under development.
- The tool will be reproducible on an international scale.
💡 WACA-VAR in the field – 2 July 2025
By Virginie Dahinger (MEOSS)
|
Building on the experience of several previous initiatives supported by the SCO, EO4AgriWater is making concrete progress in answering a complex question: how can we better understand, locate and anticipate water resources in a changing climate? Testing the use of satellite data in two very different territories (France and New Caledonia), the project automates the production of key indicators in terms of irrigation and drought.
|
|
To remember
- Satellites used: Sentinel-1 (radar), Sentinel-2 (optical), LandSat 5 to 9 archives (optical) and MODIS (thermal) over more than 20 years.
- Data usage:
- Automatic classification of crop types and irrigation (irrigated/non-irrigated plots).
- Monitoring of drought and anomalies at 500 m (MODIS) and 10 m (LandSat and Sentinel-2).
- Monitoring of water surface areas.
- Calculation of a summary indicator (territorial vulnerability).
- Project users have secure access to the results on MEOSS's Meo-Water Irrigation platform.
- Next steps: integrate groundwater resources and develop the calculation of super indicators.
By Basile Goussard (NetCarbon)
|
Are urban development projects compatible with a future at +4°C? This is the question all cities are asking themselves in the face of climate change. Target 2050 helps them answer this question and ensure that their projects are aligned with the national low-carbon strategy for 2050. 💡 The live demonstration of the developed application is surprisingly clear and precise!
|
|
To remember
- Satellite data: very high resolution Pleiades (+ IGN orthophoto) to establish land use, and C3S ERA5 data for temperature monitoring.
- For a project in a specific location:
- The system establishes an inventory of land use and temperature.
- By entering the project characteristics (number of trees planted, type of surface treatment applied, etc.), the app simulates the impact of these developments over 25 years and assigns a score based on three indicators: artificialization, carbon stock and temperature. It is then possible to duplicate this simulation to modify the planned actions (more trees, etc.) and compare the scores.
- The NetCarbon team is consolidating its method to automate project improvement.
If you have any questions about this quarterly report, please write to us here.