

SCO
France
18
CIO member organisations
93
Participants logged in
Organiser
SCO France
Next SCO France meeting
Autumn 2020
Keywords
SCO France, FloodDAM, LittoSCOpe, SatLCZ, wind energy
SCO France: time for action!
SCO France can take pride in the considerable work it has accomplished in the year that has passed since the Space Climate Observatory was officially launched at the Paris Air Show by President Macron.
The aim of the webinar was to present the first 14 certified projects and to spark the community’s interest in future projects. As a preamble to these presentations, Brune Poirson, Secretary of State to the French Minister for Ecological and Inclusive Transition, thanked the French community for its commitment to the Space Climate Observatory, "an unprecedented project. There will be many opportunities to develop tools in the circular economy."
All of these projects, as well as those put forward by members of SCO International, will be presented by the French delegation at the next One Planet Summit, to be held on 11 January 2021 in Marseille during the World Conservation Congress.
SCO France’s projects
FLAude, FloodDAM, Viettro et Vimesco Rice, Carbon Monitor, SatLCZ, Thermocity, ECLAT, Énergie éolienne, LittoSCOpe, Arbocarto et Mangrove. Using videos or live explanations, several project leaders showed how sharing space data can give rise to efficient tools. Here are some examples from the projects discussed today.
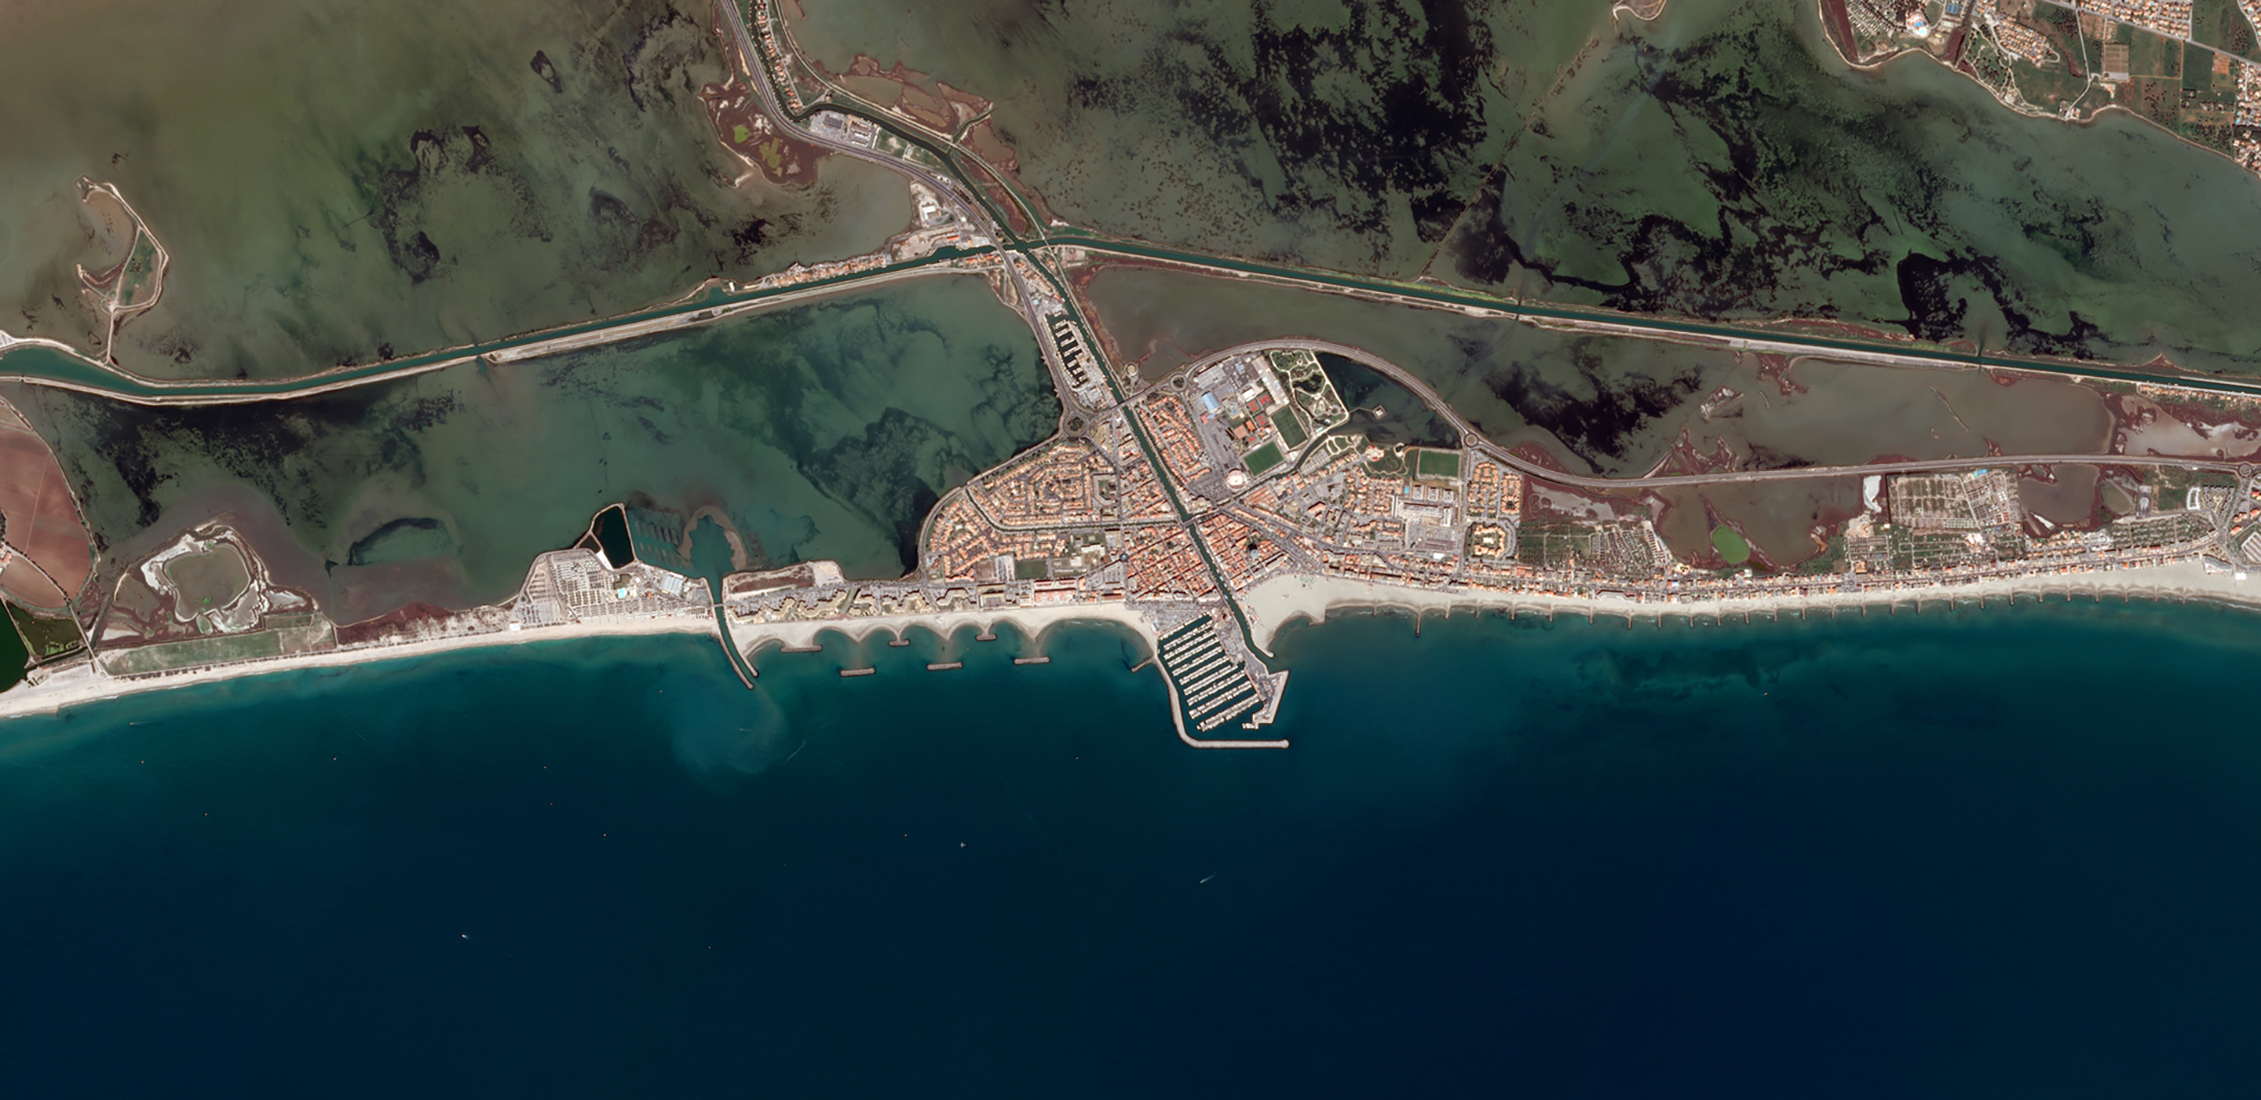
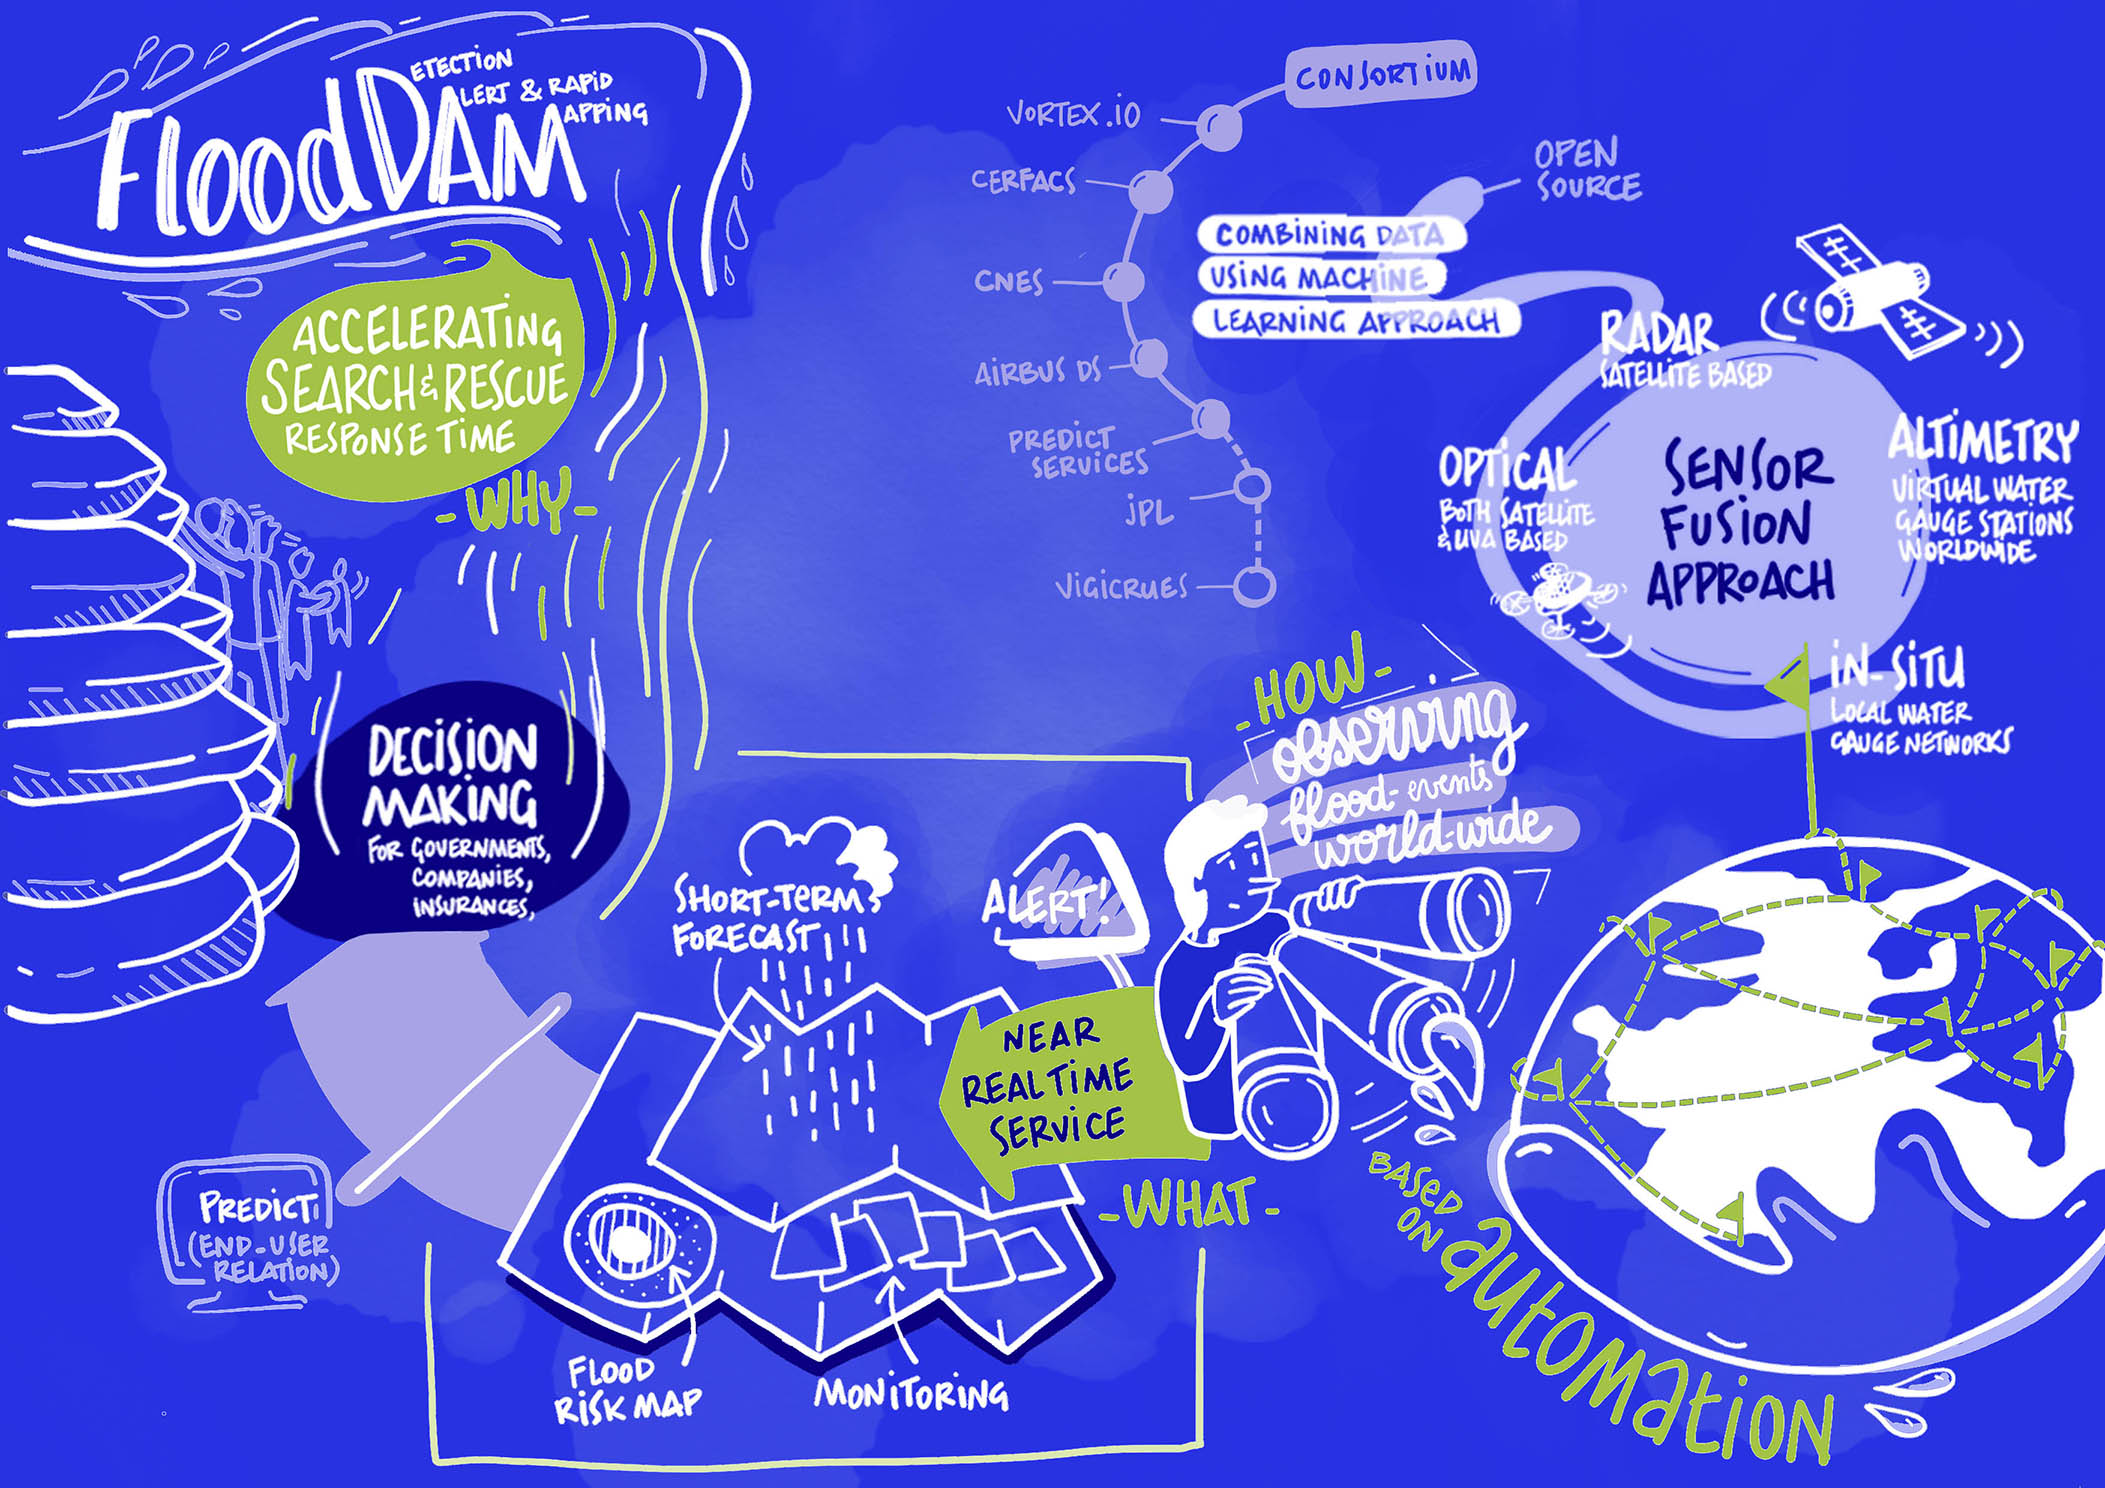
- FloodDAM: cstanding for Flood Detection Alert & rapid Mapping. As its name suggests, FloodDAM aims to speed up the response time following floods to help local authorities and insurance companies make decisions in these times of crisis. FloodDAM offers three services: a warning system to warn the relevant parties of an imminent flood, real-time flood modelling to get an idea of the situation on the ground, as well as forecasting of short-term developments modelled with risk maps using several fluid dynamics models. The involvement of a large French consortium has allowed the project to be developed using spatial imaging data, paired with data from in-situ networks taken from numerous airborne sensors and sensors on the ground. Note the participation of the American Jet Propulsion Laboratory, which is already carrying out work on these ground station networks. Collected using a fully automated method, all this data is combined using machine learning techniques and data assimilation.
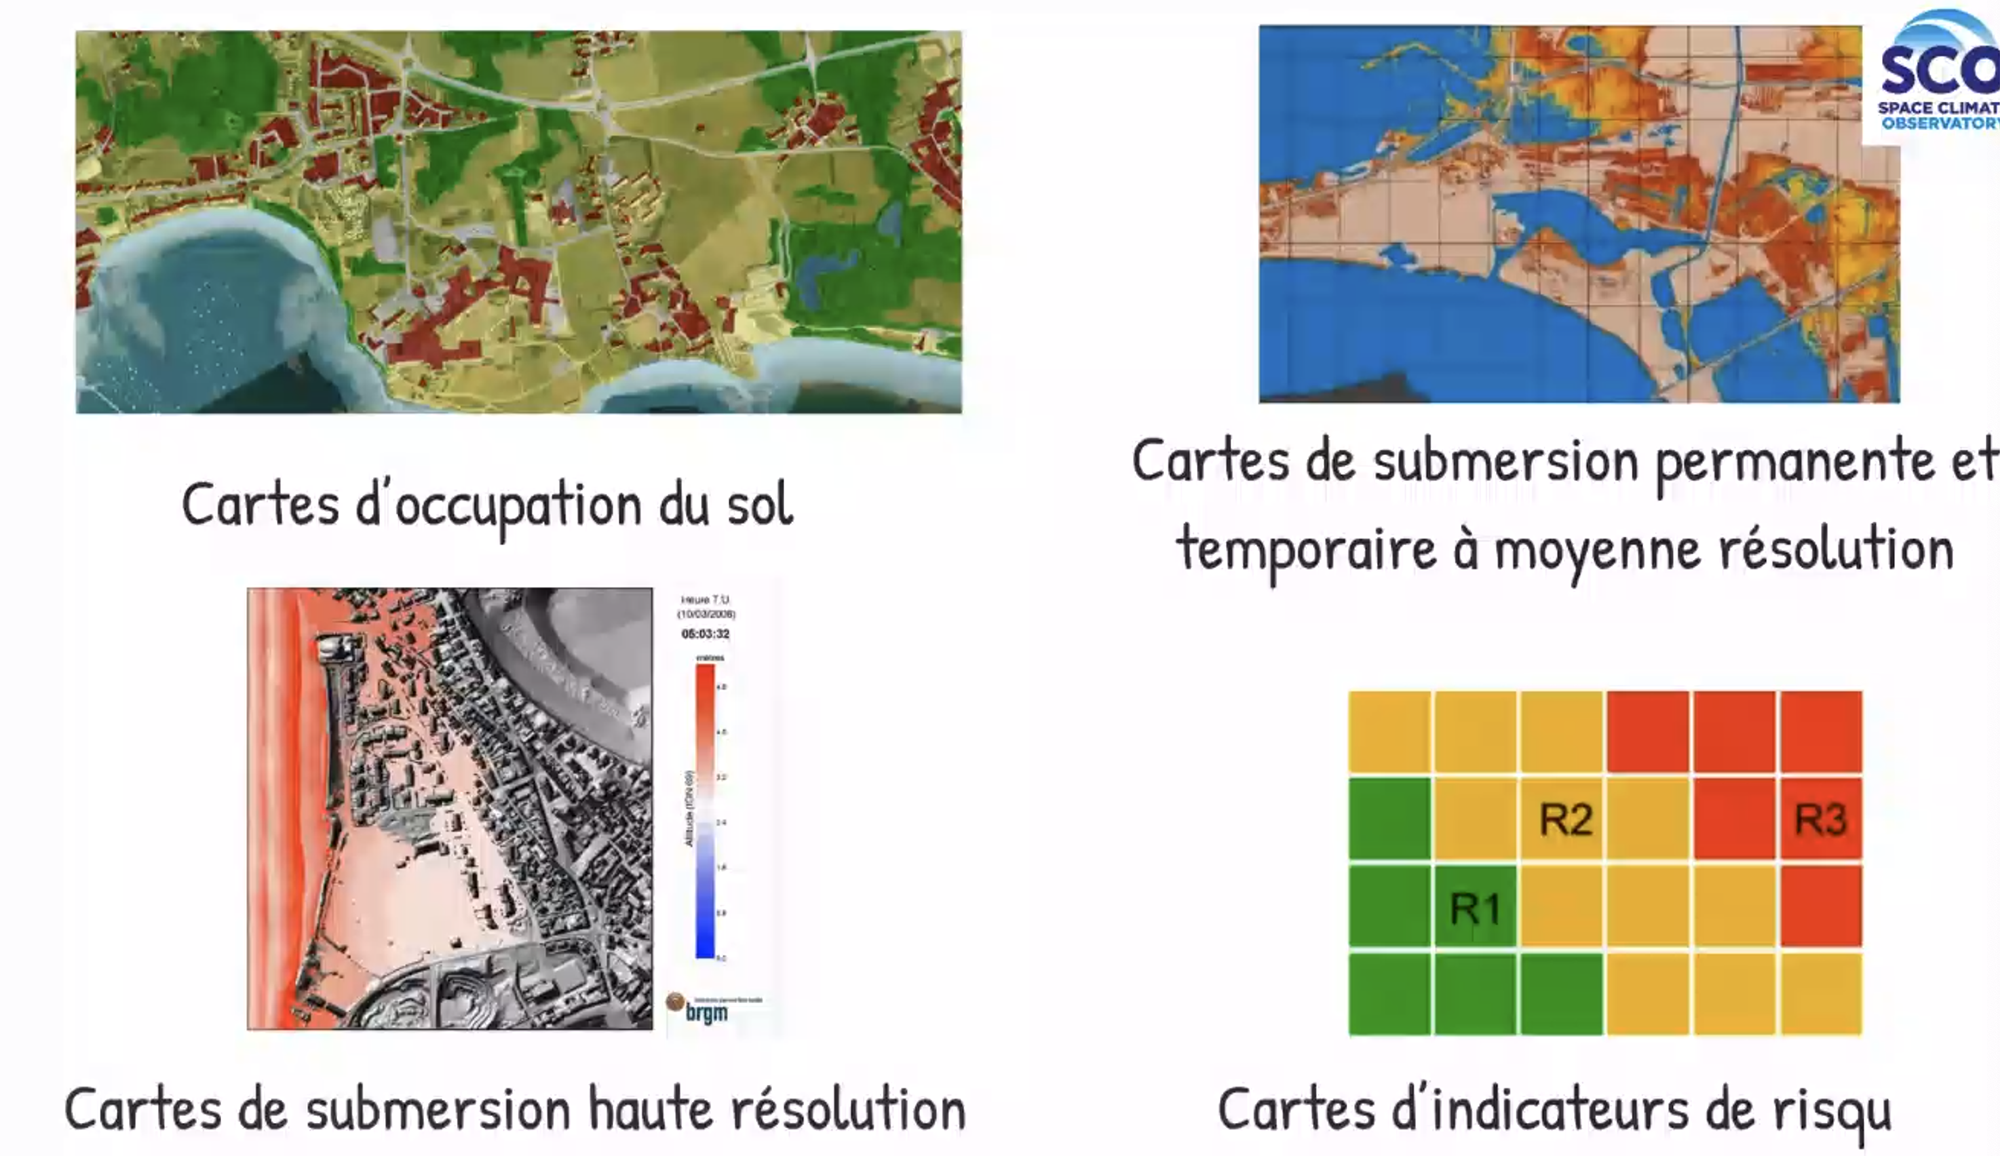
- To deal with a similar risk, though not caused by rain, the LittoSCOpe project focuses on the risk of coastal flooding caused by rising sea levels. Tested in the French towns of Palavas-les-Flots, Montpellier and Gâvres (near Lorient), the tool helps to identify coastal areas susceptible to permanent flooding. To do so, it uses a DTM (Digital Terrain Model) derived from Pleiades observation data as well as spatial altimetry data for determining sea levels. By incorporating socio-economic data and more detailed information about land cover, the tool produces intuitive risk indicators so as to provide a quantified assessment of the level of crisis involved, coupled with an estimate of the potential costs and damages if flooding were to occur.
- After water comes air. SatLCZ addresses the vulnerability of urban environments to summer heatwaves. It studies urban heat islands and models the thermal behaviour of spaces according to the various levers available, such as vegetation. Segmenting the territories into homogeneous typo-morphological units with respect to their climate profile, the methodology is based on Pleiades imagery, allowing for stereoscopic observation of cities. SatLCZ, which can be applied around the world without any prerequisites, is initially being used in Lille, which experienced an intense heatwave in 2019, so that the spatial methodology can be validated through comparison with field data. At a later stage, it will be tested abroad.
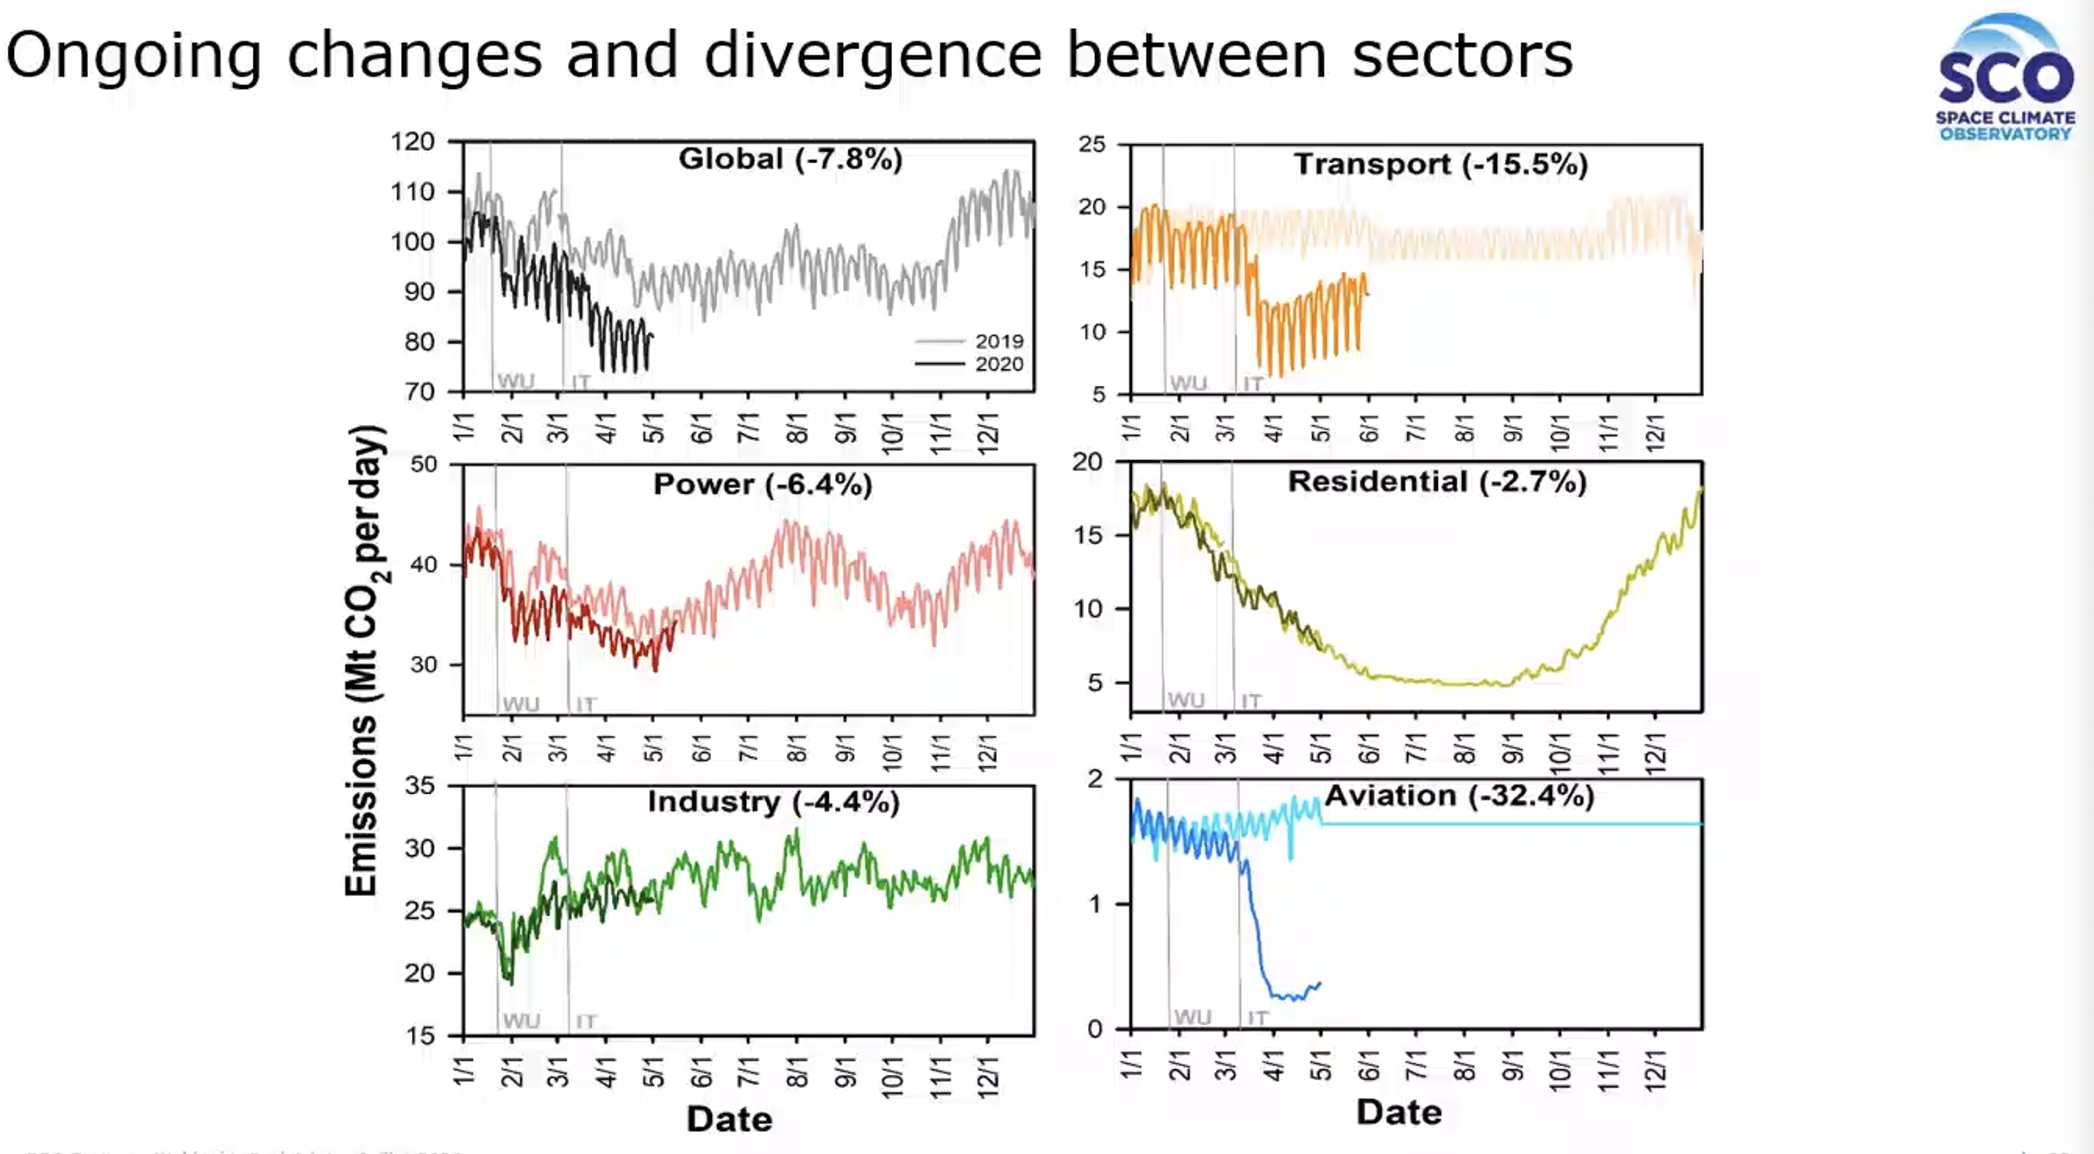
- Designed for monitoring C02, Carbon Monitor is highly relevant in our current context. Though the Covid-19 pandemic is having a massive global impact on human activities and consequently on their CO2 emissions, Carbon Monitor reveals that, in China, these emissions have picked up again in earnest, reaching levels 10% higher than in the same period last year. While it offers significant added value for monitoring the post-Covid recovery, the tool clearly highlights the crucial need to monitor climate policies and the associated economic impacts in a similar way, by monitoring CO2 emissions much more closely than every two years (for Kyoto Protocol signatories) or every five years (for other countries). How? By gathering data, mostly in real time, on sectors producing CO2: industrial production, electricity, road, maritime and air traffic, the housing sector, etc. Models convert this activity data into CO2 emissions, from which a daily index for each source of CO2 emissions in each country is derived. This helps to identify increases and decreases in emissions by country and by sector, and correlates these with an event, such as Covid or a holiday period. The tool also works for methane. Close international collaboration between universities in France, China and California has resulted in a particularly effective processing chain, meaning the Carbon Monitor tool is available online, in both international and Chinese versions.
- Wind energy. This project does not have a name yet, but it’s a promising sign, given the goal of reaching 40% renewable energy by 2030. In an original approach, it characterises the wind energy available in France in order to set operating objectives by geographical area, with support from residents. To characterise the wind power potential in France, the tool uses C3S and ERA5 data on wind speed. It calculates the energy available from a wind turbine, depending on that wind turbine's characteristics, and this, combined with its actual use, reveals how each département uses its wind power potential.
It remains to be seen how people will feel about this technology. As the Covid-19 health crisis has disrupted field investigations, project leaders have turned to a population-based approach using social media. 5,000 posts containing #windturbine were tracked down and the text was then analysed to identify the sentiment expressed and to ultimately establish a "score" for each French département. The tool is already highlighting geographic areas that could expand their wind power policy, such as Bouches-du-Rhône, where the usage rate stands at 1 compared with a median level of 2.83 in France, and where the public’s sentiment was detected as being reasonably positive.