

Applications Toolbox
Below are the tools developed and delivered by the SCO projects.
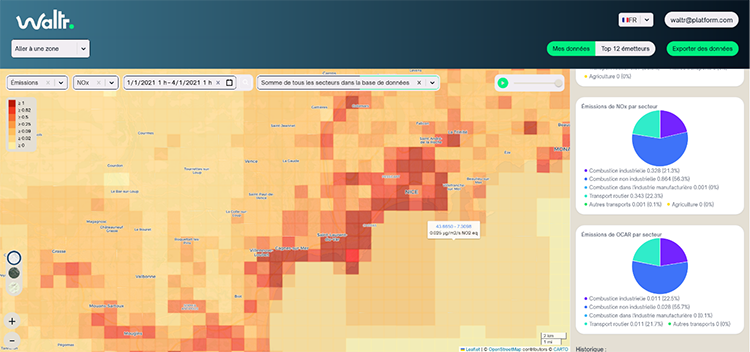
Dynamic inventory of atmospheric emissions
Developed as part of the EDISON project, the GEMS platform enables users to visualize, analyze, and take action regarding emissions of CO₂, NO₂/NOx, and fine particulate matter (PM2.5, black carbon, organic carbon). Hourly emissions mapping, location and temporal tracking of major sources and hotspots, simulation of the impact of public policies (traffic restrictions, boiler conversions, etc.), and comparisons between regions: its various functions make it a powerful tool for identifying concrete levers for reducing emissions, tailored to local specificities. GEMS is easily adaptable for international use.
🔵 Commercialized service
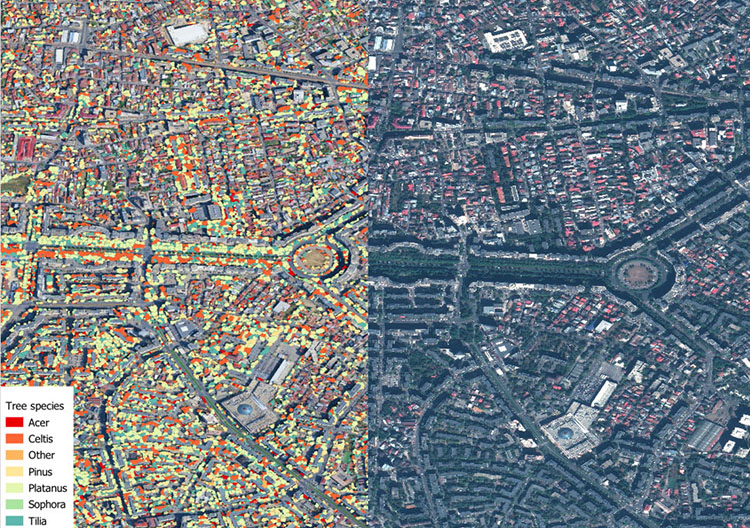
Satellite mapping of green spaces for green and healthy citiesImplemented in five European cities, the GreenSpace service combines satellite and scientific data to create a comprehensive inventory of public and urban tree populations, realistically quantify the removal of key air pollutants and greenhouse gases by these trees, and provide recommendations on the best species to plant. It thus enables cities with at least 20,000 residents to develop ambitious greening plans in response to environmental guidelines.
🔵 Service marketed by ACRI-ST
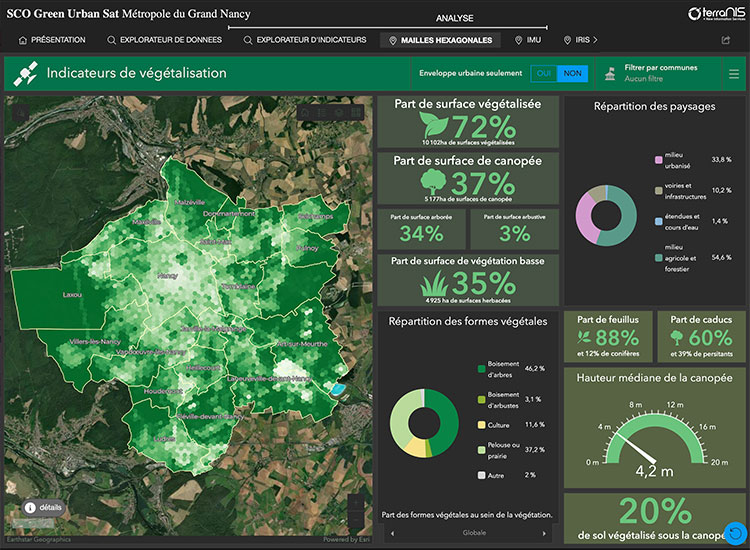
Supporting solutions based on urban vegetation
Supported by Cerema, the GUS project has developed a method for fine mapping urban vegetation in order to better assess its many ecosystem services. The results obtained in Greater Nancy are available online on the Landia platform (ex Green City) operated by TerraNIS. This platform offers summary indicators at different grids (hexagonal, urban morphological island, IRIS, municipalities, etc.), data explorers and summary dashboards.
🟢 Access to the Nancy demonstrator is open.
🟢 Based almost entirely on THR satellite images, the method can be replicated for any town => the algorithmic codes are available on Cerema's Github.
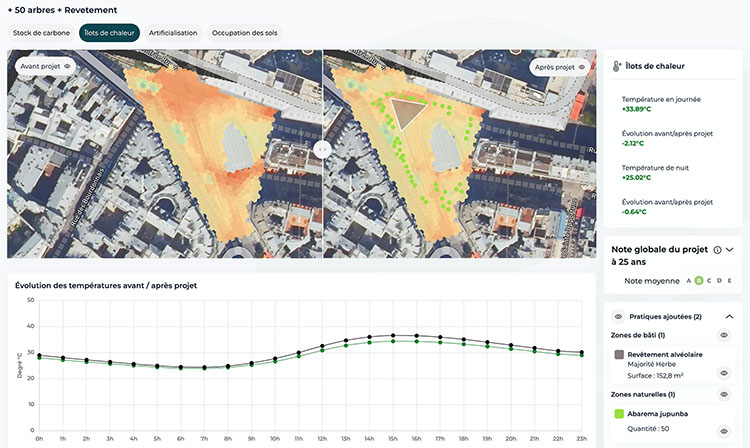
Building tomorrow's developments today
Developed as part of the Target 2050 project, the Netcarbon application is designed for local authorities and developers who want to assess and optimize the climate performance of their development projects. Thanks to a simple rating system, the solution enables the design of projects aligned with France's 2050 targets in terms of carbon neutrality, zero net land take (ZAN), and heat resilience.
🔵 Service marketed by Netcarbon
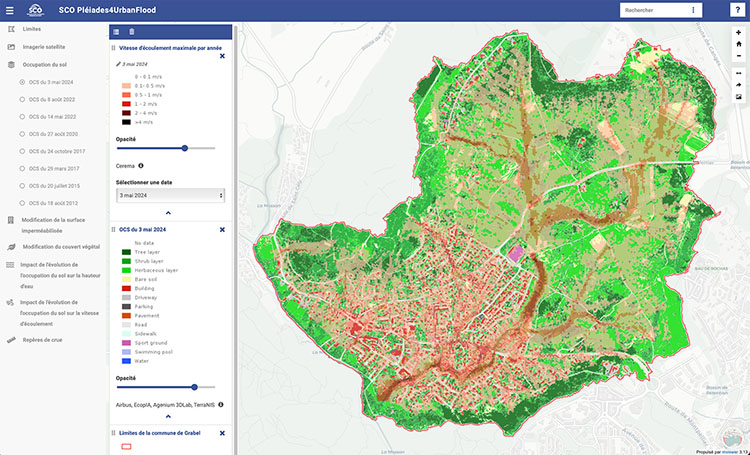
Automated hydraulic modelling
Using very high-resolution monoscopic images from Pléiades and Pléiades Neo satellites, P4UF automatically maps land use (LULC). By applying its integrated hydraulic modelling chain, the application estimates flood risk (water height and speed) and characterises its evolution, taking into account the urbanisation context and climatic events such as droughts or fires. The results are transferable and relate to the Grabels study site (France) for the period 2012-2024.
🟢 Open access
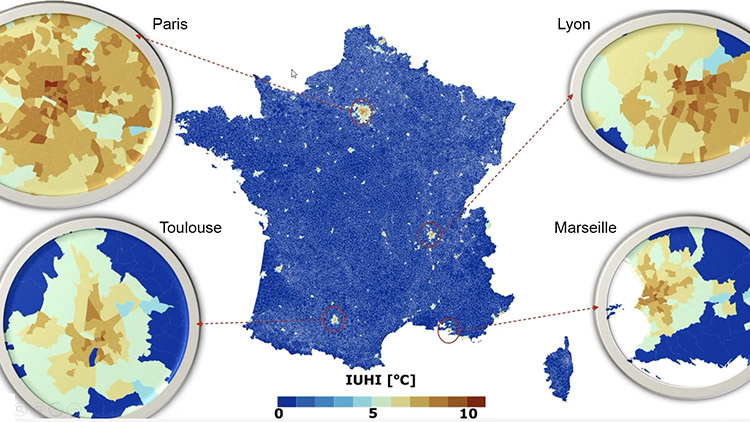
Urban overheating indicators
The Sat4BDNB project has made it possible to quantify the urban heat island (UHI) effect on the scale of metropolitan France, and to derive 4 decision-support indicators linked to urban overheating:
- Mitigation strategies index
- Investment cost index
- Mitigation effectiveness index
- Population heat vulnerability index
🟢 The data is freely available on data.gouv.fr and, from April 2025, in the French national building database BDNB
🟢 The project has also operationalized albedo production on a national scale, the collection is freely available on Theia.
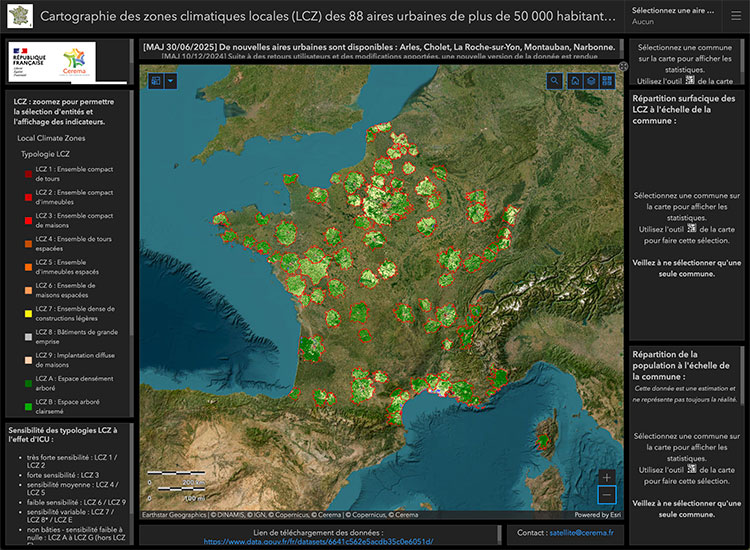
Identifying the vulnerability of urban environments during summer heat waves
The project has developed a methodology for classifying areas into Local Climate Zones based exclusively on very high-resolution satellite images. As a result of this work, CEREMA has launched an online LCZ portal for French urban areas with more than 50,000 inhabitants. This portal makes it possible to estimate and visualise the vulnerability of urban areas to heat waves and thus support strategies for adapting to and mitigating these phenomena.
🟢 Cartagene LCZ portal with free access
🟢 The application's coding is open-source on Cerema's github and can be transposed to any city. Shapefile files for Lille and Rayong are available to download in the Resources section of the project page.
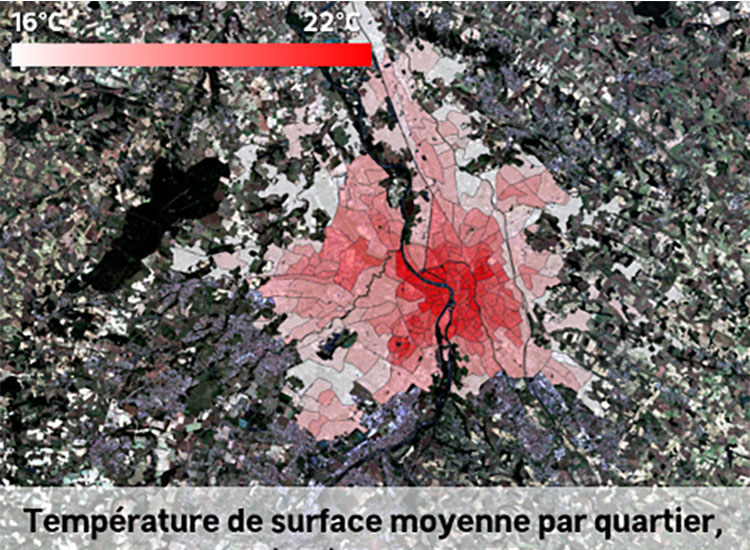
Thermography of cities from space
A pioneering project to learn how to use satellite thermal data in cities, Thermocity has delivered a collection of analysis-ready-data thermal images. This collection has been used to generate 4 major product families:
- Evolution of impermeability/artificialization and characterization of vegetation in the city;
- Detection and characterization of thermal anomalies;
- Mapping urban heat islands and diagnosing vulnerability to the associated heat ;
- Urban climate modelling: cross-validation and future climate.
🟢 Free access
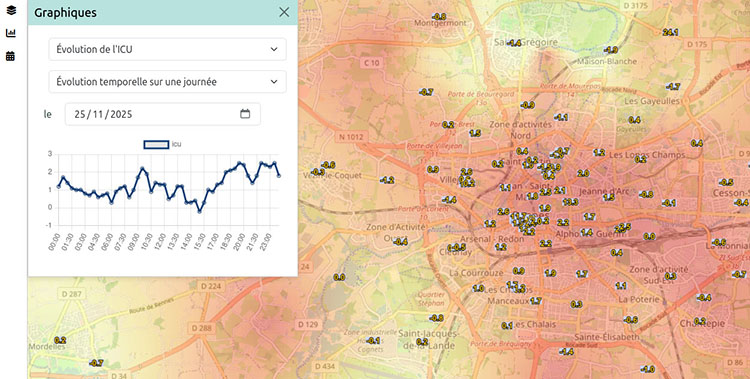
Real-time monitoring of urban heat islands
Implemented as part of the ALTELYS project, UrbaClim allows users to view air temperature and urban heat island intensity in real time by combining space data with data from connected sensors. Freely accessible and reproducible anywhere, the map visualization platform is suitable for a wide audience, while an “expert” mode provides access to specific metrics for users such as land managers. Designed as a participatory tool to support both adaptation and awareness-raising actions, each territory that uses it can integrate its information, such as articles.
🟢 Open access