

Applications Toolbox
Below are the tools developed and delivered by the SCO projects.
Monitoring territorial dynamics
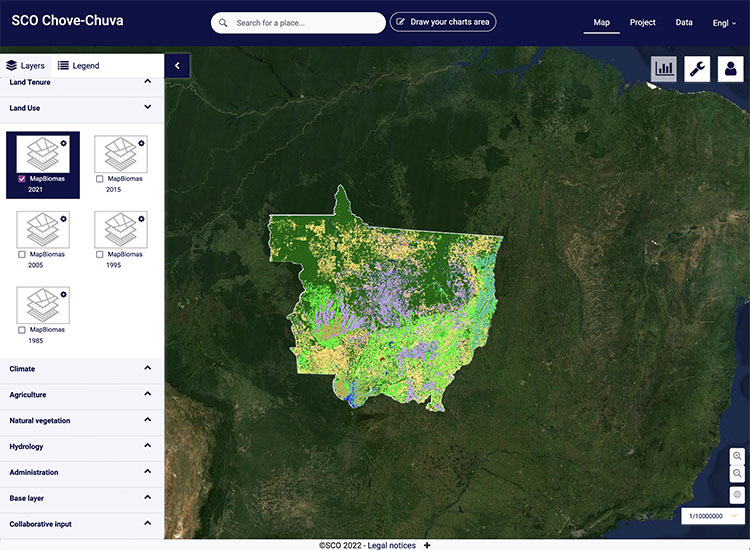
Developed in the Mato-Grosso region (Brazilian Amazon), the Chove-Chuva demonstrator offers a map-based summary of the territorial dynamics observed in relation to the adaptation and mitigation strategies put in place.
Using multisource data, the tool can produce a 'dashboard' of the territorial situation for an area predefined by a user, based on synthetic indicators covering 4 major themes: climate (rainfall), forest cover, water (hydrology) and agriculture (surface area and practices).
🟢 Free access
Preserving the bocage network
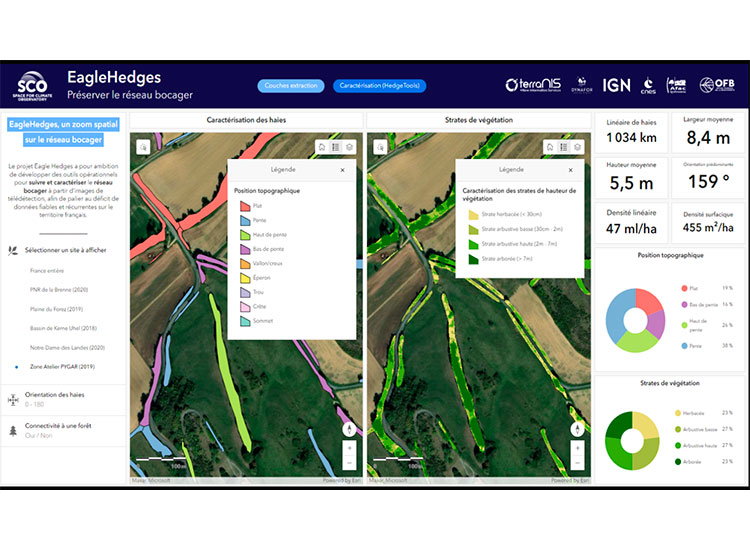
Hedgerows are excellent levers for the resilience of territories to climate change and for maintaining biodiversity. EagleHedges has developed operational tools for monitoring and characterizing the bocage network using Earth observation images and very high-resolution 3D models, in order to make up for the lack of reliable, recurring data on the state of the French bocage. The project team is working to extend the tool to other territories and, as new needs arise, to extend its functionalities.
🟢 HedgeTools, the hedge characterization tool, is available as an open-source QGIS plugin.
🔵 Automatic hedge detection service available on request.
Identify and visualize agricultural wasteland
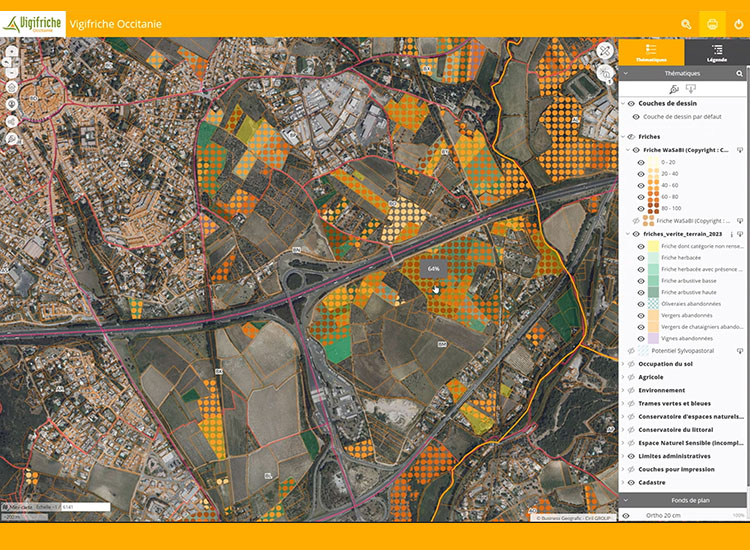
The Izifriche solution is a comprehensive support service for the identification and visualization of agricultural wasteland, aimed at local players wishing to act for the resilience of their territory.
Developed as part of the SCO FrichesAgricoles project, the method for automated identification of wasteland is based on the use of geographical and satellite data analyzed by the WaSaBI ©CNES software's Artificial Intelligence, at the scale of the entire Occitanie region (France). The parcel data from the regional inventory of wasteland is used in a web interface equipped with numerous geographic databases, providing a global vision of the issues at stake at different territorial scales (commune, inter-commune, département).
🔵 Service marketed by Safer Occitanie from June 2024.
Improving coastal governance
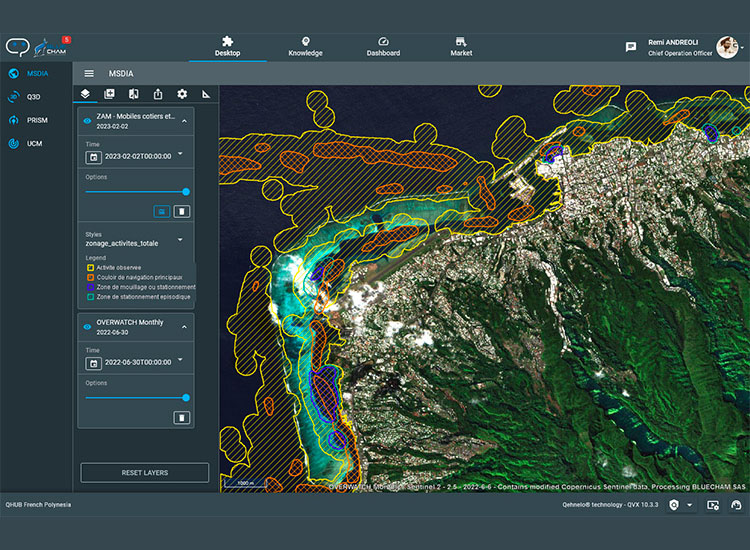
Developed by the company BlueCham on Tahiti and a Tuamotu atoll (Tahatai project), the QVX-PF platform offers new digital resources for the governance of the coastal zone, a privileged place for exchanges between land and sea parties. The interface displays three indicators: water quality, anthropogenic pressures in the lagoon environment (including automatic boat detection) and anthropogenic pressures on the coastline (land use).
Development is continuing through the Tahatai Neo project to deploy the system throughout Polynesia and then internationally.
🔵 Commercialised service, access to QVX-PF requires an account and password.
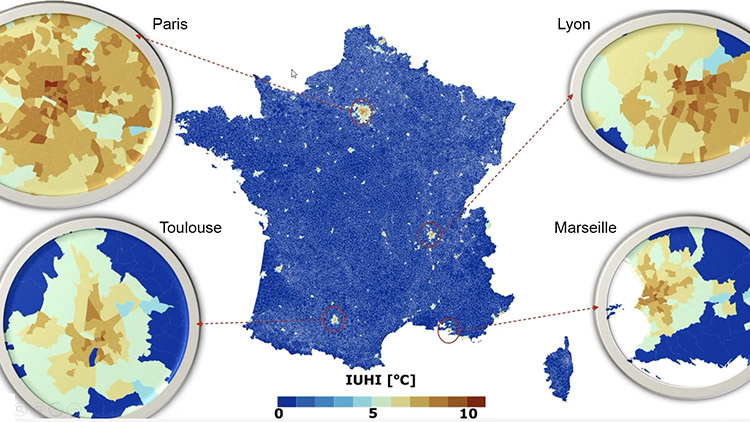
Urban overheating indicators
The Sat4BDNB project has made it possible to quantify the urban heat island (UHI) effect on the scale of metropolitan France, and to derive 4 decision-support indicators linked to urban overheating:
- Mitigation strategies index
- Investment cost index
- Mitigation effectiveness index
- Population heat vulnerability index
🟢 The data is freely available on data.gouv.fr and, from April 2025, in the French national building database BDNB
🟢 The project has also operationalized albedo production on a national scale, the collection is freely available on Theia.
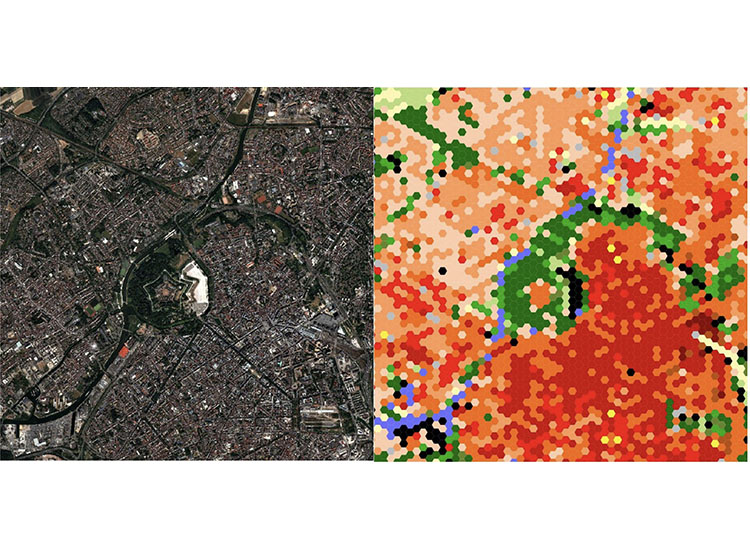
Identifying the vulnerability of urban environments during summer heat waves
Developed in the cities of Lille (France) and Rayong (Thailand), the project has established a methodology for classifying local climate zones derived exclusively from very high-resolution satellite images.
The issues identified are the vulnerability of urban environments during summer heat waves, and the adaptation and mitigation of local heat peaks.
🟢 The application's coding is open-source on Cerema's github and can be transposed to any city. Shapefile files for Lille and Rayong are available to download in the Resources section of the project page.
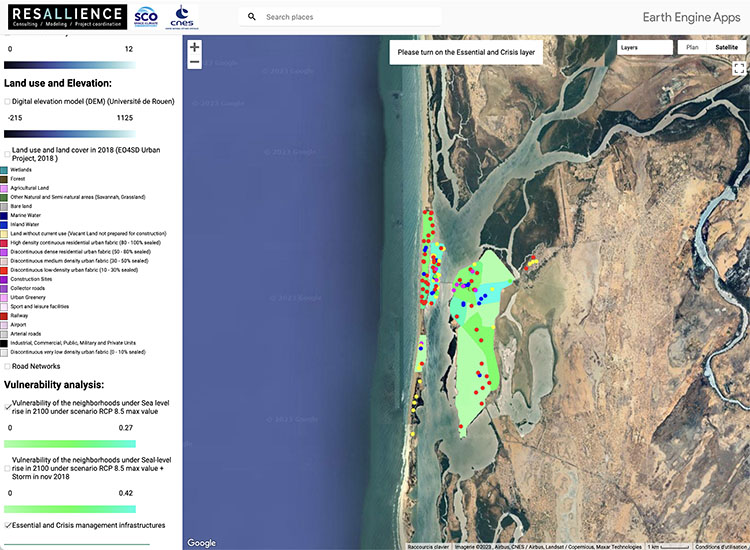
Assessing the vulnerability of coastal populations and economic activities
Developed for the city of St Louis in Senegal and replicable for other coastal areas, the SCO St Louis interface combines all types of data to estimate the socio-economic vulnerability of coastal cities to the effects of climate change and raise awareness among local players.
The mapping platform can be used to select and combine several layers of information, including historical floods, land use and essential infrastructure, as well as simulations of marine and river flooding according to different IPCC scenarios.
🟢 Free access
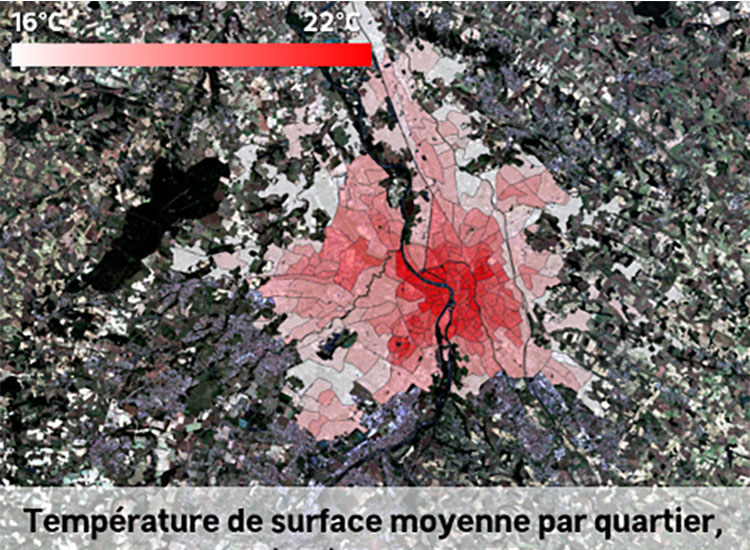
Thermography of cities from space
A pioneering project to learn how to use satellite thermal data in cities, Thermocity has delivered a collection of analysis-ready-data thermal images. This collection has been used to generate 4 major product families:
- Evolution of impermeability/artificialization and characterization of vegetation in the city;
- Detection and characterization of thermal anomalies;
- Mapping urban heat islands and diagnosing vulnerability to the associated heat ;
- Urban climate modelling: cross-validation and future climate.
🟢 Free access